Europe’s Center is CRUMBLING: VGK on the Brink? 🚨 Europe’s Center is CRUMBLING: VGK on the Brink? 🚨
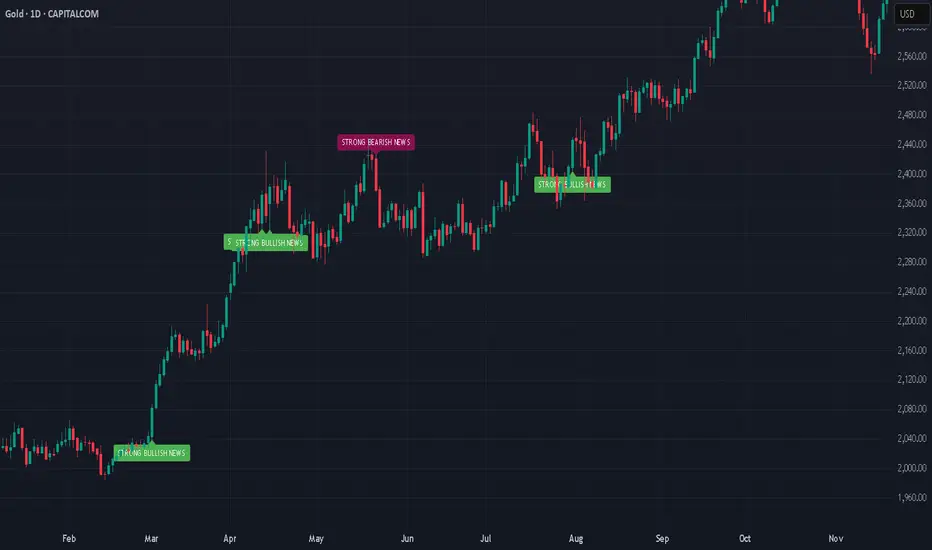
Europe’s elections just lit a FUSE! 💥 Poland (May 18), Portugal (May 18), and Romania (May 4 & 18) held off populists, but the center’s hanging by a thread—50% in Poland went right-wing, Portugal’s Chega is shaking things up.
Immigration and globalization fury could rattle EU trade & policy. 📉 VGK ($75.53) is inches from its yearly high ($75.56)—ready to crash or soar?
💡 Trade Idea: Plot VGK price action with election dates (May 4, May 18, June 1, 2025) to spot volatility breakouts. Watch for support near $70 or resistance at $76.
❓ Your Move? Will VGK tank or rally on Europe’s chaos? Drop your trade below! 👇
Markets

Why The Asian Session MattersThe Asian session is often dismissed as slow or irrelevant, but it plays a critical role in shaping the trading day. It does not usually deliver large directional moves, yet it lays the groundwork for what follows. Traders who ignore it miss important information about liquidity, positioning, and intent.
During the Asian session, liquidity is thinner and participation is more selective. This environment favors balance rather than expansion. Price often rotates within a defined range, building inventory and establishing short-term equilibrium. These ranges are not meaningless. They become reference points for later sessions, especially when London and New York enter with increased volume.
One of the key functions of the Asian session is liquidity placement. Equal highs, equal lows, and compressed ranges formed overnight attract attention during the active sessions. These levels act as magnets. When London opens, price often targets Asian highs or lows to access resting orders before choosing direction. Traders who understand this stop treating these moves as randomness and start seeing them as preparation.
The Asian session also reveals early bias. A market that holds above key levels overnight shows different intent than one that grinds lower into them. While this does not confirm direction, it provides context. Strong acceptance or repeated rejection during low participation hints at where larger players may later apply pressure.
Volatility behavior matters as well. Because ranges are typically tighter, breakouts during Asia often lack follow-through. Traders who chase them provide liquidity. Traders who wait use the session to define boundaries and plan execution for higher-volume hours. This improves timing and reduces unnecessary drawdown.
Another overlooked aspect is risk calibration. The Asian session shows how price behaves when participation is limited. If structure already weakens or levels fail during Asia, continuation during active sessions becomes less likely. If structure remains intact, probability improves once volume returns.
The Asian session is not about trading aggressively. It is about observation and preparation. It defines levels, reveals early behavior, and sets traps for impatience. Traders who respect its role enter the main sessions with clearer context, better location, and fewer emotional decisions.

EUR/PLN Outlook: Why the Zloty is Poised to Break 4.20The Euro to Polish Zloty (EUR/PLN) exchange rate is hovering at 4.2145 , consolidating after a year of steady appreciation. Despite a minor uptick in recent trading, the broader trend points decisively downward. The pair is trading 1.1% lower than a year ago, reflecting a structural shift in investor sentiment toward Warsaw. Forecasts now point to a breach below 4.20 in the coming weeks, driven by a unique convergence of macroeconomic resilience and geostrategic relevance.
Macroeconomics: The Inflationary Floor
Poland’s disinflation narrative is robust but complex. December inflation slowed to 2.4% , undershooting expectations due to falling food and energy costs.
* Monetary Policy: The National Bank of Poland (NBP) holds the reference rate at 4.00% . Markets have already priced in 75 basis points of cuts for 2026.
* The Surprise Factor: With easing expectations fully discounted, the NBP lacks room to surprise dovishly. Conversely, sticky core inflation driven by wage growth forces the central bank to maintain a "higher-for-longer" stance relative to the ECB, favoring the Zloty.
Geopolitics & Geostrategy: The NATO Bulwark
Poland’s currency benefits from the country’s pivotal role in European security architecture.
* Strategic Hub: As the logistical center for NATO’s eastern flank, Poland attracts sustained Foreign Direct Investment (FDI) in defense and infrastructure. This capital inflow creates a structural demand for the PLN.
* EU Relations: Improved relations with Brussels have unlocked cohesion funds, further stabilizing the balance of payments and reducing the risk premium previously associated with Polish assets.
High-Tech & Industry Trends
Poland is rapidly transitioning from a manufacturing hub to a technology exporter.
* Service Exports: The booming IT services sector acts as a counterweight to the goods trade deficit. Polish software houses and fintech firms generate significant Euro-denominated revenue, which they convert to Zloty for operations, providing constant buying pressure.
* Patent Analysis: A surge in patents related to fintech and cybersecurity solutions highlights Poland’s move up the value chain. This innovation-driven growth fosters a "strong currency" economy, distinct from low-cost emerging markets.
Cyber & Science: Digital Sovereignty
In an era of hybrid warfare, digital resilience is an economic asset.
* Cyber Defense: Poland has emerged as a regional leader in cybersecurity, effectively countering threats from the East. This digital stability reassures foreign institutional investors, reducing capital flight risks during geopolitical flare-ups.
* Science & R&D: Increased government spending on scientific research, particularly in green energy transition, aligns Poland with broader EU industrial trends, ensuring long-term competitiveness.
Economics & Labor Dynamics
The Polish labor market remains historically tight, supporting consumption.
* Wage Pressure: Real wage growth continues to fuel domestic demand. While this complicates the inflation outlook, it ensures the economy expands faster than the Eurozone average.
* Management & Leadership: Polish corporate leadership has shown remarkable agility, pivoting supply chains and adopting automation to offset labor shortages, maintaining margins despite rising costs.
Conclusion
The EUR/PLN pair faces a "sell the rally" environment. With NBP cuts already priced in and the Polish economy outperforming its Western peers, the path of least resistance is lower. A break below 4.20 appears imminent, confirming the Zloty’s status as one of Europe’s most resilient currencies in 2026.

BTC Update — 92K Zone as Bull Run Trigger (100K+ Scenario)Bitcoin is approaching a critical decision zone around 92K, which is acting as a major pivot for the next macro move. Price action shows consolidation and higher acceptance just below resistance, suggesting strength is building rather than distribution.
Why 92K Matters
📍 Key reclaim zone: 92K has historically acted as a strong resistance/support flip.
📈 Structure shift: Sustained trading above this level would confirm a higher high on the intraday structure.
🔊 Volume context: Current compression indicates that once volume expands, the move could be fast and directional.
Bullish Scenario
A confirmed breakout and hold above 92K can be the start of a broader bull phase.
From this zone, BTC has a high probability to accelerate toward 100K+, with momentum-driven extensions possible once psychological resistance is cleared.
Pullbacks above 92K would likely be seen as retests, not reversals.
Invalidation / Risk
Failure to hold 92K after a breakout would delay the move and keep BTC range-bound.
As long as price holds above the current base, downside risk remains controlled.
Summary
This 92K zone is the ignition level.
If BTC accepts above it with volume, the market structure opens the door for a strong bullish continuation toward 100K and beyond.
📌 Patience here is key — confirmation turns this zone into the launchpad.

The Christmas Effect: Why Markets Slow Down Before They MoveEvery December, traders ask the same question:
Will we get a Christmas rally?
But the real lesson Christmas teaches the market isn’t about rallies.
It’s about behavior.
1️⃣ Christmas Is a Liquidity Event 🎄
As the year comes to an end:
- institutions reduce exposure
- desks thin out
- volume drops
- participation becomes selective
This doesn’t make markets weak.
It makes them quiet .
And quiet markets are where structure forms.
2️⃣ Low Activity Doesn’t Mean No Opportunity
During Christmas weeks, price often:
- compresses
- ranges tightly
- respects key levels
- moves slowly
Many traders mistake this for boredom.
Professionals see it differently.
Low-volatility environments often act like wrapping paper...
they hide the move that comes after the holidays.
3️⃣ Why Breakouts After Christmas Matter More
When markets return to full participation in January, two things happen:
- liquidity comes back
- intent becomes clear
That’s why post-Christmas breakouts tend to be:
- cleaner
- more directional
- better sustained
The move doesn’t start with fireworks.
It starts with patience.
4️⃣ Christmas Rewards the Prepared Trader
While most traders look for action, experienced ones:
- mark levels
- define scenarios
- reduce overtrading
- protect capital
Christmas is not about forcing trades.
It’s about preparing for the next chapter.
Final Thought 🎄
The market doesn’t move because it’s Christmas.
It moves because participants return.
And the traders who respect the quiet season
are usually the ones best positioned when the noise comes back.
So here’s the question:
Are you trying to trade Christmas… or preparing for what comes after it?
⚠️ Disclaimer: This is not financial advice. Always do your own research and manage risk properly.
📚 Stick to your trading plan regarding entries, risk, and management.
Good luck! 🍀
All Strategies Are Good; If Managed Properly!
~Richard Nasr

GBP/AUD Forecast: Strategic Divergence & Market ShiftsStrategic Outlook: The Sterling Breakout
The Pound Sterling (GBP) has established a dominant position against the Australian Dollar (AUD) as 2025 closes. This shift represents a fundamental divergence in national economic strategies, not merely market fluctuation. The Bank of England (BoE) executed a "hawkish cut" to 3.75% in December, signaling long-term stability. In contrast, the Reserve Bank of Australia (RBA) remains paralyzed at 3.60% due to persistent inflation. This analysis dissects the geopolitical, technological, and industrial forces driving this volatility.
Macroeconomics: The Central Bank Divergence
The core driver of the GBP/AUD rally lies in contrasting monetary policies. The BoE managed a delicate pivot in December. By cutting rates while warning of inflation, they maintained yield appeal. Markets interpreted this decisiveness as strength, bolstering the Pound. Conversely, the RBA faces a credibility crisis. Australian CPI remains stubbornly high at 3.8%. Yet, the RBA held rates steady, fearing a mortgage cliff. This hesitation signals weakness. The "yield advantage" now firmly favors London over Sydney.
Geopolitics & Geostrategy: Risk Aversion Protocols
Global instability disproportionately harms the Australian Dollar. As a "risk-proxy" currency, the AUD suffers when tensions rise in the Indo-Pacific or Eastern Europe. Investors flee to safe havens or deeper liquidity pools like the GBP. Furthermore, the UK-Australia Free Trade Agreement has matured. While removing tariffs, it exposed Australia’s reliance on raw commodity exports. The UK’s pivot to high-value service exports insulates it better from supply chain disruptions. This structural imbalance currently weighs heavily on the Aussie.
Industry Trends: Services vs. Commodities
The UK economy is evolving faster than its Australian counterpart. Recent data indicates UK Intellectual Property (IP) investment surged by 15%. Britain is successfully transitioning to a high-value "intangible economy." Australia remains tethered to the "rocks and crops" model. While critical minerals are vital, global demand for lithium and iron ore has softened. This cyclical downturn in commodities drags the AUD down. The UK’s service-based resilience offers a more stable platform for currency appreciation.
Technology & Cyber: The Digital Trade Surplus
A hidden driver of Sterling's strength is the UK's dominance in digital services. Britain’s tech sector is leveraging AI to boost productivity. This export of digital solutions creates a "capital account surplus" that supports the GBP. In contrast, Australia faces a "cyber-sovereignty" challenge. As it digitizes mining operations, cybersecurity costs are rising. This increases operational overheads for major Australian firms. Consequently, foreign capital flows are hesitant, preferring the mature tech ecosystem of the UK.
Patent Analysis: The Innovation Gap
Patent filings reveal the future trajectory of these economies. UK firms are filing aggressively in fintech and biotech. This signals future revenue streams protected by global law. Australian innovation remains heavily concentrated in mining technology. While valuable, it is sector-specific. The lack of economic diversity in Australian patent data suggests a rigid business model. Investors prefer the diversified innovation portfolio of the UK, adding a premium to the Pound.
Leadership & Governance: Corporate Resilience
UK corporate leadership has adapted well to the "higher-for-longer" rate environment. FTSE 100 companies have successfully deleveraged balance sheets. This financial prudence attracts institutional investors. Australian management teams face different pressures. The heavy reliance on variable-rate borrowing in Australia squeezes cash flow. Business confidence in Sydney has dipped as leaders brace for potential rate hikes in 2026. This pessimistic corporate sentiment bleeds directly into the currency valuation.
Forecast: The Path to 2026
The immediate outlook for GBP/AUD remains bullish. The pair is likely to test new highs as liquidity thins over the holiday period. Traders should watch for signals of a pause in BoE cuts and critical Q4 inflation data from the RBA. The structural advantages of the UK economy currently outweigh the commodity potential of Australia. Position for continued GBP strength into Q1 2026.

Santa Rally / V-Shaped Recovery WatchNASDAQ:QQQ continues to respect the 50 & 100 DMA, just like every selloff since July. Momentum indicators are exiting oversold territory, suggesting a familiar upside rotation.
AMEX:SPY confirms.
AMEX:IWM remains structurally bullish on the monthly (cup & handle).
CRYPTOCAP:BTC shows classic oversold mean reversion behavior.
Key risk: loss of 100 DMA.
Bias: upside continuation while support holds.

ETHEREUM | THE MATH IS COMPLETE | SHORT SQUEEZE LOADING?Traders,
ETH is setting up for a potential big short squeeze that can rip price up hard. Let me walk you through the math, the order flow and the volume profile that are all pointing in the same direction.
1. The Fib math: 0.5 retrace into 2.0 extension
At point A ETH printed the last impulsive wave up before the dump. After point B the market sold off and then retraced exactly to the 0.5 retracement at point C.
Why 0.5 rotates into 2.0 from a math perspective :
A 0.5 retracement means price has pulled back 50 percent of the prior leg.
-> If AB is 1000 points, a 0.5 retrace gives a 500 point pullback.
In my Fibonacci Rotation table, 0.5 is paired with 2.0 because they are exact reciprocals.
-> 1 divided by 0.5 equals 2.
So when the market respects the 0.5 retrace, the natural projection is the 2.0 extension in the opposite direction.
-> You are effectively rotating the same structure: halve in the pullback, double in the extension.
On this chart that 2.0 extension lands right into the $2880 to $2890 area. From C that 0.5 retrace is not random. It is the anchor that mathematically rotates into the 2.0 target and defines the first major squeeze zone above.
2. HTF Fibonacci extension confluence
From there we step out to the higher timeframe structure.
We take a Fibonacci Extension and draw it:
From the highest point on the chart (X)
Down to the first big swing low (Y)
Then up to the next swing high (Z)
This measures the high to low structure and then projects extensions of that full swing.
On that HTF extension, the 1.618 level sits right in the same area as the 2.0 from the 0.5 rotation.
Why the 1.618 and 2.0 together are strong confluence :
1.618 is the classic golden ratio extension.
-> A lot of systems, harmonics and algos respond around 1.272 and 1.618.
2.0 is the clean reciprocal extension of the 0.5 retrace from the internal leg.
-> These two levels are calculated from two different swings.
One comes from the internal retracement structure.
-> The other comes from the higher timeframe swing.
When independent measurements give almost the same price area, that zone is not made up. It is where different groups of traders and different models will naturally cluster orders, targets and stops.
So $2880 to $2890 is a real Fib confluence, not a guess. It is a logical first destination for a short squeeze and it sits exactly inside the current FVG.
3. Fixed Range Volume Profile and the LVN at $2880
Now we bring in volume.
When we draw a Fixed Range Volume Profile from the swing low of 9 April to the swing high of 24 August, we see a very clean Low Volume Node (LVN) at roughly $2880. That LVN sits inside the same Fair Value Gap that price is currently exactly trading in.
What this actually means :
A Low Volume Node is an area where historically the market did not trade much.
-> Very few contracts changed hands there.
-> The auction basically skipped through that price zone.
In an auction model, high volume areas are where the market is comfortable.
-> Price spends time there, value is accepted, big rotations happen.
Low volume areas are the opposite.
The market rejected that area before.
-> Price moved through it quickly because either buyers or sellers completely dominated and there was no real back and forth.
So when price comes back down into an LVN inside an FVG like this, it tells me:
Price has moved back into an old inefficiency where previously there was no interest in building value.
If buyers are absorbing there (which we see from spot metrics), then the LVN can act as a springboard.
Either price slices straight through the LVN to the next high volume area.
Or price tags it, rejects sharply and uses it as the launch zone for the next leg.
In this case the LVN at $2880 is aligned with:
The 2.0 extension from the 0.5 rotation
The HTF 1.618 extension zone
The current FVG
That is a triple confluence of math, volume and inefficiency. Price did not randomly land here.
4. Spot A/D: hidden bullish accumulation
Now we go under the candles and look at order flow.
First is the A/D (Accumulation / Distribution) indicator, applied on spot and mainly on the 4H and higher.
Why A/D on spot and why on 4H plus :
Spot represents real ETH being bought and sold.
-> No funding games, less synthetic noise.
-> It shows where true demand is stepping in.
Futures can be distorted by hedging, arbing and leverage rotation.
On low timeframes there is a lot of noise from scalpers and short term spoofing.
-> 4H and higher smooth out that noise and reveal the bigger players.
What we see now:
On the spot A/D line both highs and lows have been trending higher.
Price, in the same window, is trending lower.
So price is making lower lows, A/D is making higher lows and higher highs.
This means:
On down moves, there is more volume being absorbed by buyers than being pushed by sellers.
Sellers are getting absorbed.
Smart money is accumulating spot while the chart still looks bearish to the average viewer.
That is textbook hidden bullish accumulation.
5. CVD and OI: shorts are loading into that accumulation
Now it gets even more interesting when we bring in CVD and OI.
5.1 Aggregated Spot CVD vs price
On 13 November:
Aggregated Spot CVD sat around -31.61k.
From that point it started trending up, forming higher highs and higher lows.
Today it is around 100.91k.
Change in Spot CVD:
100.91k minus -31.61k = +132.52k
So net buying on spot increased by about 132.5k units while:
Price moved from roughly $3150 down to about $2988
That is a drop of 162 dollars
162 divided by 3150 is about 5.1 percent
So we have:
A big positive flip in net spot demand
Only a small net drop in price
If bears were truly in control, that amount of spot absorption would not allow price to stay this close. You would see a much heavier breakdown earlier in the move. Instead buyers have quietly soaked up the selling and then pushed net CVD positive while price is only down around 5 percent.
This fits perfectly with the bullish accumulation narrative.
5.2 Futures CVD and OI
On the futures side:
Aggregated Stablecoin Margined Futures CVD dropped from about -408k to about -1.34M.
-> Roughly -932k more net selling.
Aggregated Coin Margined Contracts CVD dropped from about -88M to about -807M.
-> Roughly -719M more net selling.
At the same time:
Stablecoin Margined OI increased from 4.39M to 4.88M.
-> Increase of about 0.49M which is around 11 percent.
Coin Margined OI increased from 1.81B to 1.91B.
-> Increase of about 0.10B which is around 5.5 percent.
So futures traders are:
Aggressively hitting into the bid
Increasing net short pressure (CVD more negative)
Keeping positions open and even adding more (OI going up)
All of this while:
Spot is quietly buying
Spot CVD is strongly positive
Price is sitting in a triple confluence zone around $2880 inside an LVN and FVG
A simple way to think about it:
Spot is the strong hand slowly loading.
Futures is the weak hand aggressively shorting into that demand.
Price is held in a relatively tight range compared to the amount of futures selling.
Once that selling slows or some catalyst hits, all of those shorts are fuel. They will have to cover into a thin LVN zone, through a Fib confluence and into areas where there was previously low participation. That is exactly how you get fast vertical moves.
6. USDT.D confluence
Now, when looking at the USDT.D chart on the HTF, we can see that it has rejected from the 0.886 retracement, broke structure and is now respecting a descending trendline, while RSI is showing heavy bearish divergence. This means that even though USDT.D tried to push higher, each push had less and less momentum behind it, and buyers of dominance are getting weaker. For crypto, that is important, because a topping and rolling over USDT.D often signals capital rotating out of stablecoins back into risk assets. In confluence with everything discussed before, this adds another layer to the thesis. Spot is accumulating, futures are overcrowded on the short side, ETH is sitting in a strong Fib and volume confluence zone, and at the same time USDT.D is showing signs of distribution and potential downside. If USDT.D continues to bleed down from this 0.886 rejection, it structurally supports a scenario where ETH squeezes higher into the targets discussed.
7. Targets and the bigger picture
Based on this structure and the order flow, the upside targets I am watching are:
$3800
$4400
And if crypto gets proper momentum, a final Swing Fail Pattern around $5100
The logic behind these levels:
$3800 and $4400 are not random numbers. They line up with higher timeframe Fib extensions and prior structural pivots and volume distribution levels. Think of them as natural waypoints where bigger players will take profit, hedge or reposition.
$5100 is where I can see a classic SFP scenario:
We push into a new high.
Late buyers chase the breakout.
Existing shorts get squeezed.
Then once liquidity above the prior highs is taken, a sharp reversal becomes very likely.
So my roadmap is:
First we reclaim and rotate out of this $2880 confluence zone. Then $3800 and $4400 become realistic magnets. If the whole crypto complex catches momentum, $5100 as an SFP high is very much on the table.
Invalidation:
Invalidation for this specific bullish accumulation and squeeze thesis comes only if ETH starts trading below $2470. As long as we hold above that level, every dump is still in quiet bullish accumulation territory for me, unless order flow starts telling another story.
7. Conclusion
Fib structure points to $2880 as a key confluence level.
Fixed Range Volume Profile confirms this with a clean LVN inside an FVG.
Spot A/D and Spot CVD are showing bullish accumulation while price grinds down.
Futures CVD and OI show shorts loading into that spot absorption.
Upside roadmap: 3800, then $4400, with a possible SFP (Swing Fail Pattern) around $5100 if the trend extends.
Invalidation only if ETH starts trading below $2470. Until that happens, every dump for me stays in quiet bullish accumulation territory, unless order flow flips.
USDT.D confluence.
Same as always. This is not financial advice. Trade your own plan, size your own risk. I am just laying out the math, volume and order flow that I see behind this potential short squeeze on ETH.
Markets do not whisper without reason. When math, volume and flow all hum the same melody, I prefer to listen before the crowd hears the drop.
-------
If this spoke to the part of you that loves clean math and dirty squeezes, drop a like, leave a comment, and bookmark it. When the candles start to sprint, you will want to remember where the story was already written.
- ThetaNomad

SHORT trend to 91kthe same scenario like yesterday, touched already the stong resistance and now to 91k

Gold bullish breakout targeting 4140Gold price is showing strong bullish momentum, breaking above key resistance and turning it into support. Current price action suggests a possible pullback to the buy zone near 4,100 before targeting the next level at 4,140.

Gold Price Breakdown Setup Toward 3960 SupportGold price is trading near 3982, forming higher highs along a trend line. A potential breakdown below the trend line could trigger a move toward 3960 and 3929 support zones.

Gold Price Pullback Targets After Recent RallyGold price is trading around $3,980, showing a 1.22% gain on the 1-hour chart. The chart suggests a potential pullback with downside targets at $3,971 and $3,960 after recent bullish momentum.

Gold Price Breaks Support, Targeting 3950 ZoneGold price has broken below the trend line and key support zone, indicating bearish momentum. A retest of the broken support is expected before continuing down toward the target level at 3950.

Buy Bitcoin, Not bananas Since the last emergency update from Yellen to buy Bitcoin, we're up by approximately 260%.
In this next update from the Volcanic Miner Empire(VME) located in El Salvador, we're giving an "All Good" update. Buy Bitcoin, don't buy Bitcoin, buy bananas like Mark Cuban - whatever, we literally couldn't care less, lol.
BUT,
If you're a sensible entity browsing a website for good investment ideas, this setup should intrigue you. We have spent two-thirds of the year consolidating the previous all-time high on Bitcoin.
The world is easing monetary policy, markets are at all-time highs (with trillions of treasury notes expiring, freeing up more fiat and chasing more gains), and China is about to start handing out money in 500 billion increments to do nothing but invest in anything, for free, no risk... LOL. This is just the tip of the Volcano.
Impossible to tell you when this happens, but given macro events, it seems much sooner than later if this cycle is to confirm.
Do what you want, do it safely, and laugh at Cuban every time you eat/see/think about a banana.

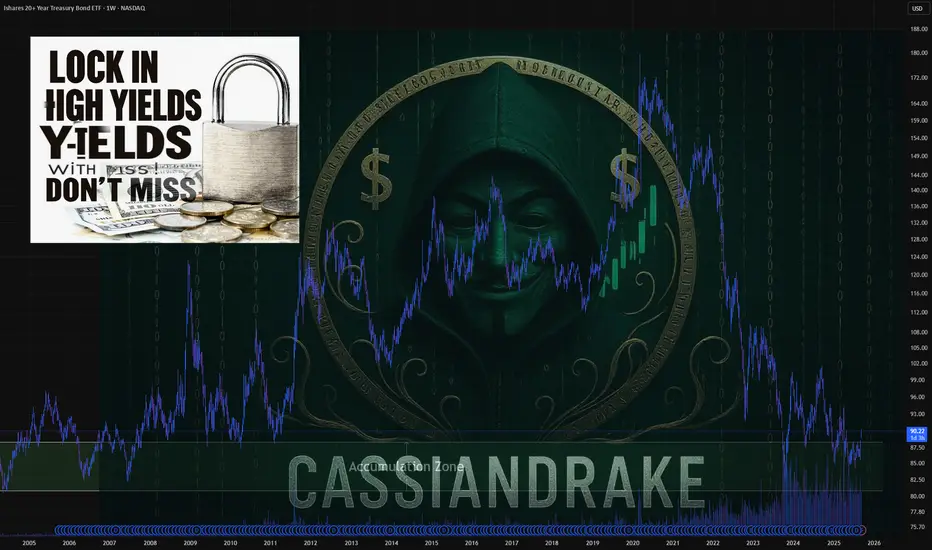
Why Now is the Best Time to Load Up on T-BillsIn 2025, investors have a unique opportunity to capitalize on high yields from Treasury Bills (T-Bills) as interest rates hover at their highest levels in years. With indications that the Federal Reserve may soon start cutting rates, now could be the ideal time to invest in T-Bills through the TLT ETF. This article explores why investing in T-Bills now could reap significant returns over the next decade.
Key Points:
Highest Interest Rates in Years:
Current interest rates on T-Bills are elevated, offering attractive yields for investors.
Historical data shows that such high yield opportunities are rare and may not be seen again for years.
Federal Reserve Rate Cut Expectations:
The Federal Reserve has signaled potential rate cuts due to concerns about job market stability and inflation trends.
Market expectations suggest that rate cuts may begin later in 2025, which could reduce yields on T-Bills in the future.
Strategic Advantage of T-Bills:
Investing now allows investors to lock in current high yields before potential rate cuts reduce returns.
T-Bills offer a safe investment with guaranteed returns, backed by the U.S. government, making them a low-risk option.
Why TLT ETF?
The TLT ETF provides exposure to long-term Treasury securities, making it an excellent vehicle for capitalizing on current high yields.
The advantages of using an ETF include ease of trading and diversification.
Conclusion:
With interest rates at a peak and expectations of future rate cuts, now is a strategic time to invest in T-Bills via the TLT ETF. By taking advantage of the current high yields, investors can secure returns that may not be available again for years to come.
TVC:DXY NASDAQ:MSTR TVC:GOLD TVC:SILVER BITSTAMP:BTCUSD $VNIDIA NASDAQ:TSLA VANTAGE:SP500
Why Most Traders Lose and How to Flip the Script
It’s no secret: most retail traders lose money.
Not because the markets are “rigged,” but because trading is a game of probabilities, discipline, and psychology.
Let’s break down why losses happen, the psychology behind them, and how to build a better plan to stay in the game long-term.
1. Why Most Traders Lose
There are a handful of mistakes that account for the majority of blown accounts:
🔸 Overleveraging – Using too much size turns small moves against you into catastrophic losses.
🔸 Lack of risk management – Without stop-losses, max drawdown rules, or position sizing, one bad trade can erase weeks of gains.
🔸 Chasing trades – Entering late after a big move due to FOMO, only to sell at the bottom.
🔸 No system – Random entries and exits with no strategy mean your results are left entirely to chance.
🔸 Emotional trading – Anger, revenge trades, and greed lead to impulsive decisions that sabotage even good setups.
Most traders know these mistakes on paper, but knowledge alone doesn’t prevent them. The real enemy is psychology.
2. The Psychology Behind Losing
When most people think about why traders lose, they picture bad entries or poor technical skills. But the truth is, the biggest battles aren’t fought on the charts—they’re fought in the mind. Understanding the psychology behind losing is critical, because it explains why traders keep repeating the same mistakes even when they “know better.”
Loss Aversion
Psychologists have proven that humans feel the pain of losing about twice as strongly as the pleasure of winning. In trading, this shows up in two destructive ways: holding onto losing positions far longer than we should, and selling winning positions far too early. A trader might watch a loss grow from -5% to -20% because closing the trade would mean admitting they were wrong. On the flip side, the moment a trade turns green, they take profit too quickly, just to escape the fear of it slipping back to red. Over time, this creates an inverted risk/reward profile—small wins and big losses—the exact opposite of what successful trading requires.
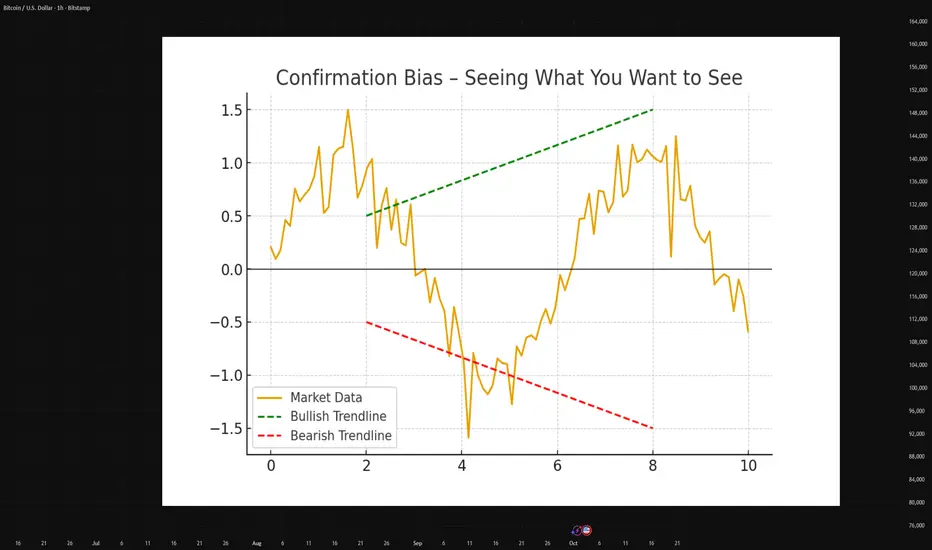
Confirmation Bias
Once a trader enters a position, the human brain naturally looks for reasons to justify it. They’ll scroll through charts, social media, or news feeds, paying attention only to the information that supports their trade, while ignoring anything that contradicts it. This tunnel vision can be deadly, because markets don’t care about opinions—they reward objectivity. A good trader must learn to question their own bias constantly, asking not “why am I right?” but “what would prove me wrong?”
Ego and Revenge Trading
Every trader knows the sting of a losing trade. But what comes next separates amateurs from professionals. The inexperienced trader often lets ego take over. Instead of stepping back, they try to immediately “win back” what was lost, usually by doubling their position size, rushing into another setup, or abandoning their strategy entirely. This revenge trading spiral often leads to much larger losses. The market punishes desperation, and it rewards patience. The ability to walk away after a loss and reset emotionally is one of the hardest but most valuable skills to develop.
The Illusion of Control
Many traders believe that the more time they spend staring at charts or the more trades they take, the better their results will be. This illusion of control often leads to overtrading, which drains both capital and emotional energy. In reality, trading is about probabilities, not control. No amount of screen time can eliminate uncertainty. The edge lies in preparation, discipline, and executing a plan—not in micromanaging every tick of price action. Paradoxically, the less you feel the need to control the market, the more control you gain over your own decisions.
3. How to Prevent Frequent Losses
The good news: most of these pitfalls can be managed with structure and discipline.
✔️ Risk Per Trade – Never risk more than 1–2% of your total capital on a single position.
✔️ Predefine Rules – Before you click buy/sell, know your entry, stop, and target.
✔️ Accept Losses – Treat them as the “cost of doing business.” Even pros lose 40–50% of trades.
✔️ Quality > Quantity – Fewer, higher-probability trades often outperform constant scalping or chasing.
✔️ Journal Every Trade – Write down why you entered, why you exited, and what you felt. This exposes patterns in your behavior.
4. Building a Better Plan
Trading without a plan is gambling. Building a system gives you consistency.
Define Your Edge: What makes your trade valid? Is it a technical setup, a market structure, or a specific confluence of signals?
Backtest Your Strategy: Test your rules on historical data before risking real money.
Stick to Probabilities: No setup wins 100%. Focus on consistency over a large sample size.
Emotional Control Routine: Walk away after a big loss, set daily limits, and never trade tired or stressed.
Takeaway
Most traders lose not because they’re “bad” but because they don’t treat trading like a business.
By mastering psychology, defining risk, and following a plan, you stop thinking in terms of single trades → and start thinking in terms of long-term probabilities.
Trading isn’t about being right every time.
It’s about surviving long enough for your edge to play out.
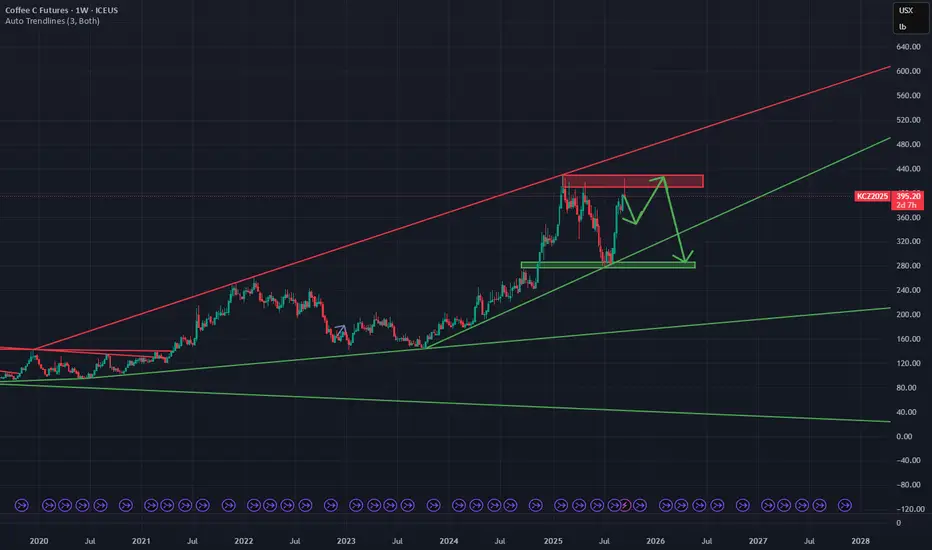
Short Arabica Coffee🔍 Setup
Price is approaching a well‐defined supply/resistance zone (red area on chart). Historically this zone has acted as overhead resistance.
Below, there is a green demand/support zone which should act as target support area.
My target on the short is around 7.8% downside from entry, with stop loss placed just above the resistance zone / recent swing high to limit risk.
📊 Fundamental & Sentiment Background (COT & Others)
According to the latest COT report (as of 9 Sep 2025), commercial hedgers are significantly net short in Coffee C.
tradingster.com
However, speculators / non-commercials are heavily net long. This suggests that bullish momentum is still in force.
tradingster.com
Open interest is rising, showing participation in current levels. This makes the risk of a breakout (to the upside) real, if bulls hold control.
⚠️ Risks to this trade
Momentum from speculators could drive price through resistance, triggering stop losses and a strong short squeeze.
Any unexpected fundamental shock (weather, export disruption, currency devaluation, etc.) could reduce supply or boost demand, pushing prices higher.
If volume doesn’t drop on advance into resistance, the upward move may be stronger than anticipated.
✅ Conditions / Trigger For Entry
I will consider entering the short position once:
Price touches or re-tests the red supply zone.
There's a clear rejection (candlestick reversal pattern + bearish confirmation).
Momentum or RSI / MACD divergence is visible.
Speculator net longs show signs of plateauing or declining in the COT (next report).
🎯 Targets & Risk/Reward
Entry: around current price near supply, or after confirmed rejection.
Stop Loss: just above resistance / recent high.
Target: green demand/support zone (approx. 7-8% downside).
Risk-Reward Estimate: aiming for at least 1.5-2x potential reward vs. risk, ideally better.
🧐 My Edge vs What Could Go Wrong
My trading strategy gives me an average short profit of 7.8%, so this is in line with my risk appetite. The probability for a profitable trade for a short position is 75%. However, on average I will lose 12% on a losing short trade.
But I’m aware shorting commodities is riskier when there's strong bullish positioning (as is the case with speculators now).
I will monitor upcoming COT reports and fundamentals closely — if speculators increase longs again, I might bail earlier or tighten stops.
Conclusion: The COT data does not overwhelmingly confirm a short at this moment. It offers partial support via hedger short positions, but speculator long bias remains strong. If price shows a credible technical rejection in the supply zone and sentiment shows cracks, I believe this short has good risk/reward.
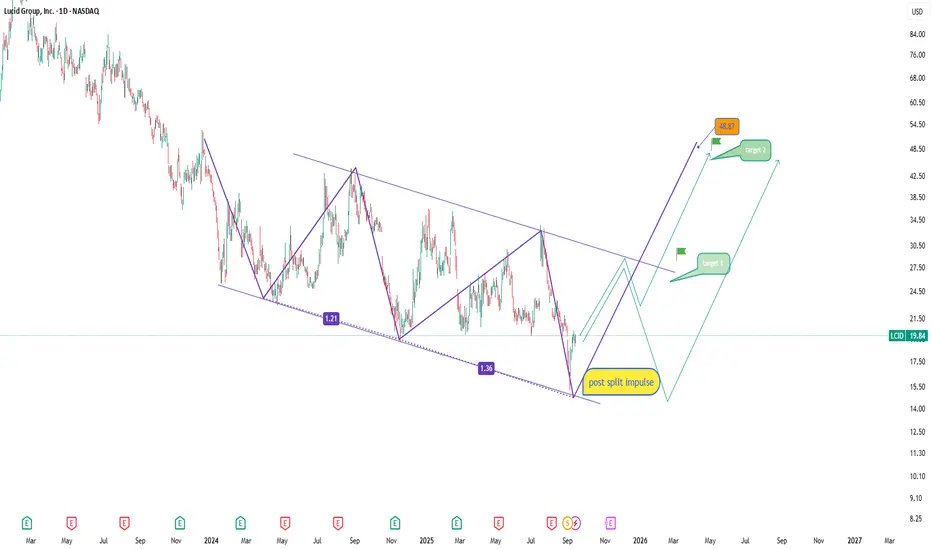
Lucid: post-split impulse and a chance for a new rangeLucid stock has absorbed the post-split selloff and is now showing signs of recovery. On the daily chart, price has moved out of the descending channel and consolidated above 19.50. The bullish scenario points to a first target at 27.00, where strong resistance is located. A breakout there could pave the way toward 48.00–49.00, marking a potential mid-term trend reversal.
EMAs are starting to turn upward, while volume is picking up, signaling increased buying interest. The key support lies in the 18.00–19.00 zone. As long as this area holds, the bullish case remains valid.
From a fundamental perspective, Lucid benefits from strong EV sector demand and continued backing from major investors in Saudi Arabia. Production challenges and high costs remain risks, but overall EV market growth provides optimism.
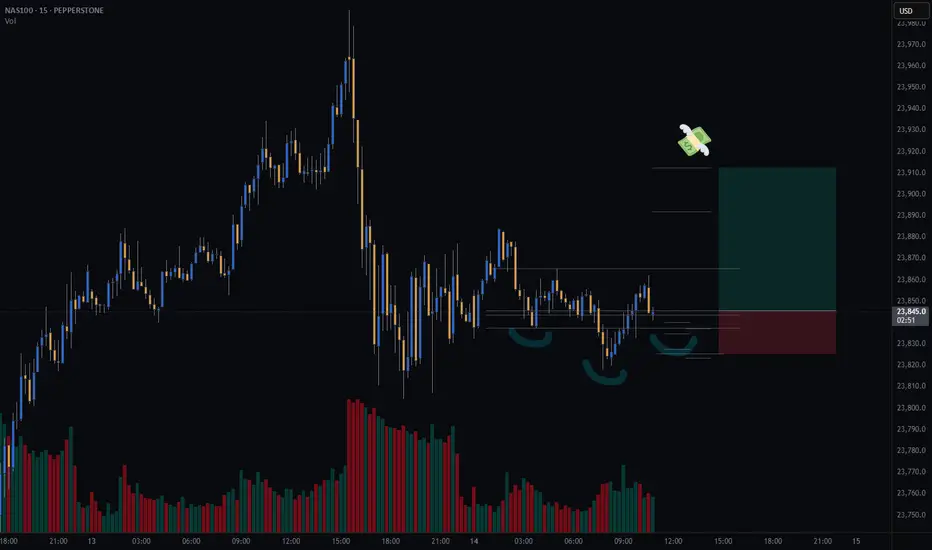
Potential inverse head and shoulders on NASDAQ (CASH100) - 15minI’m watching the Cash100 for a potential long setup.
On the 15min chart, an inverse head and shoulders pattern appears to be forming — potentially a continuation pattern following this week’s strong upward move.
I’m still waiting for confirmation of key variables, which will be assessed at 11:30am (GMT+1).
Trade Details:
📊 Risk/Reward: 2.4
🎯 Entry: 23 845
🛑 Stop Loss: 23 825
💰 Take Profit 1 (50%): 23 891
💰 Take Profit 2 (50%): 23 912
#GTradingMethod Tip: Lower volume on the right shoulder vs. the left shoulder strengthens the setup.
Please note: This is not financial advice. This content is to track my trading journey and for educational purposes only.
Has Gold finally topped?Since December 2024, gold has held above a key diagonal support line (see chart).
On 25 July 2025, price broke below a medium-term diagonal support — and recent action looks more like a break-and-retest than a full recovery.
The Chaikin Money Flow is also showing negative divergence, suggesting buying pressure is weakening even as price tried to push higher. That’s often a warning sign for potential trend reversals.
Could this be the start of a deeper move down, or just a pause before new highs?
What’s your take — has gold topped?

Big CorrectionThe S&P index.
The chart shows the potential end of the final rally from the 2009 low.
Currently, with this rally from the recent 4,800 low, we are still in a correction period that will end in late October (highs and lows are irrelevant), & We have a date coming up in August so let's see what happens there.
After this period, we will have a rally combined with uncertainty and unjustified speculative movements (bubble) that could take us to the final peak, which I expect in 2026.
This remains a possibility, but don't base your trades on it. However, caution is often good.

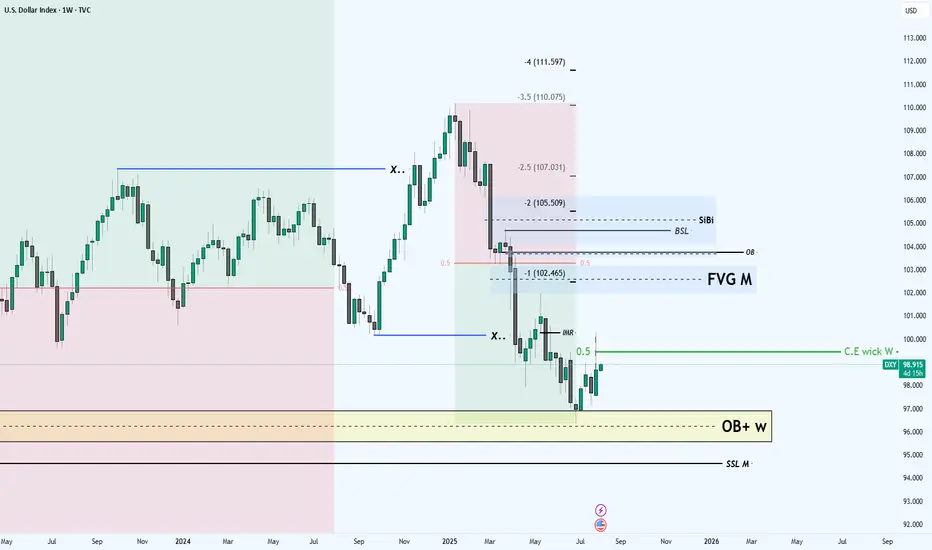
future of the DXYHi to every one
In the DXY we are in the middle of the decisioning area which means
we should wait for the market to show its hands
First sensitive level that i am looking for is the C.E of the weekly candle(Prev.week)
IF we get resistance at that level we can wait for the price to deep into the SSL M level
Other wise i don't see any indication and obstacle for the DXY to reach the OB level above the 0.5 mid level of the range
this is my the first low hanging fruit objective which is high probability
after that my ultimate objective is the SiBi to be rebalanced
This was the technical perspective
BUT
things are happening around the world the most important one is the
USA central bank Interest Rate Cutting Decision which can leads the DXY to go lower without retracting to the 0.5 of the range
this factor also should be considered BUT overall i am bullish for DXY
Gold - Powerful RunAfter its powerful run, gold has shown signs of fatigue, stalling near technical resistance between $3,330–$3,350 per ounce in late July. Analysts warn that while the bullish trend remains intact on a structural level, daily volatility is high and some profit-taking or consolidation could continue unless new destabilizing events emerge.
Will the Rally Continue?
The Bull Case
Structural Demand: Multiple sources, including J.P. Morgan and other major forecast groups, predict gold’s structural bull case remains strong with average prices of $3,220–$3,675 per ounce likely through the end of 2025, and even $4,000 possible by 2026.
Ongoing Uncertainty: Persistent geopolitical risks, trade disputes, and fiscal pressures are expected to maintain robust safe haven flows into gold.
Central Bank and Asian Demand: Sustained buying by central banks and consumers in Asia could provide a solid floor below current levels.
The Bear Case
Interest Rate Dynamics: If central banks, especially the US Federal Reserve, hold or increase interest rates, gold could lose momentum, higher rates increase the opportunity cost of holding non yielding bullion.
Diminishing New Risks: Unless fresh economic or geopolitical shocks appear, further upside may be capped in the near term. Several experts predict gold may consolidate or trade sideways pending new catalysts.
Speculator Flows: Rapid speculative bets could lead to sharp corrections, particularly on technical breakdowns after such a strong rally.
Conclusion
The gold rally of 2025 has been driven by an unusual mix of global volatility, central bank behavior, and shifting investor psychology. While prices could pause or pull back in the coming months, the fundamental supports structural demand, central bank buying, and persistent global risks, suggest that the broader gold bull cycle is not yet over, with $3,000+ likely forming the new base for gold as we look toward 2026.
*NOT INVESTMENT ADVICE*
#gold #safehaven #uncertainty #economy #finance #trading #indicator