Time To Bail? Distribution Megaphone At Top Of ChannelEuro is at top of a number of downward channel trend lines and is printing a megaphone pattern. This looks like distribution as the larger traders dump positions into the order book and widen its range.
Selling from the top of the day here could be a very good swing position short. I also have a short bias intraday.
Megaphone

S&P500 Gaps Down -4%#sp500 #spx #sp1! – S&P500 futures have once again gapped down as markets reopened for trading tonight, currently down -137 points for a -4.6% loss.
Price is now below the 50% Fibonacci retracement level which is the midpoint between the low seen in October 2018 and the high made in February 2020. 50% retracements after a large/long uptrend are generally viewed as healthy corrections within the overall price advance and represent good buying opportunities, while further declines below the 50% Fib indicate that the previous bull trend is at risk of turning into a bear trend, at least in the short-term. A sign that the bull trend is likely over and a new short-term bear market is forming would be a move below the 61.8% fib level which is the golden ratio retracement. Should price fail to regain the 50% level this week, the likely target will be the 61.8% fib shown in red at 2729 which would be another -3% decline from current price.
Also in the chart is a broadening wedge pattern, also know as a megaphone pattern due to its shape resembling a megaphone. A broadening wedge is a range where price is holding between two diverging trendlines, or lines that are moving apart. These lines are where traders can expect price to trade between, or find support and resistance at. A break above the upper wedge line is viewed as bullish and the beginning of a new uptrend, while a break below the lower wedge line is viewed as bearish and the beginning of a new downtrend.
In October of 2018 price broke above the upper wedge line and began the climb to new all-time highs peaking in February of 2020. While this move was viewed as bullish uptrend continuation, price has now fallen back within the wedge indicating that the previous break above it was a blowoff top rather than uptrend continuation. Now that price is back within the broadening wedge pattern, the potential for a test of the lower wedge line is now a possibility.
For now the level to watch this week, or possibly even on Monday, is the 61.8% Fibonacci retracement level highlighted in red. A move below this level is likely this week considering the coronavirus fear currently gripping markets and its impact on not just the US economy, but also the global economy. This weekend saw the situation deteriorate in regard to the virus and the climbing infection and death rates in the US, as well as new fears launched by Saudi Arabia as they attempt to put US shale out of business by increasing oil production which as of now as oil trading -22% lower than Fridays close.
It appears as though this week could be even more volatile than the previous two weeks, which both saw record price moves, moves not seen since the global financial crisis in 2008. We may be in for another emergency rate cut by the Federal Reserve ahead of their planned meeting which takes place March 17th-18th. Two emergency rate cuts within two weeks would be another new milestone and further evidence that the US economy is teetering on the edge of financial disaster ahead of what appears to be an inevitable slowdown in economic activity.

ETHUSD, Megaphone pattern with strong resistanceHi guys another megaphone pattern for “color options” traders. The resistance line has been touched 5 times already and there was no break. Also, the volume is dropping, it could mean that the interest to break this resistance isn’t there. So I will enter short trade when first red candle forms after last green candle that touched resistance line.If resistance gets broken before my entry conditions are met, I will abandon this set-up. As soon as my entry conditions are met, I will start buying “red options” on every consecutive candle(max 10 trades). My rules are the same as before:
If you have questions about candle color options or wish to discuss trading strategies in real time, join - candle color options - chat, right here on tradingview.
Rules:
7.Worst case scenario: if I will have 4 losing candles in a row, I will take my losses and look for a new set-up.
8.Best case scenario: If I will have 4 winning candles in a row, I will gladly take my profits and look for a new opportunity.
9.I will not trade more then 10 candles in a row and I will stop trading if I am up by 4 winning trades.
For example: if my first candle is a losing candle but the next 5 candles are winners, then I will stop trading, since I will be up by 4 wins (5 wins - 1 loss = 4 wins).
Please follow, like and comment !

EURUSD Megaphone patternEURUSD is showing a megaphone pattern with next target 1.135 (Weekly 200 SMA) and the 161.8 fibo extension from 1.08792 to 1.11795.

BP BreakdownBP breakdown out of its megaphone pattern. The backtest was unsuccessful.
However, a strengthening '£ vs. $' might encourage it higher. Worth watching.

XAAUSD Megaphone Pattern - Long Term buy IdeaIt's possible to create Megaphone Pattern. It can reach 1600 within next month.

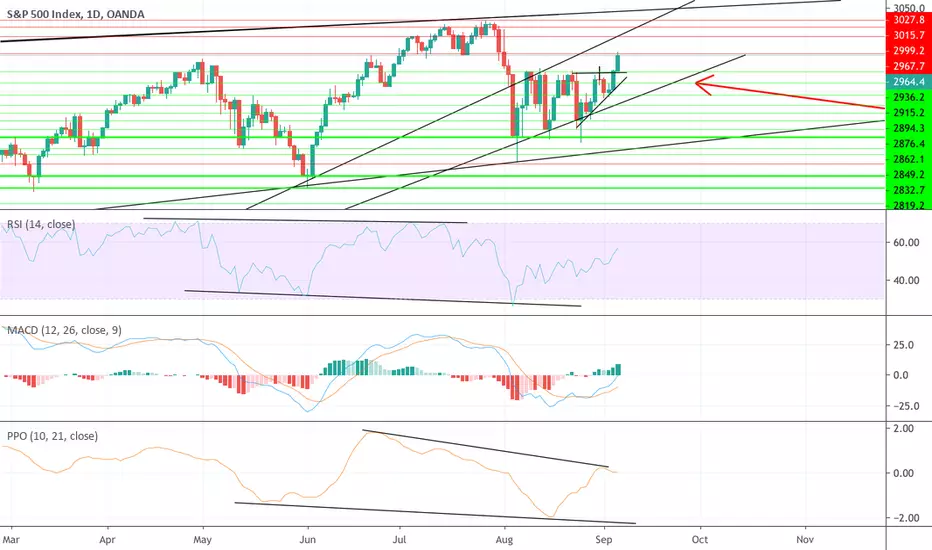
Bulls Win, But Not So FastSo on the after hours we have broken to the upside the next step would be a daily close to the upside. This is Bullish make no mistake about it. However, where are we really going to go 3050 is only 3% away. Remember the longer term charts are still very bearish. We still have the potential head and shoulders forming along with a long-term Megaphone pattern that so far has broken to the downside. I would not buy this breakout rally yet; we are overbought on short term and have bearish divergence, I want to see more evidence for the bull case.
There are three potential scenarios:
Trump tweets something and the breakout is sold off and they open the trap door, or some other negative news it proves to be a false breakout. More potential evidence is the fact that we are overbought on the short term charts and have bearish divergence.
We slowly move up for the next weeks / maybe months but will eventually be sold off.
The Megaphone proves to be a false break to the downside and we break out to the upside and go much higher- 10% or more above all time highs.
Megaphone Pattern - Backtesting Downside BreakWill it prove to be a false downside breakout? If it proves to break to upside that would mean there is significant upside left in this market. I think this is unlikely, higher probability of continuing the break to the downside and right now we are just backtesting.
REMEMBER: THE GOAL OF THE MARKET IS TO FOOL AS MANY TRADERS AS POSSIBLE (MAKE EVERYONE THINK WE ARE GOING UP, WHEN WE ARE GOING DOWN) (MAKE EVERYONE THINK WE ARE GOING DOWN WHEN WE ARE GOING UP)

US 30 Bear Trend: Megaphone Tar Double Bottom Crash Landing SiteUS Equities in downtrend off ATH from July. Price action strongly mimics last year's selloff behavior. Pull chart right to see the 2018 Megaphone. Targets in chart are determined by TL defined by these Megaphones. Price labels are estimates and actual prices of course will vary; past performance is no guarantee of future results!
2019 Megaphone is Bigger and the subsequent Great Drop will be deeper. Currently trades near top of retracement in 'h' pattern which Time Cycles (green ribbon) suggest should complete on or about 14 August, coinciding with Full Moon on 15 August. We got a 62% retrace in NQ and ~50% in Dow. Expect to rollover at or near 26500, has traded to 26400 so far, maybe already done; or might have one push left, exact price is chance.
Near-term bottom of the 'h' right leg should end up at or around 24750 +/- 80 pips on or about Monday, 26 August by Time Cycle, coinciding closely with New Moon on August 30, when price should rally a final time. Exact price is chance. Expect a monster relief rally there until 14-17 September, coinciding with Full Moon on 14 Sep, to around 25800 +/- 200 pips; these rallies carry index above the 'h' hump, should get to the upper TL on megaphone. Again, exact price is due entirely to chance. Apres ca; la deluge.
The Big Sell may commence on or about 17 September (Constitution Day, and the 167th anniversary of the Antietam battle, AKA Sharpsburg, after the Full Moon.
www.history.com
Selling may be expected to last for six weeks in an unrelenting downdraft, culminating in a panic crash to a lower low than 24 Dec, and forming a giant annual 'h' terminating on or about Tuesday, 29 October, coinciding with the New Moon on Monday, 28 October.
NB: IMO it is not coincidental that 28/29 October 1929 were also on a Monday and Tuesday; eerily the waning Moon cycle ended on 30 October 1929, with New Moon on 31st.
www.calendar-12.com
"Black Magic!" you say; but biologically, these patterns are borne out time and again by history; the madness of crowds and human mood is definitely influenced by Circadian Rythym, and closely tied to Lunar Phasing. Gravity waves have been detected on the floor of the NYSE, LOL!
The negative impulse should form a true Elliott wave 5-wave impulsive pattern with three major selling waves and two weak countertrend waves. I did not show these in chart for clarity, as we approach the event future ideas I will publish these waves as they unfold.
As always, this is just another addle-pated, crackpot idea and clearly does not constitute any sort of investment advice.
That being said; I must observe I accurately predicted the May ABC correction and subsequent ATH, see published links below.
We are currently in Distribution Phase of the final leg of a monster bull market, so please: Trade at your own risk; GLTA!

TXN: Top of range of bearish megaphone patternOver the same time fame as the TSMC channel, TXN has been trading in a bearish megaphone pattern and has hit the $117 top of range level for the 6x. No reason to believe the 6th time would be any different from the earlier 5 occurrences.

Softbank: Trading at top of megaphone patternSoftbank has come under increasing scrutiny for its eye-popping investments and corporate governance practices. Investing almost a billion into a company embroiled in a massive accounting fraud scandal (Wirecard) is not what I would characterize as best use of shareholders' capital.
Starting from the 2009 trough, the stock has completed 5-waves up with the price action over the last 5 years culminating in a bearish megaphone pattern.

DOW JONES 1960's - comparisonLooking at broadening formations: similar pattern 1960's-80's. Larger span of time then.. just interesting to me


$BA Weekly Megaphone pattern -- Bearish Reversal.This looks like a textbook Megaphone reversal pattern -- Shorting here at $407. :)

CO2 GRO Technical Analysis: 100% return over next 1-2 months Short term we are due for at least a small bounce since we finally have some signs of buying volume increasing. Note the bull volume spikes end of this week as well as back in June before the last uptrend started.
Daily MACD is just about to cross which when combined with stochastics rising out of oversoold indicate a likely uptrend beginning.
$0.15 was a major support and now is acting as significant resistance, a break above this level would 100% confirm the continuation of the megaphone chart pattern up to at least $0.30.
Easy 100% return over next 1-2 months even without any major catalysts, but this company has first revenue coming any week now as well as new research/trials being completed monthly. 8 Million market cap and projected revenue stream for 2019 is $10 million.

Compañía Cervecerías Unidas. S.A.Chilean Stocks.
Pure Technical Projection.
Bearish Gartley + iH&S could give the last correction before break the bullish megaphone and keep rising.
Divergence both MACD and RSI.
Ichimoku will lead us.

Gold megaphone H4Hi pros!
Waiting for a break of the megaphone to look for positionning
target if long :1250 because it's a trendline
target if short : 1160 because it's the lower low
on both target we will take half or all and see what happen to see for an other positioning (long or short)
Have a nice week!
Cheers

BTCUSD Broadening BottomThought I'd finally share my thoughts on Bitcoin. It looks like a megaphone pattern is forming, specifically a broadening bottom.
These patterns are explained in detail by Bulkowski for those that are interested: thepatternsite.com
Suffices to say they are not reliable bottoms at all. They can break up, but they also demonstrate a high failure rate.
A good indication of a break above resistance is the partial decline, where the price retests resistance without going first to support.
Likewise a good indication of break below support is the partial rise, which should be self-explanatory.
As Bulkowski says, these are risky zones to enter. They are characterised by increasing volatility, which make them optimal for scalping and short swing trades, but for investors their outcome is not easy to predict.

CL breakdown continues powerfully, big Daily levels in sight nowUpdate to a previous post I made about the CL level breakdown.
Bias remains short until proven otherwise. Flat, no clear entries for me until tomorrow morning when we look at premarket price action and range.
Yesterday's trade posted to twitter. 11.25R despite mismanaging the hell out of it.
It's imperative you learn to take wholesale entries, understand context, and know when to pull the trigger and when to HAPPILY stand aside.

Megaphone pattern developing on EURNZDOANDA:EURNZD is developing a really nice megaphone pattern. We will trade the swings in order to be in early when it breaks out. Trading it to the upside we can use the inside day on the D1 or a H4 entry to go long.

Patience is The KEY! But BITCOIN is Facing The WALL of Decision!Dear Friends :)
No speech. No intros, no long stories, let's just jump in...
Once again we are taking a look at our favorite coin. And once again we will take a look at the 4h BTC/USD Chart. We will never be tired of Bitcoin. And after a long day of sideways movement, Bitcoin has to make a decision very soon - and we are in for a treat! We will soon see firework...
As you can see we are in a descending broadening wedge (you might also argue that we are in a normal descending wedge in small dotted lines). Please pay attention to my red circles, and notice how we after some up-sideways movements has bumped into the wedge wall, and how we hereafter fell in a steep down trend. So the question is, will it happen again?
We have a lot of bullish signs in fact. We are in an ascending triangle in purple. We have had Regular Bullish Divergence on MACD and on RSI, also a bullish MACD-cross. All that in isolation is telling us, that this downtrend could be over, and we will go into an uptrend now.
But, but.. We are squeezed into an ugly zone of confluence support and resistance everywhere! This is not a place to be in if you suffer from claustrophobia. We have all the EMAs from 20 to 200 just above our head. We have 8,2k support under us. We have 8,000 USD which also acts as huge support due to it is a even number and also is P.O.C. (Point of control - most trades are generated at this price point ever).
So here is D4rkEnergY's advice for you. Believe it or not - I care about you. So this is still a no trading zone so far. Let other people gamble with their money! Go to a casino play some Roulette instead. We are aware of the market conditions, and when there are no reason to take unnecessary risks! THAT is how we become a better trader.
When that is said: I believe we will very soon - when we get closer to The Wall of Decision - that we will see a SPIKE in one of the directions. I also believe it is most likely, that we will go in an uptrend at around 7,800 USD or maybe have we already bottomed now!
I promise to keep you updated!! While I'm writing this, I can see the bears are trying to escape the triangle cage......
D4 Loves You <3
Aaand as always. I would appreciate a big LIKE if you enjoyed my analysis. Thanks in advance, my friends :)

EURJPY / H1 / MEGAPHONE PATTERNIf you think this analysis can be useful, leave a your comment or your LIKE!
Thank you for support and trade with care!

DXY bullish possibility on megaphone pattern supportTaking a looking at DXY, have price coming down to support.
Bearish case is that the most recent move up has sputtered out and had less momentum. The downside potential here is very big if price breaks down from the megaphone pattern.
However, looking on a daily, price is well outside lower Bollinger band at the same time that price will arrive on support of megaphone pattern. For my trading strategy, I like to see as many good cases occur simultaneously. In this case we have three.
price is converging to support of megaphone pattern
price is converging to support of daily channel
price is already below lower bollinger band and will continue even further out
Those three bullish cases together spell for me that a major rip up will occur before any real down move takes place on the DXY. See this chart for a close up view.
