Safran SA (SAF.pa) bearish scenario:The technical figure Pennant can be found in French company Safran SA (SAF.pa) at daily chart. Safran S.A. is a French multinational aircraft engine, rocket engine, aerospace-component and defense corporation. Employing over 95,000 people and generating 24.64 billion euros in sales in 2019, Safran operates in the aircraft propulsion and equipment, space and defense markets. The Pennant has broken through the support line on 20/10/2021, if the price holds below this level you can have a possible bearish price movement with a forecast for the next 7 days towards 105.90 EUR. Your stop loss order according to experts should be placed at 117.22 EUR if you decide to enter this position.
Risk Disclosure: Trading Foreign Exchange (Forex) and Contracts of Difference (CFD's) carries a high level of risk. By registering and signing up, any client affirms their understanding of their own personal accountability for all transactions performed within their account and recognizes the risks associated with trading on such markets and on such sites. Furthermore, one understands that the company carries zero influence over transactions, markets, and trading signals, therefore, cannot be held liable nor guarantee any profits or losses.
Memestocks

GameStonk! Potential breakout imminentAscending triangle at the edge of the rectangle. rectangles are same slope as previous setup so could see a nice pop and back test 230 on breakout
Looks like we are entering a meme stonk rally

KUMA ready for new HighsIf we look at the reverse Fib, can see a clear bounce of the 0,786 level.
Also we can see a breakout of falling wedge.. For me it looks very bullish.
Should come quick to new ATH. Have fun.

Visa Inc. (V) bullish scenario:The technical figure Triangle can be found in US company Visa Inc. (V) at daily chart. Visa Inc. is an American multinational financial services corporation. It facilitates electronic funds transfers throughout the world, most commonly through Visa-branded credit cards, debit cards, and prepaid cards. Visa is one of the world's most valuable companies. The Triangle has broken through the resistance line on 16/10/2021, if the price holds above this level you can have a possible bullish price movement with a forecast for the next 19 days towards 240.18 USD. Your stop loss order according to experts should be placed at 218.63 USD if you decide to enter this position.
Risk Disclosure: Trading Foreign Exchange (Forex) and Contracts of Difference (CFD's) carries a high level of risk. By registering and signing up, any client affirms their understanding of their own personal accountability for all transactions performed within their account and recognizes the risks associated with trading on such markets and on such sites. Furthermore, one understands that the company carries zero influence over transactions, markets, and trading signals, therefore, cannot be held liable nor guarantee any profits or losses.

Wells Fargo (WFC) bullish scenario:The technical figure Triangle can be found in US company Wells Fargo (WFC) at daily chart. Wells Fargo & Company is an American multinational financial services company. The company has operations in 35 countries with over 70 million customers globally. It is considered a systemically important financial institution by the Financial Stability Board. The Triangle has broken through the resistance line on 16/10/2021, if the price holds above this level you can have a possible bullish price movement with a forecast for the next 15 days towards 49.96 USD. Your stop loss order according to experts should be placed at 44.83 USD if you decide to enter this position.
Risk Disclosure: Trading Foreign Exchange (Forex) and Contracts of Difference (CFD's) carries a high level of risk. By registering and signing up, any client affirms their understanding of their own personal accountability for all transactions performed within their account and recognizes the risks associated with trading on such markets and on such sites. Furthermore, one understands that the company carries zero influence over transactions, markets, and trading signals, therefore, cannot be held liable nor guarantee any profits or losses.

AMC breakout has begun. Time to apewould wait for the friday daily candle to close. would like to see a close above 41.13 for bulish momentum to start

AMC Consolidation - Meme Stonk Rally Part Deux??AMC bull flagging, 4 hr breakdown candle at 38.85, close above opens the door to higher prices. Looking for 48 on a breakout to the upside

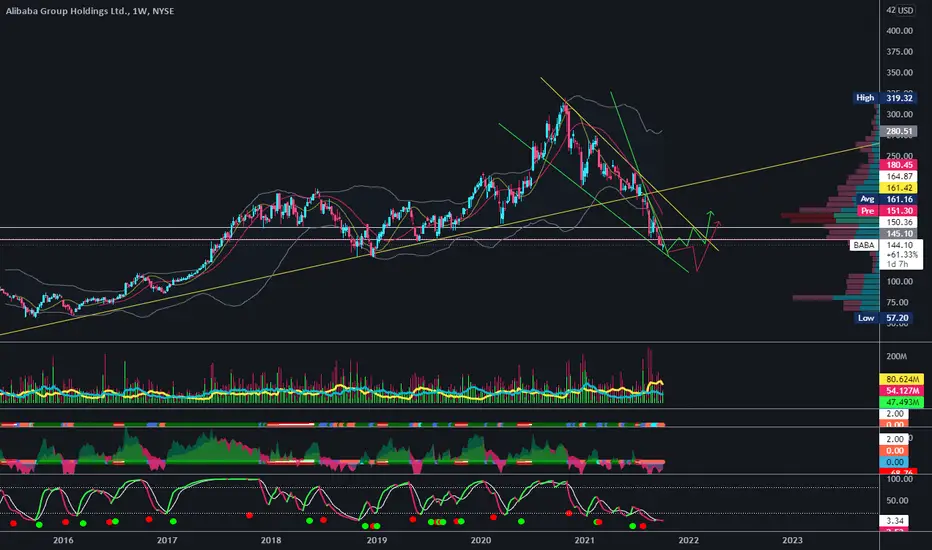
BABA - HUGE OPTIONS PLAY - FALLING WEDGE + CHANNELAll,
BABA is PRIMED here. Just a question of has it hit bottom. I would wait for break or daily candles conformation personally, but then i'd be all in here. This should break the falling wedge and hit the top of the downtrend channel. Huge plays here. This should take more of your attention than any small cap etc stocks. Make sure to set many alerts on this. Telling you this is worth big returns could see 180-200 by end of 2021. Especially holidays nearing etc.


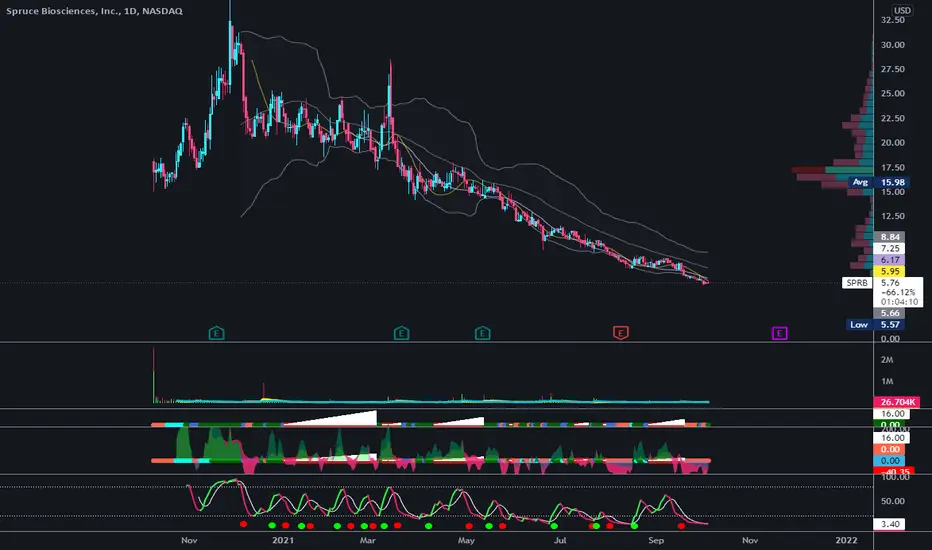
SPRB - 8M FLOAT - WORTH X2-X3 CURRENT PRICEAll,
I am already scaled in big here. I am without a doubt this stock will at least double.
***KEEP IN MIND THIS IS AN 8M FLOAT COMPANY
1. Do your own DD you will notice all that has really happened is low float short sellers have just railed the price down
2. This companies price targets are insane not to mention 8M float will make this EXPLODE on any good news. The company is already undervalued + postiive news of any kind just blows this baby to the moon. Except here the moon is probably where it SHOULD be.
3. Financially speaking easily in great position no chance of offerings
4. Promising company overall
5. This downtrend looks awful, but is purely short sellers and look at the length of the time on market.
This looks like it may happen soon, but either way I will happily add large position scales into this stock and simply wait. I really think at some point even a year from now we see 20+. The question is do you want to chase stocks daily, weekly or scale in. Either way set alers and volume alerts.
Why So Serious Kenny?I have, myself, full confidence that if all do their duty, if nothing is neglected, and if the best arrangements are made, as they are being made, we shall prove ourselves once again able to defend our home Banana Planet, to ride out the storm of war, and to outlive the menace of tyranny Occupying Tendie Town.
We are going to to Banana Planet based off of my unbiased opinion and technical analysis.
Why? You may ask... Because I'm A Legend And I Like The Stock Thats Why.
(This is not financial Advise)

AMC to the moon?Same set up on a weekly. All time low to all time high 50% retracement retest. stops below the 61.8. Profit target at 88.

MMAT - EMA , MA Convergence1 Hour Chart - MetaMaterials in a consolidation phase, which could be leading the next leg up.
50 MA
EMA 100
Convergence.
Ready to Rip


Weekly Bearish Harami at PCZ of Bearish 5-0 on PalantirWe are at the PCZ of a bearish 5-0 and the weekly candle which is currently opened is as of right now a Bearish Harami but it hasn't closed yet but since i like to speculate and get the best price i will be entering a bearish position tomorrow in anticipation of the weekly closing bearishly and i suspect that it will make a lower low down to the 0.886 retracement.

$HOOD cheap upside playCould the broker of the apes get some more action again soon.. hard to see this one settling down forever.. with 30 day HV at 141% and OCT vols at low 60s seems reasonable to buy premium if you believe a bounce is coming.. right sided skew also provides opportunities for call spreads too..

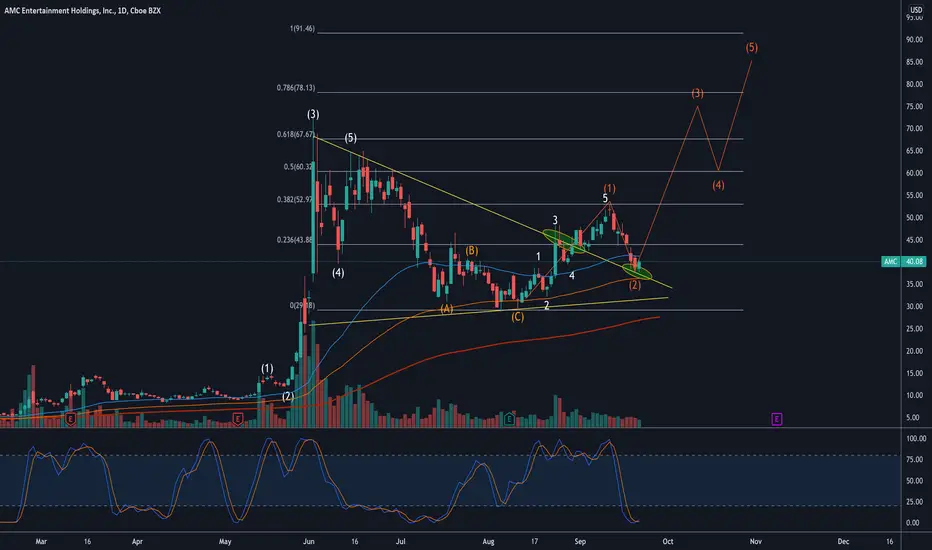
$AMC Momentum and Fibonacci ModelBased on Fibonacci retracements of past moves if have found a range where the daily green candle closes on a major momentum move with volume. Giving NYSE:AMC ’s ability to surpise even the most certain of short sellers I wanted to share this for anyone interested in a great opportunity given the dip today.

UBS Group AG (UBSG.vx)We can found a technical figure Triangle in the Swiss company UBS Group AG (UBSG.vx) on a daily chart. UBS Group AG is a Swiss multinational investment bank and financial services company founded and based in Switzerland. UBS client services are known for their strict bank–client confidentiality and culture of banking secrecy. The Triangle has broken through the support line on 09/09/2021. If the price holds below this level, you can have a possible bearish price movement with a forecast for the next 12 days towards 14.595 CHF. According to the experts, your stop loss should be around 15.485 CHF if you enter this position.
Risk Disclosure: Trading Foreign Exchange (Forex) and Contracts of Difference (CFD's) carries a high level of risk. By registering and signing up, any client affirms their understanding of their own personal accountability for all transactions performed within their account and recognizes the risks associated with trading on such markets and on such sites. Furthermore, one understands that the company carries zero influence over transactions, markets, and trading signals, therefore, cannot be held liable nor guarantee any profits or losses.

Repsol S.A. (REP.mc) bearish scenario: We can found a technical figure Rising Wedge in Spanish company Repsol S.A. (REP.mc) on a daily chart. Repsol S.A.s a Spanish energy and petrochemical company based in Madrid. It is engaged in worldwide upstream and downstream activities. In the 2020 Forbes Global 2000, Repsol was ranked as the 645th-largest public company in the world. It has more than 24,000 employees worldwide. It is vertically integrated and operates in all areas of the oil and gas industry, including exploration and production, refining, distribution and marketing, petrochemicals, power generation, and trading. The Rising Wedge has broken through the support line on 09/09/2021. If the price holds below this level, you can have a possible bearish price movement with a forecast for the next 12 days towards 9.128 EUR. According to the experts, your stop loss should be around 9.976 EUR if you enter this position.
Risk Disclosure: Trading Foreign Exchange (Forex) and Contracts of Difference (CFD's) carries a high level of risk. By registering and signing up, any client affirms their understanding of their own personal accountability for all transactions performed within their account and recognizes the risks associated with trading on such markets and on such sites. Furthermore, one understands that the company carries zero influence over transactions, markets, and trading signals, therefore, cannot be held liable nor guarantee any profits or losses.

Analyzing GameStop GME Stock ChartFor those of you trading the meme stocks.... this one for you.
I took at look at Gamestop (GME)
Here's my analysis...
Watching in the 1 Hour chart.
Positives:
Price is bouncing off lower trend line.
Currently price is hitting previous support.
RSI and MACD reading oversold.
Negatives:
Price met a lot of resistance above $200
Current trend is down
Fundamentals are weak
Price prior to the Reddit move was well below current levels.
P/E is astronomically high at 10,140!!
In comparison, AMZN is around 80... and even that's high.
Opinion:
This is a highly risky trade.
Based on technicals, there is potential for a run-up again to $300-400 range. But this is a huge maybe considering it's majority depends on retail and not institutional money.
If it does run, it will end very quickly like previous runs.
In my experience, market makers like to project possible run up influencing the technicals that retail traders are using, convincing traders of a run before they pull the rug from under you.
If you do decide to enter, I'd look for a current dip to previous lows before entry and have tight stop losses in place. As always, don't use money your not prepared to lose. set your take profit within reason of the upper support and... don't be greedy.
As usual.. this is not investment advice. DO YOUR DUE DILIGENCE!
Best of luck trader!

Berkshire Hathaway (BRKB) breakout the Triangle:The technical figure Triangle can be found in US company Berkshire Hathaway (BRKB) at daily chart . Berkshire Hathaway Inc. is an American multinational conglomerate holding company headquartered in Omaha, Nebraska, United States. The Triangle has broken through the support line on 04/09/2021. If the price holds below this level, you can have a possible bearish price movement with a forecast for the next 50 days towards 260.16 USD. According to the experts, your stop-loss order should be at 291.81 USD if you decide to enter this position.
Risk Disclosure: Trading Foreign Exchange (Forex) and Contracts of Difference (CFD's) carries a high level of risk. By registering and signing up, any client affirms their understanding of their own personal accountability for all transactions performed within their account and recognizes the risks associated with trading on such markets and on such sites. Furthermore, one understands that the company carries zero influence over transactions, markets, and trading signals, therefore, cannot be held liable nor guarantee any profits or losses.
