EURUSD – H1 | Premium Retracement Reaction & Potential ContinuatPrice has completed a premium retracement into higher-timeframe supply and is now showing signs of exhaustion. After sweeping the previous high, the market printed a BOS to the downside, followed by a CHoCH inside the intraday range, suggesting a potential shift back toward discounted pricing.
I'm watching how price reacts around the mitigation zone / demand block highlighted below. Failure to reclaim the internal structure highs may confirm continuation lower toward the 1.15800–1.15600 liquidity pocket.
Points of interest:
✔️ Clear liquidity grab above the swing high
✔️ BOS confirming bearish intent
✔️ Price retesting lower-timeframe supply
✔️ Potential continuation toward unmitigated demand zones
⚠️ Reclaiming 1.16400 would invalidate the bearish outlook
This setup remains valid as long as price holds below the retracement premium zone.
Not financial advice — just sharing my perspective for educational purposes.
Metals

XAUUSD: Market Analysis and Strategy for December 2ndGold Technical Analysis:
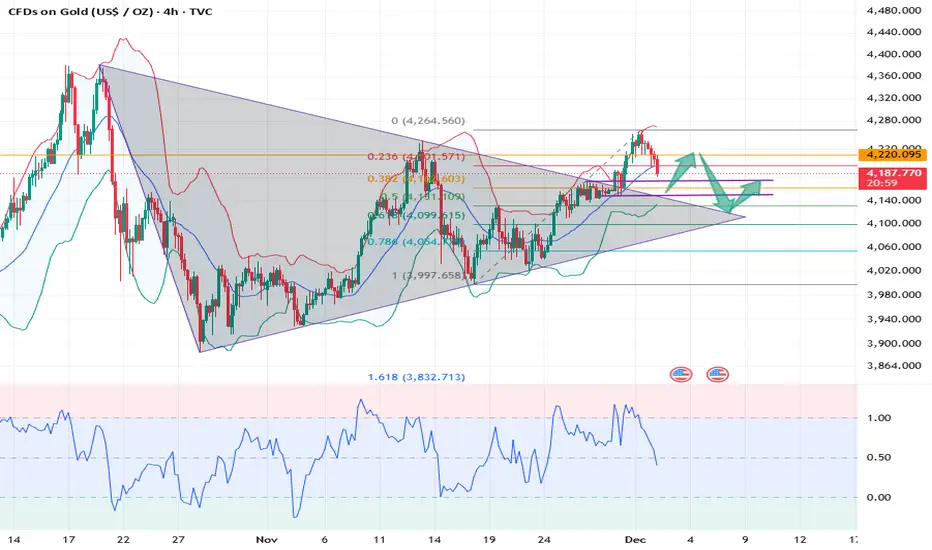
Daily Resistance: 4330, Support: 4131
4-Hour Resistance: 4220, Support: 4150
1-Hour Resistance: 4210, Support: 4175
Yesterday, the gold market exhibited significant volatility. Gold prices surged, reaching a high of around 4264, demonstrating strong upward momentum. However, upon entering the New York session, the market sentiment shifted dramatically, and gold prices began to fluctuate and decline. The 4-hour chart shows that gold has successfully broken out of a clear symmetrical triangle pattern, a breakout signal indicating a continuation of the bullish trend. Although momentum has improved after the breakout, the RSI indicator remains in overbought territory around 65, making chasing the price higher risky in the short term. The short-term battleground between bulls and bears is around 4200.
Trading Strategy:
SELL: 4200near
SELL: 4210near
SELL: 4225near
More Analysis →
EURUSD: descending channel🛠 Technical Analysis: On the 4-hour timeframe, EURUSD is clearly moving within a descending channel, with price currently testing a major confluence of resistance. This resistance cluster is formed by the channel's upper trendline, the 100 and 200 SMAs, and a horizontal static zone around 1.1607. The "Global bearish signal" (Death Cross) identified earlier remains valid, reinforcing the downtrend. The projected trade anticipates a rejection from this heavy resistance, pushing the price back down toward the lower support zones, with an ultimate target near the channel's bottom at 1.1380.
🌍 Fundamental Analysis: Market liquidity is thin today in the wake of the US Thanksgiving holiday, which can lead to unpredictable or muted price action. Focus is shifting to next week's high-impact data, including Eurozone 'Flash' Inflation (Dec 2) and the crucial US Non-Farm Payrolls report (Dec 7). These releases will be vital in shaping the market's expectations for future ECB and Federal Reserve interest rate decisions, directly impacting the EURUSD exchange rate.
❗️ Trade Parameters (SELL) ❗️
➡️ Entry Point: Sell on rejection from the resistance zone (approx. 1.1600 – 1.1630)
🎯 Take Profit: 1.1468, medium-term target at 1.1380
🔴 Stop Loss: Above the resistance structure (approx. 1.1671)
⚠️ Disclaimer: This is a potential trade idea based on current analysis; market conditions and price direction are subject to change based on news factors and volatility.

GBPUSD: short-term buy🛠 Technical Analysis: On the 4-hour timeframe, GBPUSD has successfully broken out of its long-term descending channel and reclaimed the critical 200 SMA, signaling a potential trend reversal. Currently, the pair is forming a bullish triangle pattern just above the 1.3200 support zone, consolidating recent gains. The projected setup anticipates a continuation of this momentum, with a breakout above the triangle targeting the next major resistance level at 1.3356.
🌍 Fundamental Analysis: The Pound is gaining traction as the market prepares for a heavy week of US economic data, specifically the ISM Manufacturing PMI and the upcoming Non-Farm Payrolls (NFP). If US labor data shows signs of cooling, it could further weigh on the US Dollar, providing fuel for the British Pound to extend its rally. Additionally, month-end flows and positioning ahead of December central bank decisions are keeping volatility elevated.
❗️ Trade Parameters (BUY) ❗️
➡️ Entry Point: Buy on the confirmed breakout of the triangle pattern (approx. 1.3245 – 1.3260)
🎯 Take Profit: 1.3356
🔴 Stop Loss: Below the local consolidation structure (approx. 1.3170)
⚠️ Disclaimer: This is a potential trade idea based on current analysis; market conditions and price direction are subject to change based on news factors and volatility.

XAUUSD - The Golden Retest Zone!📈Gold remains overall bullish , respecting its rising structure and printing higher lows along the way. Each corrective dip has been met with strong buying pressure, keeping the broader trend intact.
📉As price pulls back, it is now approaching a key blue structure zone that aligns perfectly with the lower blue trendline. This intersection forms a high-confluence area where we will be looking for trend-following longs.
⚔️As long as Gold holds this zone, the bullish scenario remains dominant, with the next potential push targeting the previous ATH highlighted on the chart.
🏹A clean reaction here could be the catalyst for the next leg of the uptrend.
Will the bulls defend the golden zone again? 🤔
⚠️ Disclaimer: This is not financial advice. Always do your own research and manage risk properly.
📚 Stick to your trading plan regarding entries, risk, and management.
Good luck! 🍀
All Strategies Are Good; If Managed Properly!
~Richard Nasr

GOLD Trading Opportunity! BUY!
My dear friends,
My technical analysis for GOLD is below:
The market is trading on 4192.2 pivot level.
Bias - Bullish
Technical Indicators: Both Super Trend & Pivot HL indicate a highly probable Bullish continuation.
Target - 4210.4
Recommended Stop Loss - 4182.6
About Used Indicators:
A pivot point is a technical analysis indicator, or calculations, used to determine the overall trend of the market over different time frames.
Disclosure: I am part of Trade Nation's Influencer program and receive a monthly fee for using their TradingView charts in my analysis.
———————————
WISH YOU ALL LUCK

GOLD 4H, LONDON SESSION IDEA FOR 2 DEC, 2025Gold is overall bullish, but with sessional Bias for an overall down trend, which is a reversal or retracement, the safe haven asset is pushing hard upwards and is expected to push harder upwards!
Hold on tight and speculate!

Gold 30-Min — Volume Buy & Sell Reversal Triggered⚡Base : Hanzo Trading Alpha Algorithm
The algorithm calculates volatility displacement vs liquidity recovery, identifying where probability meets imbalance.
It trades only where precision, volume, and manipulation intersect —only logic.
✈️ Technical Reasons
/ Direction — LONG / Reversal 4218 Area
☄️Bullish momentum confirmed through strong candle body.
☄️Structure shifted with higher-low near key demand base.
☄️Volume expanding confirms order-flow alignment upward.
☄️Buyers reclaimed imbalance with sustained clean break.
☄️Algorithm detects rising momentum under low liquidity.
✈️ Technical Reasons
/ Direction — SHORT / Reversal 4325 Area
☄️Bearish rejection confirmed through sharp candle body.
☄️Lower-high forming beneath resistance supply region.
☄️Volume decreasing confirms exhaustion in price rally.
☄️Sellers regained imbalance with heavy top rejection.
☄️Algorithm detects fading demand and shift to control.
⚙️ Hanzo Alpha Trading Protocol
The Alpha Candle defines the day’s real control zone — the first battle of momentum.
From this origin, the Volume Window reveals where the next precision strike begins.
⚙️ Hanzo Volume Window / Map
Window tracked from 10:30 — mapping true market behavior.
POC alignment exposes institutional bias and breakout potential zones.
⚙️ Hanzo Delta Window / Pulse
Delta window monitors real buying vs. selling power behind each move.
Tracks volume aggression to expose who controls the candle — buyers or sellers.
When Delta aligns with Volume Map, momentum becomes undeniable.

Risk/Reward 2.24 on XAUUSD-GOLD – Is Opportunity Coming?Good Morning Guys
I’ve put together a 4-hour timeframe analysis on XAUUSD – GOLD.
Once the harmonic pattern completes, I’m expectin’ a correction right around the 4215.0 level.
That’s where the pattern should wrap up, and from there price is likely to pull back.
✅ Entry Level: 4215.0
🛑 Stop: 4270.0
🎯 TP1: 4189.0
🎯 TP2: 4149.0
🎯 TP3: 4097.0
⚖️ Risk/Reward Ratio: 2.24
Also, the Supply-Demand zone sits between 4045.0 – 4000.0.
If price drops into that area, I’ll be lookin’ to buy.
Once we hit that zone, I’ll drop another signal for y’all.
Every single like from you guys keeps me motivated to share these analyses.
Big thanks to all my friends who support me with their likes – y’all are the reason I keep postin’.

DeGRAM | GOLD will break the $4250 level📊 Technical Analysis
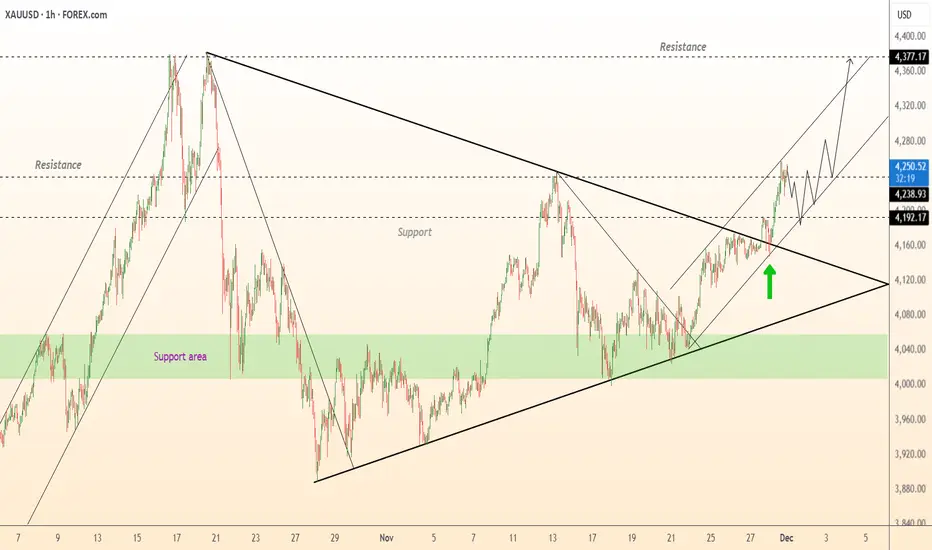
● XAU/USD broke out of a long-term triangle and retested the confluence of trendline support and the 4,190 zone, confirming bullish continuation.
● Price is now moving inside an ascending channel, targeting the 4,300–4,380 resistance region as momentum strengthens after the breakout.
💡 Fundamental Analysis
● Falling U.S. yields and renewed safe-haven demand support further upside in gold as markets price in a softer Fed stance.
✨ Summary
● Bullish bias above 4,190. Targets: 4,300 → 4,377. Key support: 4,190.
-------------------
Share your opinion in the comments and support the idea with a like. Thanks for your support!
Gold Is Entering a Danger Zone—A Sharp Drop May Hit Before....📌 SETUP SIGNAL (GOLD – 4H)
Strategy: Sell the Downward Channel – Follow the Correction
1️⃣ Sell Setup
Entry: 4188–4175 (after a confirmed 4H close below 4188)
Stop-Loss: 4240
Take Profit:
TP1: 4120
TP2: 4050
Main Target: 4000–3990
Reason:
- Price is moving cleanly inside a descending correction channel.
- Repeated sell-offs + weak bullish reactions show sellers are still in control.
- Breaking 4188 confirms continuation toward the lower liquidity zone.
2️⃣ Alternative Scenario (Low Probability)
Bullish invalidation: Only if price breaks above 4280 (4H close).
→ Then the market may shift upward toward 4365–4370 liquidity.
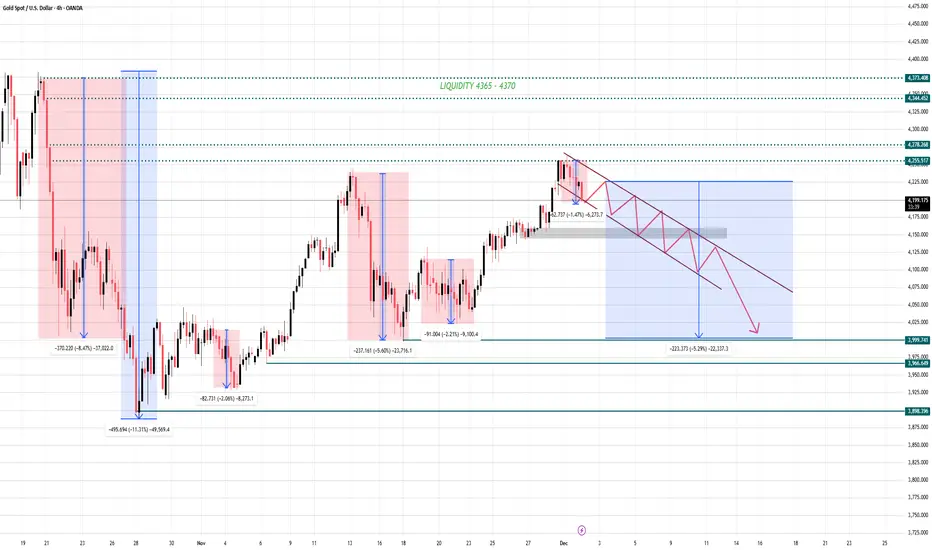
📉 QUICK MARKET OUTLOOK – GOLD 4H (Rejection + Bearish Channel Forming)
Based on the current 4H structure, Gold is showing a clear pattern of repeating deep corrections every time it reaches major resistance/liquidity zones.
The latest price action continues to repeat this same behavior:
Key Observations
- Price has once again rejected strongly from the 4270–4280 zone (same rejection region as previous drops).
- A descending bearish channel is forming → indicating controlled distribution.
- The recent downward legs are consistent with past moves:
-8.47%, -11.31%, -5.60%, -2.21% → the market has a clear history of sharp sell-offs.
- Current structure suggests a continuing corrective wave until deeper support.
📌 Bearish Scenario (High Probability)
Price continues moving inside the descending channel and breaks the short-term support.
Targets → 4120 → 4050 → 4000
Major liquidity & demand zone sits at 3990 – 3980
→ where large buyers historically step in.
If panic selling accelerates, price may extend toward: → 3888 – 3900
📌 Bullish Scenario (Low Probability)
Only activated if Gold breaks OUTSIDE the descending channel and reclaims: → 4280
This invalidates the bearish outlook and reopens the path to 4365 – 4370 liquidity.
🎯 FINAL CONCLUSION
Gold is currently in a corrective downtrend, moving exactly within a well-defined bearish channel.
Unless buyers break the structure, the market is likely heading for deeper retracement toward the 4000 zone before any meaningful bullish continuation.
"Stay patient. Stay disciplined. Let the market come to your levels."
EURUSD outcome!EURUSD moving clean in the channel. Waiting for confirmation of either continuing the momentum of climbing or BreakOut from the channel and a reverse back DOWN.

Gold Slows at Channel Top — Market Targets 4,150 Before Move UpHello traders! Here’s my technical outlook on XAU/USD based on the current market structure. After breaking out of the broader consolidation phase, gold continued to move within a rising channel, forming consistent higher highs and higher lows along the Support Line. Buyers maintained strong momentum as the price pushed toward the Resistance Line, which aligns with the major Resistance Level near 4,240. However, after reaching this upper boundary, the market showed clear signs of exhaustion, indicating that buyers are struggling to push further into the resistance zone. This reaction suggests that the price may soon initiate a corrective move. At the moment, XAU/USD is trading inside a narrowing rising structure, with the Support and Resistance Lines converging, creating compression. As long as the price holds above the local Support Level around 4,150, the bullish structure remains intact. A pullback from the Resistance Line toward this area is the most likely short-term scenario before buyers attempt another push. This zone aligns with the first target TP1, which also acts as a key reaction zone from previous price behavior. A successful rebound from support could allow bulls to regain strength and attempt another test of the 4,240 resistance. If a breakout occurs, it would open the door for further bullish continuation. However, if the price fails to hold the Support Line or breaks back below the 4,150 zone, the structure may shift to a deeper correction, exposing gold to lower support areas. Please share this idea with your friends and click Boost 🚀

GBP/USD 1H chart:GBP/USD 1H chart:
---
📉 Analysis – Bearish Setup
My chart shows:
Trendline break ✔
Price retesting the broken trendline + cloud resistance
Clear supply zone above: 1.3260 – 1.3280
Bearish continuation arrow marked on my chart
This setup is valid bearish as long as price stays below 1.3280.
---
🎯 Targets (1H)
Entry Zone
🔻 1.3220 – 1.3240
---
🎯 TARGET 1
➡️ 1.3160 – 1.3140
(First demand zone – shown on your chart)
---
🎯 TARGET 2
➡️ 1.3080 – 1.3060
(This is my second target in the screenshot)
---
🎯 TARGET 3 (Extended)
➡️ 1.3020
(If strong selling continues – optional swing target)
---
❌ Invalidation Level
If GBP/USD closes above 1.3285 (1H candle)
👉 Trend turns bullish and targets are invalid.
---
📌 Summary (Quick)
Sell below: 1.3280
TP1: 1.3160
TP2: 1.3060
SL: 1.3290/1.3300

BTC/USD 1H chart..BTC/USD 1H chart:
📉 Current Market Structure (Bearish)
Price has broken the uptrend line clearly.
Strong impulse sell candle from 91,000 → 86,000.
Price retested the supply zone (87,300 – 87,900) and got rejected.
Ichimoku cloud also showing strong bearish pressure.
🎯 Targets (Downside)
As per My chart, price is likely forming a continuation move.
Entry Zone:
🔻 86,400 – 86,900 (current retest area)
Targets:
1️⃣ TP1 → 85,200 (nearest demand zone)
2️⃣ TP2 → 83,800 (liquidity zone under last swing)
3️⃣ TP3 → 81,000 – 81,300 (My chart’s marked target zone)
📌 Notes
Main target highlighted in My analysis chart = 81,000
This target is valid as long as BTC stays below 87,900 supply.
⚠️ Invalidation
❌ If BTC closes above 88,000 on 1H, bearish setup invalid.

Technical corrections do not mean reversal of the bullish trend#XAUUSD OANDA:XAUUSD TVC:GOLD
📊 From the current structure, gold rebounded to a high of around 4264 yesterday before fluctuating downwards.
💠 However, the price of gold has not yet effectively broken below the daily MA5 and MA10, and there is still some support below.
📈 The brief pullback is a build-up for a better rise later.
🌈 As I said yesterday, the technical indicators showed a bearish divergence, indicating a need for technical correction. Therefore, it is not surprising that gold prices will fall in the short term.
💡 The key focus for today is the daily MA5 and MA10. The first support level is at 4205-4195. If the price retraces to this level, you can consider a small long position in gold, with appropriate SL orders.
💡 If the price falls below the 4205-4195 support zone, it is advisable to remain on the sidelines and not rush into further trading. Because the downside potential may open up, the price may fall back to the 4160-4140 Fibonacci retracement zone in the short term. This area will determine whether the upward trend can continue. Pay close attention to any stabilization signals in this area during the day.

Xauusd.Chart Pattern...✅ TARGET Visible on my XAUUSD Chart
I have one main target marked with a blue upward arrow:
📍 Target Point: ~ 4,240 – 4,245 USD
This is the horizontal zone I highlighted above the current price, likely projected from the previous range height.
📈 What the Chart Structure Suggests (Based on What my Drew)
Price is riding an ascending trendline.
It’s above the Ichimoku cloud, which I'm using as bullish confirmation.
Breakout from a consolidation box appears to be measured and projected upward → giving the ~4,240 target.

Silver prices surge due to the supply tightnessSilver briefly hit another record high at 78, then stabilized at above 57 due to the concern over the lack of supply in LME and SHFE. Meanwhile, demand from not only Solar PV but also EV and data center continues to surge, putting more pressure on the storage.
Meanwhile, China’s silver exports hit a record 660 tons in Oct, underscoring strong demand amid tightening global supply.
However, the gold/silver ratio fell to 74, near the average 25-year of 69, which could limit the rally.
XAGUSD rebounded from EMA21 and formed higher swings within the ascending channel. Diverging bullish EMAs reinforce its uptrend.
A break above the channel’s upper bound near 60.00 could prompt a rally toward the potential resistance at 63.00.
By Van Ha Trinh - Financial Market Strategis at Exness

Gold Maintains Bullish Structure, Targeting 4,250–4,285Hello everyone,
On the XAUUSD 4H chart, gold has finally broken free from its consolidation phase, surging toward 4,238 USD after spending several sessions compressing around the 4,200 zone. The bullish structure remains intact and well-defined, with higher highs, higher lows, and a steady sequence of FVGs forming beneath price—acting as stepping stones that continue to support buyers.
Just below the current level, the 4,205–4,215 imbalance serves as a reasonable area for a shallow pullback. If sellers gain more traction, gold may retrace toward 4,174–4,150, where older imbalances converge with dense liquidity—likely strong enough to maintain the broader uptrend.
On the upside, buyers are now eyeing the 4,250 region, followed by the November high near 4,285.6 USD. A breakout above 4,286 could unlock a stronger rally toward 4,320–4,350 as momentum builds.
From a news perspective, this week is sensitive as markets digest key US data: PMI, ADP, jobless claims, and especially core PCE—the inflation gauge the Fed monitors most closely. According to Kitco, sentiment is leaning toward the possibility of earlier rate cuts, which continues to support gold’s upward bias. Analysts such as Colin Cieszynski and Jim Wyckoff also note that buyers are regaining confidence, adding further strength to the bullish narrative.

Gold is still showing us it's bearish intent on the macroEasy peasy reading on the week so far. Let me know if I missed anything. I'm here for the sharing of info 💎

Gold Update 02DEC2025: Multiple Options Are PossibleThe price has been stuck in the range as expected for wave 4
Let’s navigate this chaos and build viable paths on the chart
Option 1: Ending Diagonal wave 5 — pink marks
This option is based on the idea that wave 4 looks disproportionately large compared to wave 2
It could already be over after the first large move down to the $3,900 area
The current ascending zigzag may be shaping an Ending Diagonal in wave 5 to retest the former top around $4,400
Option 2: Triangle — orange marks
I left this path on the chart last time for visualization and it still could play out
Waves A and B could be completed with waves C, D, E ahead
Option 3: Large sideways consolidation (range, box) — white marks
This scenario implies a flat correction within the established $4,400–$3,900 range
Which path do you think the price will take?
Share your thoughts in the comments below

Stop!Loss|Market View: EURUSD🙌 Stop!Loss team welcomes you❗️
In this post, we're going to talk about the near-term outlook for the EURUSD currency pair☝️
Potential trade setup:
🔔Entry level: 1.16650
💰TP: 1.17291
⛔️SL: 1.16306
"Market View" - a brief analysis of trading instruments, covering the most important aspects of the FOREX market.
👇 In the comments 👇 you can type the trading instrument you'd like to analyze, and we'll talk about it in our next posts.
💬 Description: The mid-term outlook remains on the sellers' side, so given current prices, selling is appropriate, targeting at least 1.14000. In the short term, a further upward move is highly likely, aimed at breaking the resistance at 1.16600. In this case, a short-term buy could be looked for, but with targets no higher than 1.17500, as the mid-term move is likely to be downward.
Thanks for your support 🚀
Profits for all ✅

GOLD ANALYSIS 12/01/20251. Fundamental Analysis:
a) Economy:
• USD:
The USD continues to weaken as the market prices in Fed rate cuts in 2026. The downward pressure on the dollar provides strong support for gold.
• U.S. Stocks:
U.S. equities edged higher on rate-cut expectations, but the gains are modest → cash flow is not fully risk-on, so gold maintains its safe-haven role.
• FED:
The Fed has signaled the end of its tightening cycle and opened the door to rate cuts starting in Q1/2026 → a strong medium-term catalyst for gold.
• TRUMP:
The Trump administration prioritizes increased defense spending, tax cuts, and tighter trade policies against China. This increases geopolitical risks → continues to support gold prices.
• Gold ETF – SPDR:
SPDR remains inactive, neither buying nor selling. During a long-term uptrend, the fact that SPDR is not selling is a positive signal.
b) Politics:
• Middle East tensions rising again.
• Russia–Ukraine conflict not cooling down.
• U.S.–China trade tensions may escalate.
• China–Japan tensions: Coast guard vessels from both countries repeatedly approach the Senkaku Islands. Japan is increasing military cooperation with the U.S., and China is responding strongly.
• The Trump administration is increasing pressure on Venezuela, threatening to re-impose heavy sanctions if no policy changes occur.
→ Geopolitical risks are rising, continuing to support gold prices.
c) Market Sentiment:
• Market sentiment is neutral–bullish.
• Geopolitical risks + Fed pivot expectations help maintain defensive cash flow.
2. Technical Analysis:
• Gold has broken out of the consolidation triangle and is retesting the previous resistance trendline → now acting as support.
• MA50 & MA20 are trending upward, indicating sustained bullish momentum.
• The 4,186 – 4,200 zone is an ideal retest area for price to rebound.
• Short-term targets: 4,274 → 4,300 → 4,380.
• Only if price breaks below 4,146 will the short-term trend weaken.
Overall technical view: Uptrend established – wait for retest to BUY safely.
RESISTANCE: 4,244 – 4,274 – 4,380
SUPPORT: 4,186 – 4,146 – 4,095
3. Previous Market Session (28/11/25):
• Gold traded in a narrow range, tested the upper trendline, and bounced back.
• No major movement due to lack of big news and SPDR staying inactive.
• Buyers maintain underlying support but not yet strong enough for a breakout.
• Price action mainly technical-driven.
4. Strategy for Today (01/12/25):
🪙 SELL XAUUSD | 4277 – 4275
SL: 4281
TP1: 4269
TP2: 4263
🪙 BUY XAUUSD | 4191 – 4193
SL: 4187
TP1: 4199
TP2: 4205
