Gold Extends Its 8-Week Winning Streak👋Hello everyone, what are your thoughts on OANDA:XAUUSD ?
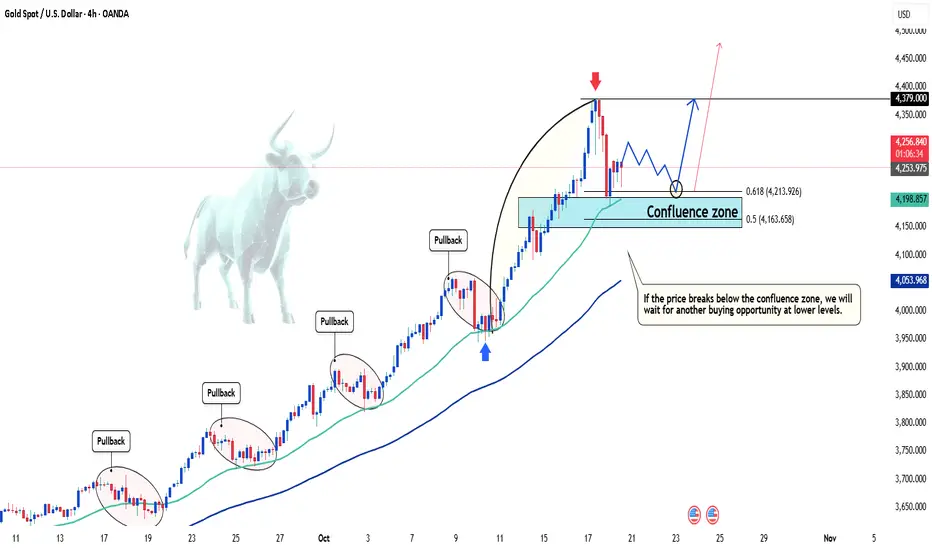
Over the past week, gold prices climbed close to the $4,400 mark before pulling back sharply and closing the week around $4,250, up $223 from the weekly open of $4,022 — nearly a 6% gain, marking the eighth consecutive week of growth. Despite the volatility, Main Street investors remain confident that the precious metal will continue to rise this week.
Trade tensions and geopolitical uncertainties have been the key drivers supporting gold’s rally. Meanwhile, the Fed’s rate cut and the U.S. government shutdown have strengthened the dollar while simultaneously providing support for gold prices.
At the time of writing, gold is fluctuating around $4,255, showing little change since the start of the session. Overall, the bullish trend remains intact, and as long as the confluence zone holds, buying opportunities are still favored.
What about you — what’s your outlook on XAUUSD? 💬Share your thoughts in the comments below, and let’s discuss!
Good luck!
Metals
Stop!Loss|Market View: EURUSD🙌 Stop!Loss team welcomes you❗️
In this post, we're going to talk about the near-term outlook for the EURUSD currency pair☝️
Potential trade setup:
🔔Entry level: 1.15425
💰TP: 1.14149
⛔️SL: 1.16114
"Market View" - a brief analysis of trading instruments, covering the most important aspects of the FOREX market.
👇 In the comments 👇 you can type the trading instrument you'd like to analyze, and we'll talk about it in our next posts.
💬 Description: Bearish mood for the euro persists. A strengthening of the USD is expected in the mid- and short term. The most aggressive sell scenario is to look for an entry point at the current price level below 1.16600 (alternative scenario). A more conservative scenario (main scenario) suggests an approach to support at 1.15500 and then a breakout towards 1.14000.
Thanks for your support 🚀
Profits for all ✅
❗️ Updates on this idea can be found below 👇

GOLD surges on political uncertainty and Fed easing expectationsOANDA:XAUUSD climbed to a fresh record high in the first trading session of the week, as expectations of an extended rate-cutting cycle by the Federal Reserve (Fed) and a wave of safe-haven assets continued to strengthen the rally.
Spot gold ended the session on Monday (October 20) up 2.47%, equivalent to $104.81, at $4,355.72/ounce, its biggest one-day gain since July. The recovery came after a correction last weekend, when the yield on the 10-year US Treasury bond fell two basis points to 3.991%, dragging the USD down. The US real yield, a measure reflecting the opportunity cost of holding gold, also fell to 1.723%.
The rally suggests the market is “repositioning expectations” as the Fed is expected to maintain its easy policy for the rest of the year. Investors now see a 96% chance of another 50 basis point cut by the end of 2025, according to CME FedWatch data.
In addition to monetary policy factors, the political picture in Washington has also contributed to the demand for gold. The US government entered the 20th day of a partial shutdown, with Congress still unable to reach a budget deal. This situation has delayed important economic data, including the September Consumer Price Index (CPI), clouding the economic picture ahead of the Fed’s policy meeting next week.
Global geopolitical risks continue to play a central role. Fighting between Israel and Hamas in the Gaza Strip has flared up again, threatening to unravel the recently signed ceasefire. Meanwhile, US-China trade talks are set to resume in Malaysia as the November 10 trade war truce deadline approaches. US President Donald Trump is expected to increase pressure on Beijing to cut fentanyl exports and resume soybean imports.
Personally, I believe that the combination of political, interest rate and global trade concerns is pushing gold back to the center of the international financial market. Gold prices could approach $4,500/ounce in the short term, and the possibility of reaching $5,000/ounce next year if political tensions continue to escalate.
With a gain of more than 62% since the beginning of the year, gold is currently the best performing asset among major commodities. The main drivers are strong central bank buying, the trend of de-dollarization of foreign exchange reserves and capital flows into Western gold ETFs.
Amid widespread political uncertainty and a dovish US monetary policy, gold appears to be resuming its historic role as not just a safe haven, but a measure of global confidence in the current financial system.
Technical Analysis OANDA:XAUUSD
Gold's medium-term uptrend remains strong within the uptrend channel, despite a short-term correction around the historical peak of $4,379/ounce. The candle on October 21 showed slight technical selling pressure after a long rally, but the price structure is still above the 21-day moving average (MA21) and has not broken the main uptrend channel.
The Fibonacci correction zones show that the important support levels are located at:
• 4,289 – 4,213 USD/ounce (Fibo 0.236–0.382): the nearest support zone, where buying pressure can return.
• 4,161 USD (Fibo 0.5): the balance level, which also coincides with the previous short-term bottom.
• 4,110 USD (Fibo 0.618): the important support level to preserve the medium-term uptrend.
The RSI is still above 70, reflecting the market in the overbought zone but there is no clear bearish divergence signal. This shows that there is a possibility of a short-term technical correction, but there is not enough sign for a trend reversal.
Overall, the main uptrend is still dominant, with the next target at 4,454 - 4,527 USD/ounce (Fibo extension zone 0.618 - 0.786).
If the price breaks through the 4,110 USD area, the bullish pattern will be temporarily invalidated, then we should observe the reaction around MA21 (~3,940 USD).
Comment: Gold is still in the "trend stability phase" with corrections considered as opportunities for re-accumulation, not reversal signals. Short-term investors should take advantage of technical recovery to optimize entry points, while closely controlling the risk zone below 4,110 USD.
SELL XAUUSD PRICE 4452 - 4450⚡️
↠↠ Stop Loss 4456
→Take Profit 1 4444
↨
→Take Profit 2 4438
BUY XAUUSD PRICE 4300 - 4302⚡️
↠↠ Stop Loss 4296
→Take Profit 1 4308
↨
→Take Profit 2 4314

Gold Price Analysis (XAUUSD) – October 21, 2025Gold continues to trade inside a well-defined upward channel, maintaining strong bullish momentum after bouncing sharply from the 4,160 support area. The recent corrective leg formed a clean “V-reversal” structure, suggesting renewed buyer interest as price approaches the mid-channel resistance zone around 4,340–4,360 USD.
On the 1-hour chart, the structure shows a sequence of higher highs and higher lows, confirming ongoing trend strength. The short-term pullback was absorbed quickly, and current price action indicates a potential breakout retest setup.
Key Technical Levels
Support 1: 4,290 – 4,300 (Fib 0.382 retracement & short-term EMA support)
Support 2: 4,160 – 4,180 (previous demand & trendline confluence)
Resistance 1: 4,360 – 4,380 (local swing high, short-term target)
Resistance 2: 4,440 – 4,470 (upper channel boundary / potential take-profit zone)
Trading Strategy
Primary bias: Buy on dips within the ascending channel
- Look for bullish confirmation around 4,300–4,310 to join the prevailing trend.
- Target short-term 4,380, extend to 4,450+ if momentum persists.
- Stop loss below 4,270 to maintain favorable risk-reward.
Alternative scenario:
If gold breaks below 4,270, expect deeper retracement toward 4,180 where strong buyers may re-enter.
Technical Outlook
EMA trend: Price remains above the 50-EMA on H1, confirming bullish control.
RSI: Currently near 60, leaving room for further upside before overbought levels.
Fibonacci structure: The 0.618 retracement aligns with the 4,300 zone — a key decision point for intraday traders.
Conclusion
Gold maintains a strong bullish structure supported by trendline and Fibonacci confluence. Short-term corrections are seen as opportunities to buy dips toward 4,300 with targets near 4,440–4,470. Traders should watch the 4,270 level as the key invalidation zone for the bullish setup.
Stay disciplined, and follow to receive more intraday trading strategies and market insights.

GOLD leveled off after its strongest rally since 1979OANDA:XAUUSD Falls After Trump's 'Softening' Comments on China
Gold Spot gold fell nearly 2% on Friday (October 17), ending a long rally after hitting a new record, as a stronger US dollar and President Donald Trump's soft remarks dampened demand for safe-haven assets.
Spot gold ended the session at $4,250.91 an ounce, down 1.74%, after peaking at $4,379.94 earlier in the session. The US dollar index rose 0.2%, making gold more expensive for foreign investors. Earlier, gold recorded its biggest weekly gain since the Lehman Brothers crisis in 2008.
Trump Calms Trade Tensions, Gold Loses Safe-haven Momentum
Speaking at the White House, Trump admitted that 100% tariffs on Chinese goods were “unsustainable” and confirmed plans to meet President Xi Jinping in the near future. The comments quickly changed market sentiment, easing expectations of an escalation in the trade conflict and pulling safe-haven demand away from gold.
FXStreet commented: “Gold prices fell about 2% from a historic peak as Trump eased his tone with Beijing. The recovery in risk sentiment kept the dollar strong and gold under pressure.”
The yield on the 10-year US Treasury note rose 3 basis points to 4.01%, while real yields rose nearly 2.5 basis points to 1.72%, further pressuring non-yielding assets like gold.
Medium-term outlook remains positive
Despite the short-term correction, gold prices have risen more than 64% year-to-date, boosted by expectations that the Federal Reserve will begin a rate-cutting cycle. The market is now pricing in a 25 basis point cut at its October meeting, and another in December.
HSBC has raised its 2025 average gold price forecast by $100 to $3,455 an ounce, and expects prices to reach $5,000 by 2026.
Some fresh concerns about credit risks emerged after two regional US banks reported $50 million in bad loans, but White House Senior Advisor Kevin Hassett reassured that the banking system remains liquid and “credit conditions are generally stable.”
Goldman Sachs: Gold Price Rally “Real-Based,” Not Speculative Bubble
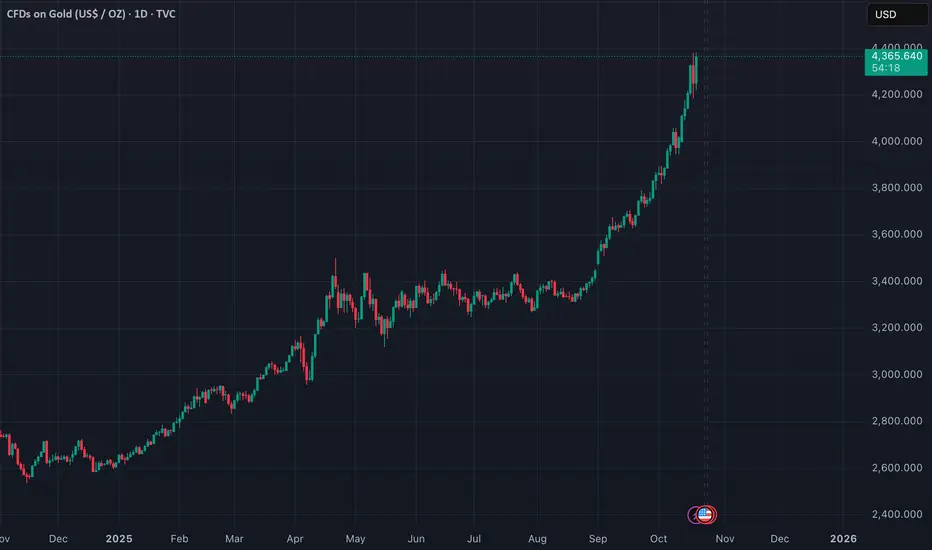
Gold prices continued to hit records this week, surpassing $4,300 an ounce on October 16, marking a four-session winning streak and a gain of about 65% year-to-date, the strongest since 1979. However, according to Goldman Sachs Group Inc., this is not a speculative frenzy, but reflects real demand from institutions and central banks.
“The current momentum in gold is not driven by euphoria,” Goldman Sachs said in a video conference. “Central banks continue to buy at record levels, while private investors are only gradually rebalancing their portfolios as the Fed accelerates the pace of rate cuts.”
After years of low asset allocations to gold, the market is now returning to a more reasonable balance, not a “gold bubble,” Goldman Sachs said.
Goldman Sachs raised its December 2026 gold price forecast from $4,300 to $4,900 an ounce, highlighting two key drivers: strong inflows into Western gold ETFs and sustained net buying by central banks, particularly in Asia and the Middle East.
Echoes of the 1970s: History Repeats in a New Way
Let’s compare the current cycle to the “gold rush” of the 1970s, when the US ended the Bretton Woods system, inflation soared and the oil crisis pushed the price of gold many times higher.
“Back then, budget deficits and policy uncertainty led investors to seek refuge outside the official monetary system. And now, similar factors are emerging, from US fiscal risks to geopolitical divergence, making gold continue to be a popular hedge.”
According to Goldman Sachs, the gold market is still relatively small compared to the scale of global capital flows, so each shift in capital flows greatly amplifies price fluctuations.
Technical outlook analysis of OANDA:XAUUSD
The daily chart of gold is still in a medium-long term uptrend, as shown by the price remaining above the MA21 and still in the uptrend channel despite the correction. After reaching a historical peak of 4,379, the price has dropped to around 4,250 USD/ounce, corresponding to the Fibonacci retracement level of 0.382.
• Current candlestick structure: a strong correction candle appears but has not broken the bullish structure.
• Important technical support zones:
o 4.216 – 4.160 (Fibo 0.382 – 0.5): potential short-term support zone.
o 4.110 (Fibo 0.618): stronger support, if this zone is broken, it can move into a deep correction phase.
• RSI: still above 70, showing that the market is still in the overbought zone, prone to strong short-term fluctuations but has not confirmed a reversal.
=> Conclusion of the main trend: Gold is still in the main uptrend, currently only in a technical correction phase after reaching the peak, there is no signal of a medium-term reversal.
SELL XAUUSD PRICE 4309 - 4307⚡️
↠↠ Stop Loss 4313
→Take Profit 1 4301
↨
→Take Profit 2 4295
BUY XAUUSD PRICE 4160 - 4162⚡️
↠↠ Stop Loss 4156
→Take Profit 1 4168
↨
→Take Profit 2 4174

Gold Pulls Back in Technical Correction, No Reversal Signal YetHello everyone,
Gold has entered a corrective phase after reaching the historical peak at 4,380–4,400 USD/oz. Selling pressure has emerged, triggering a strong bearish candle and sending price back to retest the 4,220–4,240 USD zone — also the lower boundary of the Kumo cloud on the Ichimoku system, acting as short-term support. At the moment, gold is attempting a slight recovery around 4,265 USD but still trades inside the Kumo cloud, suggesting a sideways correction after an overheated rally. On the H1 chart, the bullish structure has temporarily weakened with a sequence of Lower Highs and Lower Lows forming. The 4,280–4,310 USD area is a red Fair Value Gap (FVG) zone, currently serving as the nearest resistance where sellers may re-enter. Meanwhile, the thick Kumo cloud continues to reflect persistent corrective pressure, especially as recent declines were supported by rising volume — confirming profit-taking at peak levels.
From a fundamental perspective, this retracement is a healthy “cool-down” following nine consecutive weeks of gains. Gold surged nearly 25% in just two months — an exceptionally rare move in history — so profit-taking was inevitable. Additionally, sentiment has been influenced by the Federal Reserve’s lack of clear commitment regarding the timing of rate cuts. Recent US macro data such as CPI and retail sales exceeded expectations, giving the Fed justification to maintain a cautious stance. This has boosted the US Dollar Index (DXY) back toward 106.5, while the US 10-year Treasury yield has moved near 4.1%, reducing gold’s appeal as a non-yielding asset. Risk sentiment has also improved as geopolitical tension between the US and China cooled and the US government avoided a shutdown, prompting some safe-haven flows to rotate out of gold. Several analysts agree that this pullback is constructive for the broader trend, with Alex Kuptsikevich from FxPro noting that gold was “overbought” and needed a rebalancing phase, while Phillip Streible of Blue Line Futures reiterated that the long-term trend remains bullish.
In the short term, gold may continue to move within the 4,220–4,280 USD range, with a potential retest of the 4,210–4,220 USD zone — the lower boundary of the Kumo cloud. If buyers step back in and price breaks above 4,285 USD, a rebound toward the 4,300–4,315 USD FVG resistance zone is likely before the market decides its next direction. Only a confirmed break below 4,200 USD would reinforce further downside toward 4,150 USD. Conversely, holding above 4,200 USD would suggest gold is still in a healthy consolidation phase and retains the potential to revisit 4,300–4,350 USD in the coming sessions.

Gold Above 4300 – Watching for FVG Fill Before Next LegPrice consolidated all of yesterday’s Asian and London sessions before breaking bullish through NY, clearing the 4300 resistance.
Today, we’re holding above that breakout level and sitting just beneath the weekly high at 4398.
A 4H FVG rests below price around 4345–4360 — that’s my first area of interest for a retrace and possible continuation higher.
If price dips to fill that gap and shows strength, I’ll look for a long toward 4398–4420.
Otherwise, I’ll wait for a clear reclaim above the weekly high before confirming continuation.
Staying patient tonight — the easy part is waiting for the market to tell me what it wants to do.
#FuturesTrading #Gold #ICT #PriceAction #NOFOMO

GoldGold 🥇 | Comprehensive Technical Analysis - Setting a Significant Rejection Zone
Current Price: Around $4,353 | Timeframe: Daily - Weekly
Date: October 21, 2025
══════
📊 Overview On the Market:
Gold has completed an exceptional bullish cycle, reaching new all-time highs above 4,400, which I believe represents the local high for the current phase.
However, several technical factors now point to an imminent correction before any potential continuation.
══════
🔍 Key Technical Notes:
▪️ Price Zone:
The stock is currently trading in a bullish zone—an area where institutional investors historically tend to take profits and open short positions.
▪️ Market Sentiment:
Fear and Greed Index: 78/100 (Extreme Greed)
These extreme readings in bullish zones precede corrections in 85% of historical cases.
▪️ Structural Analysis:
- Overall Structure: Bullish (higher timeframes)
- Internal Structure: Showing signs of weakness and bearish divergence
- A potential Change in Personality (CHoCH) is forming on medium timeframes
▪️ Supply and Demand Zones:
Multiple untested resistance zones below, as well as unfilled fair value gaps that act as price magnets.
▪️ Multiple Timeframe Analysis:
Price is analyzed across multiple timeframes (4-hour, 1-day, 1-week, etc.) using advanced order flow techniques and proprietary market structure mapping tools—all of which point to a potential upcoming correction.
══════
🎯 Expected Scenario (High Probability):
Stage 1 - Initial Correction:
📍 Target 1: $3,777-$3,816
(Balance Zone)
📍 Target 2: $3,688-$3,749
(Discount Zone - Optimal Entry)
Stage 2 - Deeper Correction (Moderate Probability):
📍 Target 3: $3,465-$3,580
(Strong Institutional Demand - Buy Orders)
In addition to unfilled fair value gaps that act as price magnets.
Note: Additional Confirmation Required
After Reaching the Discount Zones:
The possibility of a continued uptrend exists, but is not currently highly likely. The situation will be reassessed upon reaching the demand zones.
══════
⚡ Why this analysis?
This analysis is based on:
✓ Advanced order flow analysis techniques
✓ Professional tools for mapping market structure
✓ Premium/Discount Zone Theory
✓ Detecting institutional order blocks
✓ Market sentiment analysis
✓ Liquidity level mapping
These are not traditional retail trading tools; they are institutional analysis techniques used by professional traders.
═════
📚 Previous Record:
Some may remember my previous analysis of gold in August 2023:
📌 Analysis for August 13 2023:
- Expectations: Rise from 1780
- Targets: 2500 → 2800 → Over 3800
- Result: ✅ 100% Success Rate
- Actual Movement: Reaching over 4400 (147% Profit)
- Update (April 2024): "Trade Closed at Target"
This analysis is based on the same institutional framework applied to this current situation. The methodology is effective because it tracks actual cash flow—not trader sentiment.
═════ ═════
⚠️ Risk Management (Mandatory):
Regardless of your confidence level, risk management is non-negotiable:
✓ Don't risk more than 1-2% of your capital on each trade.
✓ Always set a stop-loss before entering.
✓ Avoid excessive leverage.
✓ Maximize your profits. Steps
✓ Research yourself (DYOR)
══════════════════════════════════════ ═════
⚖️ Disclaimer:
This is educational technical analysis and does not constitute financial advice or an investment recommendation.
Trading carries a significant risk of capital loss.
Past performance does not guarantee future results.
Trade at your own risk.
Consult a licensed financial advisor before making any investment decisions.
══════
💬 Share your opinion with us:
What do you think of gold at these levels?
📊 If you found this analysis helpful, don't forget to like and follow it for more analysis.
🔔 Turn on notifications to receive updates as soon as this setting develops.
═════

Gold (XAUUSD) Weekly TF 2025Overview
This analysis outlines the structural Fibonacci confluences, scenario planning, and macro-aligned projections for Gold (XAUUSD) on the weekly timeframe. It integrates multi-layered Fibonacci extensions and retracements, mapping out key support and resistance levels, and proposes a nuanced primary scenario that includes both intermediate rallies and corrective movements.
Primary Scenario – Multi-Stage Movement Hypothesis
We anticipate that gold may initially extend higher from the current level (~$3,325) to test the 127.2% Fibonacci extension at $3,435, with the possibility of a further intermediate peak near $3,500. This level marks a psychological and technical resistance zone and could act as a temporary top.
Following this local peak, a corrective phase may unfold. This pullback could evolve into one of the two outlined correction scenarios:
1 TP Correction Scenario
Support Target: ~$2,950
Basis: 100% Fib extension confluence and prior resistance turned support
Expected Outcome: Price stabilizes at this level and resumes upward momentum
2 TP Correction Scenario
Support Target: ~$2,650
Basis: Strong historical structure + 100% Fib confluence from a broader cycle
Expected Outcome: This zone acts as a long-term demand accumulation area
Upon completion of the corrective structure, we expect gold to reinitiate its primary bullish trend.
Bullish Continuation Targets
TP1: ~$4,050 (161.8% Fibonacci extension)
TP2: ~$4,319 (261.8% Fibonacci extension)
These targets align with macroeconomic conditions, central bank accumulation trends, and long-term structural cycles.
Supporting Technicals
RSI: Holding above 50, indicating preserved bullish momentum
MACD: Positive crossover with widening histogram on weekly timeframe
Price Action: Strong support zone between $3,280–$3,300 aligning with 161.8% Fib retracement of the recent minor wave
Macro Fundamentals & Correlations
Central Bank Gold Demand: Sustained net buying by BRICS nations, particularly China and Russia, supports the structural bid on gold
Fed Policy: Market anticipates a prolonged pause or gradual rate cuts, favoring non-yielding assets like gold
DXY & US10Y Yields: Any further decline in DXY or softening yields would add tailwinds to gold
Crypto Correlation: During inflationary hedging or systemic risk periods, gold and crypto may correlate positively, especially with weakening USD
Intermarket Relationships: Gold, DXY, and TOTAL (Crypto Market Cap)
Gold vs. DXY (US Dollar Index)
Gold historically maintains an inverse correlation with DXY. A rising DXY tends to apply downward pressure on gold prices, while a falling DXY enhances gold's upside momentum.
Scenario Interactions:
If DXY breaks below 98, this could validate the bullish scenario for gold toward $3,435–$4,050.
If DXY rallies back above 100, it could trigger the correction scenarios ($2,950 or $2,650) in gold.
Gold vs. TOTAL (Crypto Market Cap)
Gold and TOTAL may show positive correlation during periods of USD weakening and global liquidity expansion.
Scenario Interactions:
If gold rallies toward $3,500 and TOTAL also breaks key resistance (e.g., $1.8T–$2T), this signals synchronized bullish risk appetite.
If gold corrects while TOTAL continues to rise, it could indicate rotation of liquidity from defensive to risk-on assets.
A simultaneous correction in both may occur if DXY strengthens aggressively or if macro shocks reduce global liquidity.
These intermarket relationships should be monitored continuously to assess the evolving macro context and validate the chosen scenario.
In the case of a gold correction toward $2,950 or $2,650, the impact on altcoins will hinge on the prevailing macroeconomic backdrop. If the correction stems from a healthy, technical rebalancing within a risk-on environment—without a concurrent surge in the U.S. dollar—it could signal a shift in capital from defensive assets like gold into more speculative plays, including altcoins. This type of capital rotation often benefits the crypto market, particularly if TOTAL (crypto market cap) holds or advances structurally. However, if the correction is caused by rising dollar strength, tightening financial conditions, or broader risk-off sentiment, altcoins may instead suffer alongside gold, as liquidity is withdrawn across the board. Therefore, the context and drivers behind gold’s correction are crucial in assessing its downstream effects on altcoin performance.
From a philosophical lens, gold's cyclical ascent and retreat mirrors the rhythm of nature and human experience—expansion, contraction, and renewal. Just as rivers carve valleys before surging toward the ocean, the market too must surrender gains to gather force. A correction in gold is not merely a financial event, but a moment of recalibration—an inhale before the next exhale of momentum. It invites reflection: whether wealth seeks refuge or ventures into risk, whether fear contracts or ambition expands. In this interplay, altcoins may inherit the restless spirit of capital in search of yield, as gold, the ancient anchor of value, briefly pauses in its timeless journey.
Conclusion
We present a multi-phased path for gold where:
An initial bullish breakout toward $3,435–$3,500 forms a short- to mid-term peak
A subsequent correction brings gold to either $2,950 or $2,650, depending on macro triggers
A renewed bull rally drives gold toward $4,050 and potentially $4,319 and beyond
This scenario reflects both the cyclical nature of market structure and the macro-fundamental backing that continues to support long-term gold strength.

XAUUSD Video Analysis Brief – Weekly Forecast Summary (2025)This video summarizes the key scenarios and technical outlook for Gold (XAUUSD) on the weekly timeframe, integrating both Fibonacci-based projections and macro fundamentals.
Core Setup
Gold is currently positioned near the 161.8% Fibonacci extension (~$3,276).
A breakout toward $3,500 is possible before a potential corrective move.
Scenario 1: Bullish Continuation
Gold breaks above $3,435 → rallies to $4300 → continues toward major Fibonacci targets:
TP: $4,320, which is the Fibonacci level 261.8%
Scenario 2: Correction First
Gold fails to hold above $3,435 → triggers a healthy correction to:
TP1: $2,920
TP2: $2,650
If support 161.8% level holds in the correction zone, a renewed bullish phase is expected.
Macro Alignment
Central bank gold buying (notably BRICS) supports the long-term bid.
Fed policy leaning dovish → tailwinds for gold.
Inverse correlation with DXY:
DXY below 98.95 → bullish for gold
DXY above 100 → signals correction
Effect on Altcoins
If correction is risk-on driven, capital may rotate into altcoins.
If triggered by macro stress or USD strength, alts may fall alongside gold.
This analysis offers a multi-scenario framework to navigate the next major moves in gold, with key levels to watch for traders, investors, and macro analysts alike.

GOLD XAUUSD LONGTERM 1-3M CHARTСhart shows the long-term gold price structure from the 1970s to 2040s, highlighting the main resistance (red) and main trend support lines (green).
(RED) Main Resistance ZONE— every time the price reached this upper red channel, a major correction followed (marked by red arrows).
(GREEN) Main Trend Support Line — has consistently acted as a strong long-term foundation for price recoveries since 1970.
Gold is approaching the upper boundary, suggesting we may be entering a distribution phase similar to 1980 and 2011, unless a strong breakout confirms a new supercycle... ----->
------> Just like from March 2006 to July 2011, gold may continue rising while the RSI shows long-term bearish divergence.
If history repeats, we may see a final blow-off phase before another deep retracement toward the mid or lower trend levels.

gold\btcI don't understand this...
If gold protects against inflation, why is it losing so much value against Bitcoin?
Conspiracy theorists, the stage is yours 👀

Regarding "catching the top" at all time highsWhen market conditions are as they are right now it is really tempting to try and predict the top. But please don't and here is why.
If you'd look at the gold chart right now you'd see that it has been running up all year long with a slight consolidation in the summer. At any moment this year it could have been "the top", but it wasn't. What I am pointing at is that the R:R of predicting the top when you are at the all time highs is unfavourable to say the least. Even if you would've been able to predict a throwback it would've been minor when comparing with the whole of the swing.
Now technical analysis is great and all but at all times in history there were some assets that were absolutely sentiment driven and you can squiggle what ever lines you want on that pretty colourful chart. It will not help you but give you false expectations of cracking the matrix. Market sentiment is like rabies - nobody knows whats going on and then sudden death. Now we have precious metals booming, it was A.I. before that, and EV's before that, and tech before that and so on and on and on. So when you're doing TA on a sentiment driven asset that is currently at all time highs it is only natural that the only thing you will look for is the top and in such matter you will become liquidity.
When what ever you are looking at is in price discovery mode you literally have no price history to look at. So tell me? What is you point of reference? People who work with fundamentals here have a greater edge because they don't even need to look at the chart to understand that we are in a territory that is volatile and pricing in a premium, but when you don't see the sticks forming you don't think about tops, you play the waiting game. Of course at some point in time the price will drop, but it will not be because of a fibonacci projection or a double top, or any other kind of TA pattern, at least not in this sentiment driven asset like gold. It will be because of two things - smart money exiting their positions and a change in sentiment. And for both of these to happen you need news and macro events to stir up the pot and to have someone or something to blame for the dips that are yet to come.
All in all, regarding "catching the top" - don't. It is gambling unless you have many and many years of experience trading in the markets at all time highs and probably the people that do have the so much needed experience will agree with me.
Trade smart, don't be liquidity.
GOLD Will Break ATH Again? Buy!
Hello,Traders!
GOLD Price is maintaining a strong bullish structure, consolidating just beneath its all-time high. Liquidity build-up above the highs suggests potential for an impulsive breakout, extending toward new record levels as buyers remain in full control. Time Frame 5H.
Buy!
Comment and subscribe to help us grow!
Check out other forecasts below too!
Disclosure: I am part of Trade Nation's Influencer program and receive a monthly fee for using their TradingView charts in my analysis.

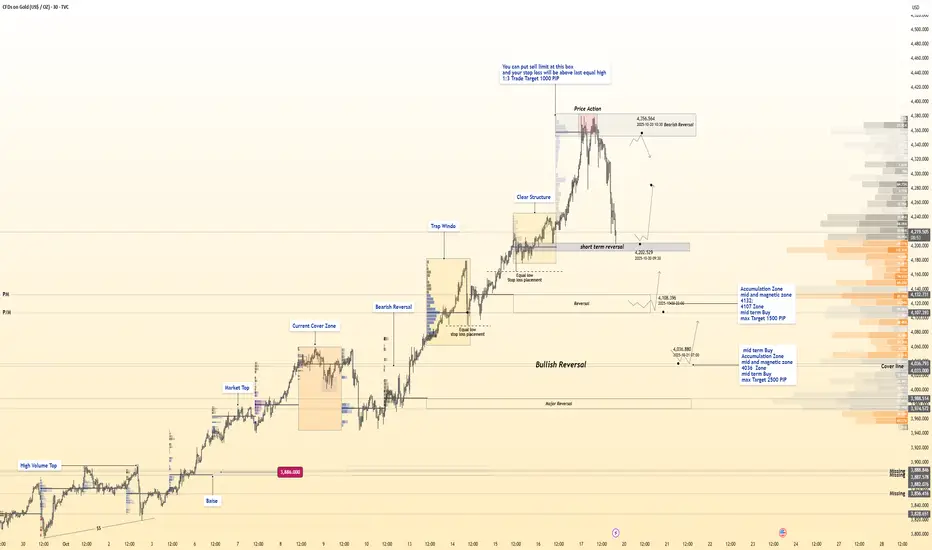
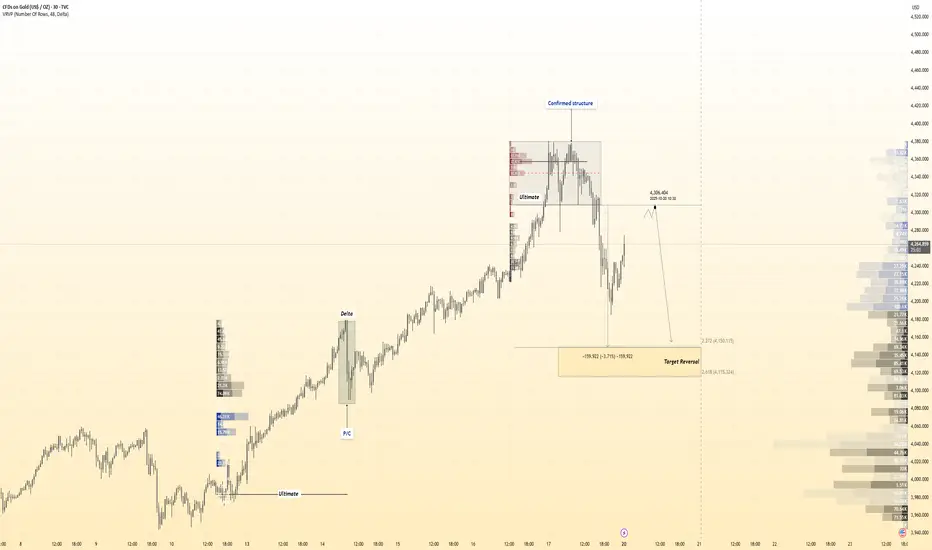
The Ultimate GOLD Reversal Map📊 Hanzo Protocol Note
Every marked level reflects precision between liquidity, delta reaction, and volume logic —
Only structure and flow decide — not bias.
Mid-Term SELL Zone — 4360
Setup: Limit Sell Recommended
Stop Loss: Above recent equal highs
Target: +1000 Pips (1:3 RR)
Reasons:
Liquidity pool above previous equal highs
Institutional distribution volume at upper range
HVN (High Volume Node) cluster acting as resistance wall
Delta shift showing heavy sell absorption
Imbalance re-test aligned with order block
4H premium pricing zone within range top
Price deviation above value area high
Stop hunt confirmation wick
Momentum divergence vs delta
Hidden distribution footprint visible on volume profile
Short-Term BUY Zone — 4202
Setup: Reactive Buy Opportunity
Target: 500–1000 Pips
Reasons:
Ultra-volume spike with no price continuation
Delta flip confirming buyer absorption
Trap formation below session low
Volume exhaustion beneath POC
Smart Money re-entry point after sell-side clear
Strong 30M reversal wick with liquidity gap
Reaction from prior fixed HVN
Internal structure shift with micro CHoCH
Buyer cluster confirmed under equilibrium
Perfect liquidity grab setup before new leg
Mid-Term BUY Zone — 4132 – 4107
Setup: Accumulation & Magnetic Demand Area
Target: Up to 1500 Pips
Reasons:
Multi-session HVN alignment
Strong accumulation footprint on delta flow
Reactive rejection at discounted price zone
Liquidity engineered below equilibrium
Large volume imbalance correction
Compression channel breakout origin
Major liquidity gap filled
High-probability reversal range from fixed profile
Delta divergence showing quiet buyer absorption
Institutional order flow detected at low volume shelf
Long-Term BUY Zone — 4036
Setup: Deep Accumulation Zone
Target: Up to 2500 Pips
Reasons:
Major 4H structural base confirmed
Deep liquidity flush below quarterly low
Volume absorption + delta compression zone
Institutional reloading pattern visible
Smart Money demand block within discount 0.79 level
Magnet zone aligning with historical POC
Strong rejection from fixed range low
Major delta shift to positive
Buyer footprint expansion in lower volume node
Final liquidity grab before long-term accumulation move
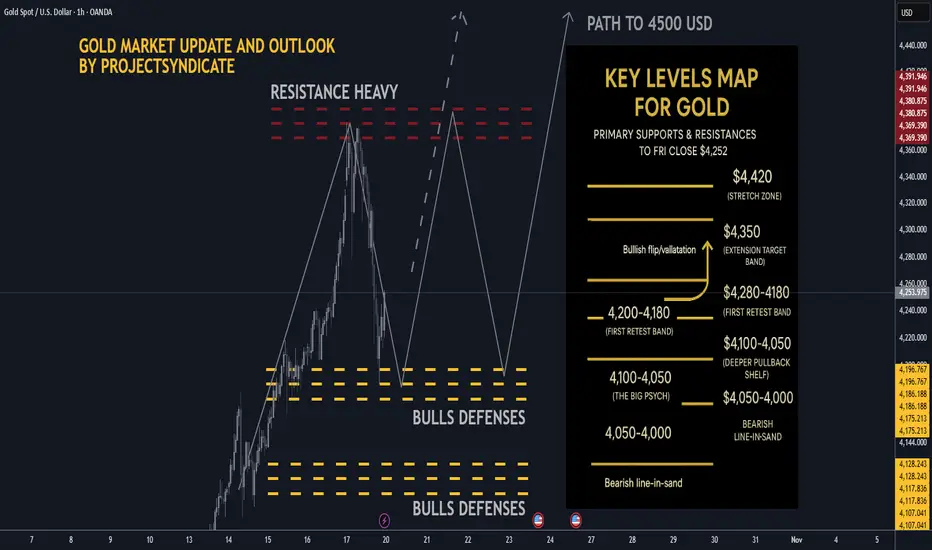
Gold next week: Key S/R Levels and Outlook for Traders🔥 GOLD WEEKLY SNAPSHOT — BY PROJECTSYNDICATE
🏆 High/Close: $4,379 → ~$4,252 — higher close vs. last week’s pullback finish.
📈 Trend: Uptrend intact > $4,000; dip buyers continue to control rhythm.
🛡 Supports: $4,180–$4,140 → $4,100–$4,050 → $4,000 must hold.
🚧 Resistances: $4,260 / $4,300 / $4,350 → stretch $4,380–$4,420.
🧭 Bias next week: Buy-the-dip > $4,140–$4,200; momentum regain targets $4,300–$4,380+. Invalidation < $4,050 → risk $4,000/3,980.
🌍 Macro tailwinds:
• Fed: Markets lean to another cut into Oct 28–29; softer real yields buoy gold.
• FX: DXY under pressure = constructive backdrop.
• Flows: ETF interest & CB buying remain supportive on dips.
• Geopolitics: Tariff/trade and regional risks keep safe-haven bids live.
🎯 Street view: Several houses float $5,000/oz by 2026 scenarios on easing policy & reserve diversification narratives
________________________________________
🔝 Key Resistance Zones
• $4,260–$4,280 near-ATH supply / immediate ceiling from close
• $4,300–$4,350 extension target band
• $4,380–$4,420 stretch zone toward prior spike high and measured extensions
🛡 Support Zones
• $4,220–$4,200 first retest band just below close
• $4,180–$4,140
• $4,100–$4,050 deeper pullback shelf; $4,000 remains the big psych
________________________________________
⚖️ Base Case Scenario
Expect shallow pullbacks into $4,220–$4,140 to be bought, followed by rotation back into the $4,260–$4,300 resistance stack for an ATH retest.
🚀 Breakout Trigger
A sustained push/acceptance > ~$4,280 unlocks $4,300 → $4,350, with room toward $4,380–$4,420 if momentum persists.
💡 Market Drivers
• Fed cut expectations into late Oct(lower real yields = gold tailwind
• USD softness / DXY sub-100 tone supports metals
• Ongoing central-bank bullion demand; ETF inflows stabilizing
• Geopolitics & trade/tariff headlines keeping safety bids active
🔓 Bull / Bear Trigger Lines
• Bullish above: $4,140–$4,200
• Bearish below: $4,100–$4,050 risk expands under $4,000
🧭 Strategy
Accumulate dips above $4,140–$4,200.
On breakout > $4,280, target $4,300–$4,350+. Maintain tight risk under stepped supports; invalidate momentum below $4,050–$4,000.
________________________________________
The 4400 era is coming, and the 4500 era is just beginning.Judging from the current trend, the middle track of the hourly line and the 4H line are already around 4280. As time goes by, the lower low point is constantly rising. We can appropriately increase the expected retracement target and participate in long trading when it retraces to around 4390-4380. But at the same time, we also need to pay attention to the short-term support formed by 4330-4320. If it falls back to this level in the evening and shows a clear stop in the decline, we can also consider entering the market in advance and going long on gold in this range. The upper pressure continues to focus on 4365-4380. If gold rebounds first, you can also consider shorting gold appropriately.
OANDA:XAUUSD

Gold's Historic Rally: Where We're HeadingGold broke out of a multi-year consolidation (2020–2024) when it cleared the previous all-time high of $2,080. Once that level broke, we entered price discovery mode .
This is important: There's no overhead resistance from traders who bought at higher levels because there are no higher levels. That's bullish. But it also means we're in uncharted territory.
The weekly chart shows a clean uptrend with no signs of reversal yet. But rallies this big and fast typically need consolidation phases.
Here's where it gets specific. Gold showed a classic consolidation pattern:
- Consolidation range: $2,565–$2,750
- Breakout point: Early 2025
- Measured move target: ~$3400
Using the Fibonacci extension, if the uptrend continues, it suggests the next major resistance is around $4,500 and $4,750.
If you plot these on a chart, you see:
- Gold broke out cleanly from consolidation
- Every pullback has been bought
We're in a controlled uptrend, not parabolic. This is the structure of a trend that could continue.
But it's also the structure that could reverse if critical support breaks.

( HANZO Gold Protocol ) Bearish Reversal Detected SELL Scenario — Hanzo Reversal Intel (Smart Money Phase III)
🔥Sell Reversal : 4307 Zone
Status: Active Reversal Protocol
Symbol: Gold
Session: London–New York Overlap (Smart Exit Window)
🧩 Technical Breakdown
➤ Volume Surge Confirmed
A clear overload of institutional sell volume detected at exhaustion highs. The tape confirms aggressive unloading by composite operators.
➤ Session Alignment
The Smart Money exit window is open — this is where large players offload liquidity before volatility collapse.
➤ Cluster Shield Active
Price met a dense supply cluster on the volume map, validating an active imbalance zone. This zone acts as a precision trap for late buyers.
➤ Delta Shift Turned Negative
Order flow flipped — buyers absorbed, sellers dominate. Imbalance sustained across multiple timeframes.
➤ POC Retest Completed
Liquidity re-engaged at the Point of Control, confirming absorption and rejection — final validation before reversal.
➤ Structure Fracture Pending
Micro-structure shows early bearish intent — liquidity purge complete, ready for engineered drop.
🧠 Hanzo Logic
This setup isn’t a prediction — it’s an engineered reaction. Every confirmation aligns with controlled liquidity flow, not retail patterns. Hanzo logic reads the market as a machine, not a chart.
🎯 Execution Objective
Bias: Bearish
Goal: Controlled short with minimal drawdown
Tactical Edge: Reversal precision through liquidity engineering
Confidence Level: ★★★★★ (Smart Money Aligned)
⚡️ Hanzo Signature Insight
Most traders see resistance — we see distribution intelligence.
What looks random to others… is designed precision to us.
Short-term volatility, how to plan for the next market trendGold is currently continuing its upward momentum. In the short term, we will first focus on whether gold can break through 4266. The intraday market has rebounded to this point many times and encountered resistance and fell back. If it is difficult to break through in the short term, the gold price will continue to fluctuate widely. On the contrary, if it can effectively break through 4266, continue to pay attention to the upper resistance range of 4280-4300. When the first rebound touches this resistance range, consider shorting gold in batches with light positions.
OANDA:XAUUSD

DEAD RECKONING: Gold, Silver, and Bitcoin vs. the Empire of DebtWhy This Time, Silver's Surge Might Signal a Systemic Shift—Not Another 1980 or 2011 Collapse
The world built on credit is sailing blind through heavy seas. Gold leads, silver amplifies, and Bitcoin holds the digital line as the Empire of Debt drifts toward its reckoning.
The Setup: A Colossus on the Brink
Picture the scene: a sovereign-debt Goliath staggering under $38 trillion in outstanding U.S. obligations—124 percent Debt to GDP ratio—while $600 trillion in derivatives lurk like a ready-to-blitzkrieg enemy beneath the surface.
The financial establishment, floating inside an $8 trillion post-GFC and COVID bailout bubble, ignores the real economy’s warnings. Re-industrialization is a mere concept and future hope, purchasing managers’ indexes are sliding, consumer defaults are climbing, housing is staggeringly unaffordable, and wages are dramatically lagging.
Gold, piercing $4,000 per ounce after a 62 percent 2025 surge, flashes the first distress signal. Central banks are buying more than 1,000 tons a year, and BRICS nations have piled up 6,000 tons , shifting half their trade off the dollar grid.
Silver, breaking above $50 and up 79 percent in 2025, exposes the weakening grip of paper suppression: 179 million ounces short, backwardation over $ 3, and a 265-million-ounce deficit that the derivatives complex can’t conceal.
NOTE: It will be interesting to see if the emergency cargo flights of Silver from New York to the LBMA in London will resolve the supply squeeze occurring across the pond.
Bitcoin, climbing to $126,000 and a $2.65 trillion market cap , thought recently struggling, up only 16.8% in 2025, fights beside them—half rebel, half captive—its decentralized ideals tangled in ETF custody, tech-related risk, and institutional leverage.
NOTE: Many argue that BITCOIN may have reached its 4-year cycle top with the recent print high of $126,272 . So long as any primary 4th wave bear market drop can stay above the old high at $69,000 , BITCOIN will then be poised to make new all-time-highs in the next bull phase. Caution is warranted for HODLERS if the $69,000 level is breached amid the next bear market, as that might suggest that the $126k crest marked a Super-Cycle first wave advance, and that an 80-90% decline would likely follow, bringing BTC down as far as $12,600 before the next bullish super cycle ensues.
These are not rival camps but brothers-in-arms: gold as the signal, silver as the amplifier, Bitcoin as the experiment in digital sovereignty.
Gold: The Beacon of the Sovereign-Debt Era
Gold’s ascent isn’t speculative froth—it’s a barometer of political and fiscal exhaustion.
Central-bank demand has turned relentless, with over 6,000 tons amassed in emerging-market vaults. The dollar’s share of global reserves, once dominant, is slipping below 58 percent as trade settles increasingly in local currencies or metals.
In a historic shift, the value of central banks’ gold reserves, now exceeding $4.5 trillion at $4,200 per ounce, has surpassed their U.S. Treasury holdings of approximately $3.8 trillion, marking the first such crossover since 1996.
This milestone underscores a growing preference for gold as a sanctions-proof, inflation-resistant asset amid rising geopolitical and fiscal uncertainties.
Behind the curtain, Washington’s debt mountain grows steeper, and an $8 trillion Fed balance sheet props up a system whose real wages stagnate. Gold sees through the façade.
Historically, gold rallies when confidence in sovereign debt erodes. 2025’s move feels structural, not cyclical. As technology enables tokenized gold settlement, physical bullion could soon anchor cross-border trade— $15 trillion a year moving outside the dollar’s orbit.
If that transition accelerates, gold’s total market value could multiply several times, transforming from a commodity to a monetary foundation once more.
Gold knows when governments lie; it rises on truth withheld.
Silver: The Fierce Ally
Silver’s run above $50 signifies more than nostalgia for 1980 or 2011. Industrial demand is devouring supply—solar, EVs, and India’s record imports have created a five-year deficit exceeding 265 million ounces .
Only about 100 million ounces remain deliverable on COMEX, a fraction of the market. Bullion banks sit on short positions equal to 12 percen t of global above-ground stock—an exposure large enough to spark contagion if prices keep climbing.
Backwardation above $3 per ounce and lease rates near 35-100 percent reveal a tightness the paper market can’t disguise. Supply discipline, not speculative frenzy, defines this cycle.
Following their ongoing pilots in tokenized gold, though entirely speculative, BRICS nations could extend similar efforts to silver, enabling scalable trading on blockchain platforms and restoring the metal’s monetary role alongside its yellow counterpart.
Unlike the boom-and-bust manias of the past, this move is grounded in fundamentals: dwindling supply, soaring utility, and faith migrating from financial promises to tangible reality.
Silver is gold’s conscience—smaller, scrappier, and impossible to suppress indefinitely.
BITCOIN: Brother in Arms, Bound by Chains
Bitcoin remains the digital insurgent in this triad. ETFs and state holdings—about 207,000 coins —have mainstreamed it, yet also blunted its radical edge. Transaction fees, volatility, and custodial control keep it from fulfilling the dream of instant, peer-to-peer cash.
Still, Bitcoin’s resilience commands respect. Its artificial 21-million-coin limit mirrors gold’s authentic scarcity, and its censorship resistance has made it a refuge in sanctioned economies. While institutional adoption ties it to Wall Street’s boom-bust rhythm, the core idea—money without permission—endures.
A major equity or credit unwind could knock it hard, but each cycle burns away speculation and strengthens the hands of true believers. Its role may ultimately be symbolic: proving that digital trust can exist outside the fiat web, even if imperfectly.
Gold has history, silver has utility, and Bitcoin has possibility.
The Cracks in the Real Economy
Beneath obscene market valuations lies stagnation. Small businesses close faster than they open. Household debt delinquencies rise while wage gains stagnate. Wall Street’s financialized economy levitates; Main Street’s productive one flounders.
Gold and silver prices are the seismograph warnings of such disparity and injustice. Their message: the ground beneath policy orthodoxy is giving way.
The next downturn may not mimic the inflationary shocks of the 1970s, the liquidity crunch of 2008, or the devastation of the 1930s depressionary deflation, but it will feel every bit as harsh.
Following a blow-off bubble top, a deflationary contraction could emerge—credit imploding under its own weight—forcing the Fed to choose between saving markets or saving the dollar’s credibility.
After Wall Street’s bubble mania peaks, an epic crash looms—forcing the Fed to choose: prop up markets or preserve the dollar’s fading trust. Desperate reflation efforts will likely follow, unleashing brutal stagflation with no clear ending.
Zero interest rates are unlikely to return; their side effects were too corrosive. Too strong a run toward the safe-haven dollar could shatter global balance sheets. The Fed walks a narrowing ridge.
Expect a world of oscillation—temporary rallies in the dollar and bonds, followed by renewed bids for tangible assets.
In such turbulence, metals may take up some safe-haven slack and regain their ancient role as monetary anchors, not investments. Bitcoin will need to prove itself amid such chaos.
America’s Fortress—But Not Forever
The United States is not Venezuela or Argentina.
Its reserve-currency status, military reach, and deep capital markets insulate it from runaway inflation. The dollar’s 58 percent reserve share and $3.5 trillion in foreign Treasury holdings remain formidable bulwarks.
But even fortresses erode.
BRICS nations now settle roughly half their trade outside the dollar. Their 6,000-ton gold cache is both insurance and a declaration.
If tokenized trade systems gain traction, the dollar’s unique privilege—to export inflation and import goods—will weaken.
America will likely manage a softer dollar to stay competitive, avoiding extremes that could trigger global chaos. Despite this, cracks are evident. Tariffs, debts, and deficits gnaw at the foundation—each with second, third, and fourth-order effects.
The empire won’t collapse in a day, but the margin of invincibility is gone.
The Establishment’s Countermoves
The narrow class of financial elites won’t surrender quietly. Expect renewed quantitative easing , aggressive swap lines , and tariffs or sanctions to defend dollar dominance and hegemony.
As digital-asset rules and surveillance intensify, governments adopt digital IDs, CBDCs, and tokenized gold —a desperate bid and admission that the fiat system is dying.
Such measures may stabilize the surface but could deepen the underlying rift between protected financial power and genuine merit-based wealth. Each intervention buys time while eroding trust—a classic symptom of late-cycle finance.
When manipulation becomes policy, markets stop believing in miracles.
The United Front
Gold, silver, and Bitcoin tell variations of the same story: distrust in promises backed only by debt.
Each represents a different path toward autonomy—physical, industrial, or digital—but all push against the same current of engineered dependence.
Gold leads as the monetary lodestar.
Silver echoes its signal through scarcity and utility.
Bitcoin experiments at the frontier, still volatile but alive with intent.
Together they form a loose alliance of realists—investors, savers, and skeptics—who sense that something fundamental has shifted.
Following the late 2020s and early 2030s—the expected fallout of the Fourth Turning—the world may witness a new architecture: metals backing trade, blockchains verifying trust, and fiat reduced to what it was always meant to be—credit, not creed.
Watch unemployment, the housing and credit markets, silver deliveries, and BRICS’ next summit. Those are potential fuses in this quiet pre-revolution stage of seismic transition.
Closing Reflection
We navigate by dead reckoning now—plotting our course from known hazards rather than clear horizons.
The Empire of Debt still commands vast power, but every chart, every ounce, and every block on the chain suggests the same direction: away from illusion and back toward something real.
Gold leads.
Silver shines.
Bitcoin fights.
And somewhere beyond the coming revolution, a sounder form of money waits to be rediscovered.

XAU/USD | First LONG, then SHORT! (READ THE CAPTION)By analyzing the Gold (XAUUSD) chart on the 15-minute timeframe, we can see that gold hit all targets between $4,300 and $4,350 and even rallied to $4,380.99, marking a new all-time high (ATH)!
After that, gold started to correct below $4,300, briefly dipping to $4,258 before bouncing back above $4,285. I expect that if the price moves into the $4,300–$4,317 zone, we may see a negative reaction or rejection from this area.
If that scenario plays out, gold could drop toward $4,250 as its first key target.
Keep a close eye on these levels — and if you have questions about gold’s trend, feel free to leave a comment using the link below!
Please support me with your likes and comments to motivate me to share more analysis with you and share your opinion about the possible trend of this chart with me !
Best Regards , Arman Shaban

SILVER: Strong Bearish Sentiment! Short!
My dear friends,
Today we will analyse SILVER together☺️
The in-trend continuation seems likely as the current long-term trend appears to be strong, and price is holding below a key level of 52.292 So a bearish continuation seems plausible, targeting the next low. We should enter on confirmation, and place a stop-loss beyond the recent swing level.
❤️Sending you lots of Love and Hugs❤️
