DeGRAM | GOLD seeks to decline📊 Technical Analysis
● Price trends inside a descending channel, posting lower highs after rejections at ~4045; latest pullback broke intraday base and points toward mid-channel.
● Bearish structure with failed bounce at prior support (~3950) keeps momentum down; next magnet sits near 3855 (channel/HTF support confluence).
💡 Fundamental Analysis
● Short-term bearish: stronger USD and improved risk appetite recently weighed on gold after the retest of record highs, triggering corrective pressure.
✨ Summary
● Bias: short toward 3950 → 3855, invalidation above 4045. Key levels: 4045 (res), 3950/3855 (supports).
-------------------
Share your opinion in the comments and support the idea with a like. Thanks for your support!
Metals

GOLD volatilityThe daily RSI for Gold is approaching to oversold area and this make make volatility in Gold for the next few weeks
GOLD → Sell-off due to uncertainty FX:XAUUSD is falling, the trend is downward, and we have confirmation of this. Profit-taking is leading to a decline, which is causing buyers to exit the market...
Caution ahead of the Fed: Markets are pricing in a 25 bp rate cut, but the main thing is the tone of the statement and Powell's comments on further steps. The USD is not ready to continue its growth and is starting to look downwards. The US government shutdown continues, adding uncertainty, which supports gold.
However, an important issue is the trade deal between the US and China; a positive outcome could put pressure on gold.
Gold is balancing between hopes for a trade truce and risks from Fed policy.
Support levels: 3895, 3820
Resistance levels: 3943, 3975, 4015
Since the opening of the session, the price has fallen by 2.3%, which is an intraday range. The 3900-3895 area may see a reaction in the form of a false breakdown and a correction to the imbalance zone before a possible further decline.
Best regards, R. Linda!

Stop!Loss|Market View: SILVER🙌 Stop!Loss team welcomes you❗️
In this post, we're going to talk about the near-term outlook for SILVER ☝️
Potential trade setup:
🔔Entry level: 45.69877
💰TP: 41.19089
⛔️SL: 48.77557
"Market View" - a brief analysis of trading instruments, covering the most important aspects of the FOREX market.
👇 In the comments 👇 you can type the trading instrument you'd like to analyze, and we'll talk about it in our next posts.
💬 Description: Metals remain a mid-term sell priority. For silver, the most likely scenario is the formation of a small accumulation near 47.48680 (main scenario), where the price expectedly paused its decline. Given the Fed's interest rate decision today, we can't rule out volatility, which could lead to a retest of the point of control (POC) area around 48.80 (alternative scenario). The downside target remains in the 41-42 range.
Thanks for your support 🚀
Profits for all ✅
❗️ Updates on this idea can be found below 👇

Stop!Loss|Market View: GBPUSD🙌 Stop!Loss team welcomes you❗️
In this post, we're going to talk about the near-term outlook for the GBPUSD currency pair☝️
Potential trade setup:
🔔Entry level: 1.33660
💰TP: 1.31160
⛔️SL: 1.34654
"Market View" - a brief analysis of trading instruments, covering the most important aspects of the FOREX market.
👇 In the comments 👇 you can type the trading instrument you'd like to analyze, and we'll talk about it in our next posts.
💬 Description: The pound's first downside targets, previously noted, have already been reached, namely 1.33000. Sell priority remains, but given potential volatility (the Fed's interest rate decision is today) and the presence of seller liquidity near 1.34 (sellers's stop-loss levels), a short-term strengthening of the pound is likely. This doesn't change the mid-term trend, and downside targets of 1.32, 1.31, and 1.30 are still being looked for.
Thanks for your support 🚀
Profits for all ✅
❗️ Updates on this idea can be found below 👇

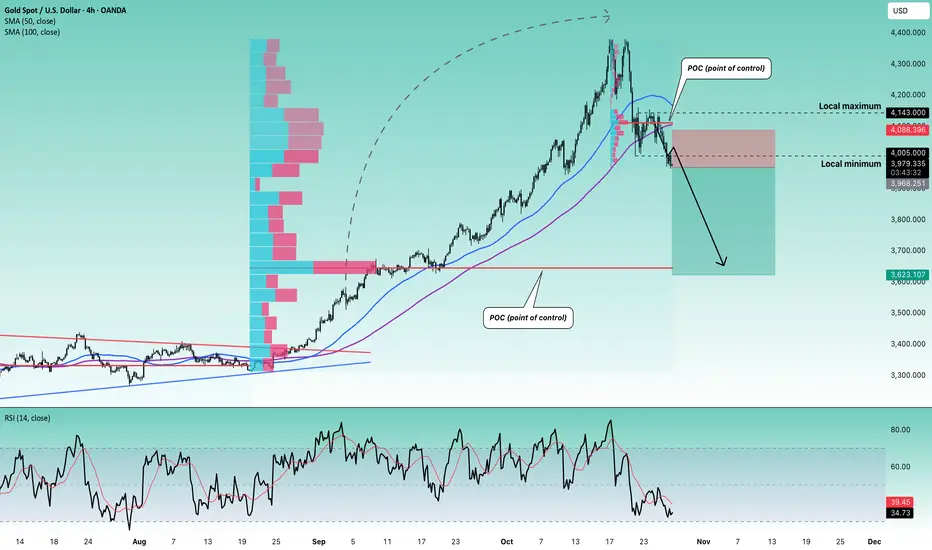
Stop!Loss|Market View: GOLD🙌 Stop!Loss team welcomes you❗️
In this post, we're going to talk about the near-term outlook for GOLD ☝️
Potential trade setup:
🔔Entry level: 3968.251
💰TP: 3623.107
⛔️SL: 4088.396
"Market View" - a brief analysis of trading instruments, covering the most important aspects of the FOREX market.
👇 In the comments 👇 you can type the trading instrument you'd like to analyze, and we'll talk about it in our next posts.
💬 Description: Metals have broken the lower border of previously identified accumulations. For gold, this is the price range of 4005 - 4143, indicating a highly probable downward impulse previously anticipated toward the 3600 - 3700 region. Currently, the main scenario is a breakout and entry around 3970. If the stop loss is triggered, re-entries can be considered.
Thanks for your support 🚀
Profits for all ✅
❗️ Updates on this idea can be found below 👇
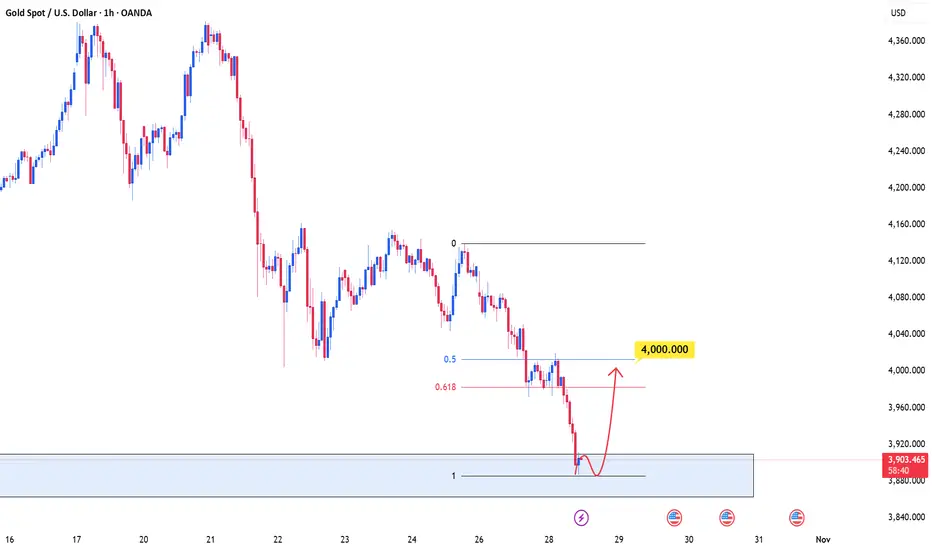
GOLD will return to the Fibonacci level after a sharp declineOANDA:XAUUSD The price recently experienced a sharp sell-off and, after being strongly rejected at a key resistance level, is now entering a stabilization phase. We’re currently in a consolidation phase, where the selling pressure is gradually subsiding.
If buyers can hold this level and push the price higher, the next target will be the Fibonacci retracement zone of 0.5–0.618, ranging between 4,000 and 4,020. This is a critical area, as it could mark the point where sellers may re-enter the market, creating further fluctuations.
Wishing you all successful trades and substantial profits!
XAU/USD Analysis – Gold Faces Rejection at 3975XAU/USD Analysis – Gold Faces Rejection at 3975, Potential for Further Downside
Gold continues to trade under selling pressure after failing to break above the 3975 resistance zone, which has acted as a strong ceiling for price several times in recent sessions. On the H1 timeframe, the market structure remains bearish, forming a sequence of lower highs and lower lows.
After a brief consolidation around 3965–3985, price appears to be creating a distribution range, suggesting potential continuation to the downside once liquidity above this minor range is collected.
Key Technical Zones:
Resistance: 3975 – 3985
Support: 3910 – 3880, with extended targets near 3820
Trading Strategy:
Traders may consider short opportunities near 3975–3980 if the price confirms rejection with bearish engulfing or RSI divergence.
First profit target around 3910, and extended target near 3880.
If gold breaks and holds above 3985, it could invalidate the short bias and trigger a short-term correction toward 4020–4030.
Technical Confluence:
EMA trend slope still points downward
RSI below 50 confirms bearish momentum
Fibonacci retracement 0.618 aligns with resistance zone
Today’s price action may remain range-bound ahead of key U.S. economic data later in the week, but as long as price holds below 3985, the bearish outlook remains intact.
Follow for more daily gold trading insights and strategic updates.

GC Futures – Are We Flipping Bearish Into Midweek?Tuesday closed below Monday’s low, hinting at a potential shift in sentiment.
Currently, price is approaching a 1H FVG inside the prior Asian range, just below the Weekly Low (W-L) and Daily High (D-H) — a perfect liquidity pocket.
I’m watching for signs of rejection here to confirm a bearish continuation. If price holds above this area, we may see a short squeeze back into higher value.
Bias remains bearish, but confirmation is key.
What are you seeing here — are we setting up for continuation or a fakeout?
#Gold #Futures #GC #DayTrading #SmartMoney #OrderFlow #ICT #NoFOMO

Gold Analysis: Price action is back... Revised Gold Market Analysis (XAU/USD)
1. Current Market Situation
Your technical view remains sharp. The market has seen a significant break below the major psychological level of $4,000 per ounce. It is currently consolidating in the $3,940 - $3,980 range, attempting to find its footing after this major drop.
This pullback has been driven by short-term fundamental factors, primarily a reduction in "safe-haven" demand due to easing US-China trade tensions and significant profit-taking.
2. The Critical Resistance Zone: $4113
Your identification of $4113 as the key resistance is a crucial correction. This level isn't just a minor pivot; it's a major structural ceiling, likely representing a recent high or a significant reversal point.
The $4,000 - $4,018 area, which was just broken, now acts as the first minor hurdle, but $4113 is the true test of the bullish trend.
Your Scenarios:
Scenario 1: Rejection (Your "Hard to Go Up" Thesis) You are correct. If gold attempts a rally from its current price but fails to reclaim the $4113 level, it will be a powerful bearish confirmation. This failure would signal that the recent break below $4000 was not a small correction but the start of a much deeper move, with **$3770** as the logical target.
Scenario 2: Breakout (Your "Return to Previous Rate" Thesis) This is the long-term bullish-continuation scenario. If the price can stabilize, build momentum, and eventually push back above $4113, it would invalidate the entire recent sell-off. This would prove the drop was just a deep pullback, trapping short-sellers and signaling a strong move to new, higher records.
3. The Powerful Support Zone: $3,770
Your identification of "377" (the $3,770 area) remains the most critical support floor. This is a major structural level that everyone is watching.
Key Moving Average: This zone aligns perfectly with the 50-day moving average (approx. $3,767), a key dynamic support level for institutional traders.
Structural Lows: It also lines up with other identified pivot points (e.g., $3,830 and $3,754) and the 1-month low.
A decisive break below this $3,770 zone would be a very serious bearish development, signaling a potential medium-term trend change.
4. Key Fundamental Drivers (The "Why")
The technicals are being driven by a powerful "tug-of-war" between opposing fundamental forces:
Bearish Pressure (Short-Term):
Geopolitics: Optimism around US-China trade talks is pulling money out of safe havens like gold and into "risk-on" assets like stocks.
Profit-Taking: After a historic rally, many large funds are selling to lock in massive profits.
Bullish Support (Long-Term):
Federal Reserve Policy: This is the most important factor. The market has priced in a ~96% probability of a Fed interest rate cut today (October 29). Lower interest rates make non-yielding gold more attractive.
U.S. Dollar: Fed cuts tend to weaken the US Dollar, which makes gold (priced in USD) cheaper for international buyers.
Central Bank Buying: Global central banks continue to be massive buyers of gold, providing a strong, consistent baseline of demand.

GOLD BEARISH BIAS|SHORT|
✅XAUUSD is reacting from a major supply level after a clean rejection of premium territory. Expect bearish continuation as price seeks to close the imbalance toward the marked target zone. Time Frame 4H.
SHORT🔥
✅Like and subscribe to never miss a new idea!✅

GOLD Free Signal! Sell!
Hello,Traders!
GOLD reacted precisely from the horizontal supply area, showing displacement and lower-timeframe structure breaks. A bearish move is expected as liquidity above the previous high was swept.
-------------------
Stop Loss: 3,993$
Take Profit: 3,882$
Entry: 3,938$
Time Frame: 3H
-------------------
Sell!
Comment and subscribe to help us grow!
Check out other forecasts below too!
Disclosure: I am part of Trade Nation's Influencer program and receive a monthly fee for using their TradingView charts in my analysis.

$GOLD is COOKED! Rotation into $BTC Soon!!MARKETS ARE SIGNALING RISK-ON 🔥
TVC:GOLD is so unbelievably COOKED 👨🍳
3 Black Crowes printed on the Daily, with a decisive close below the 20MA 🗡️
Waiting on the final nail in the coffin to close below the DANGER ZONE ~$3,900 where we will then see GOLD retest the 50MA along with the 50% Gann retrace $~3,750 ⚠️
I very much expect the rotation into CRYPTOCAP:BTC soon 👑

SILVER: Bullish, But Retracing. Sell The Dip, Buy At the +FVG!SIlver, like the other metals, is bullish. Currently, price is retracement. This could present a selling opportunity.
The -FVG is holding price at bay, If the market continues to respect this premium array, look for short term sells down to the sellside liquidity at the relative equal lows at 46.70, in
route to the Weekly +FVG.
There, we will look for high probability buy setups.
This is an ERL to IRL move, my peoples.
*Price may sweep the consolidation high before dropping lower. So be mindful of the potential for a liquidity event before the move.
Enjoy!
May profits be upon you.
Leave any questions or comments in the comment section.
I appreciate any feedback from my viewers!
Like and/or subscribe if you want more accurate analysis.
Thank you so much!
Disclaimer:
I do not provide personal investment advice and I am not a qualified licensed investment advisor.
All information found here, including any ideas, opinions, views, predictions, forecasts, commentaries, suggestions, expressed or implied herein, are for informational, entertainment or educational purposes only and should not be construed as personal investment advice. While the information provided is believed to be accurate, it may include errors or inaccuracies.
I will not and cannot be held liable for any actions you take as a result of anything you read here.
Conduct your own due diligence, or consult a licensed financial advisor or broker before making any and all investment decisions. Any investments, trades, speculations, or decisions made on the basis of any information found on this channel, expressed or implied herein, are committed at your own risk, financial or otherwise.

GOLD: Bullish, But Retracing! Short Term Sell Opportunity!In this Weekly Market Forecast, we will analyze the Gold (XAUUSD) for the week of Oct. 27 - 31st.
Gold is still bullish, the current pullback it's in notwithstanding. Waiting patiently for valid buy setups is the sure way to go.
That being said, there is sell setup that could present an short-term opportunity. The Daily -FVG is currently holding price in check. Should price return to it and it continues to hold, a valid sell opportunity could present itself.
Be careful, as it is counter-trend. They can be lower-probability.
Enjoy!
May profits be upon you.
Leave any questions or comments in the comment section.
I appreciate any feedback from my viewers!
Like and/or subscribe if you want more accurate analysis.
Thank you so much!
Disclaimer:
I do not provide personal investment advice and I am not a qualified licensed investment advisor.
All information found here, including any ideas, opinions, views, predictions, forecasts, commentaries, suggestions, expressed or implied herein, are for informational, entertainment or educational purposes only and should not be construed as personal investment advice. While the information provided is believed to be accurate, it may include errors or inaccuracies.
I will not and cannot be held liable for any actions you take as a result of anything you read here.
Conduct your own due diligence, or consult a licensed financial advisor or broker before making any and all investment decisions. Any investments, trades, speculations, or decisions made on the basis of any information found on this channel, expressed or implied herein, are committed at your own risk, financial or otherwise.

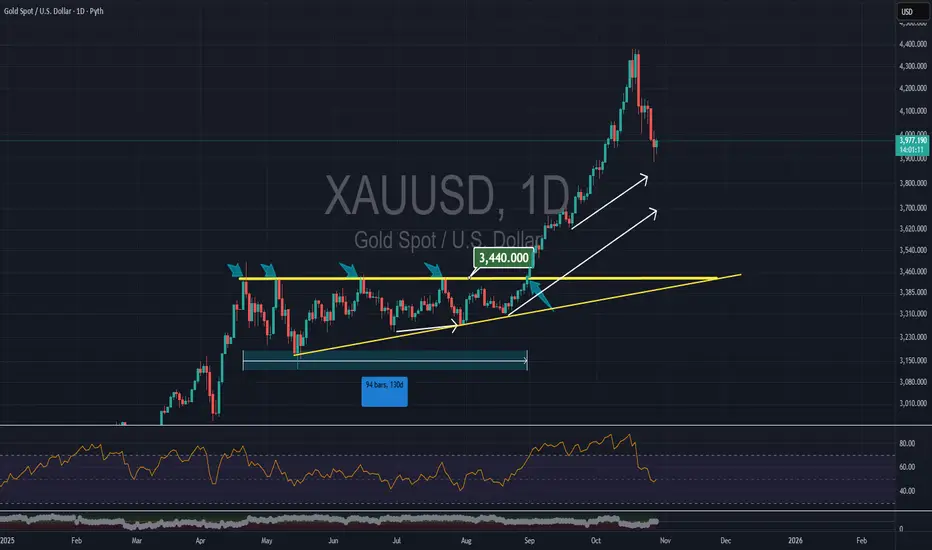
XAU/USD Completing Wave Y: Final Dip Before RallyGold has completed its major 5-wave rise and is now finishing a corrective W-X-Y pattern. The recent drop looks like the final leg of this correction, meaning sellers are getting weaker. Price may show a small bounce up and then one last dip to complete the correction. After that final drop, a strong new uptrend is expected to start again. In short: correction ending soon, last dip big bullish move ahead.
Stay tuned!
@Money_Dictators
Thank you :)

Why am I bearish when the market is bullish?#XAUUSD TVC:GOLD OANDA:XAUUSD
We have reminded everyone today that you can short gold in batches at key points, and now all short positions have been exited. When entering the market, it depends on the technology; when leaving the market, it depends on the mentality. Don’t be dominated by fear and greed. Profits belong to you only when you really get them in your hands. Otherwise, everything is just empty talk.
Short-term bears should not continue to participate blindly. By observing the hourly line trend, we can find that this is a typical upward trend. Therefore, bulls may still have a certain rebound momentum in the short term. But it should also be noted that there is pressure from the golden section point of 38.2%, or 3975, and it is also close to the downward trend line. Therefore, for evening trading, I think we can continue to be patient and wait, observe the performance of 3975-3990, and then consider appropriately participating in shorting gold after there is obvious pressure but it is not broken.

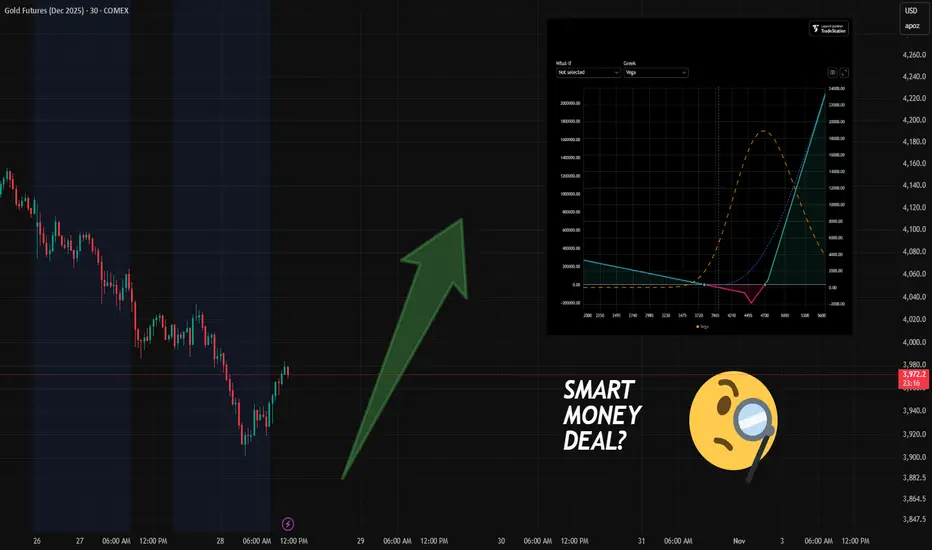
Quiet in FX Options — But Gold Is Heating Up
Over the past 24 hours, major currency options saw little of interest.
In contrast, precious metals — especially Gold — are attracting serious attention.
Let’s break down the key developments:
🔹 Observation #1: A New Bullish (But Hedged) Portfolio Appears
(See risk profile on screenshot.)
A new SMART option portfolio has entered the market:
Bullish bias, but with a built-in hedge — which reduces its predictive value.
If price drops below $3,800, the portfolio starts generating profit for its owner (via the hedge).
Built on the February 2025 futures contract, under an option series expiring in December 2025.
📌 Yes, it sounds confusing — and it is.
Option series expire, but futures live on.
This creates what we call "expiry risk" — a topic for another deep-dive article.
🔹 Observation #2: Put Activity at 3900 (Dec Series)
There’s growing activity in puts at the 3900 strike — moderate bullish positioning or support.
The bullish structure is hedged — not a pure directional bet.
Bearish positioning remains active.
Price has not yet shown signs of moving toward the main long setup.
I’d recommend at least 2–7 days of observation before considering any reversal trades.
📌 And here's why:
It’s rare for price to move immediately toward the target of a large, long-dated portfolio.
More often, there’s a delay of several days — especially when expiry is still far out.
Watch the flow.
Trade only when the edge is clear.
May the data-driven approach be with you!
LONG ON GOLD XAU/USDGOLD Has swept sell side liquidity at a major support zone.
It also has bullish divergence on the lower timeframes.
Additionally there is conflict between Iran and Israel which leads investors to safe havens like gold and silver.
I am looking to catch over 300 points on GOLD which is over 3000 pips.

GOLD 4H CHART ROUTE MAP UPDATE & TRADING PLAN FOR THE WEEKHey Everyone,
Please see our updated 4h chart levels and targets for the coming week.
We are seeing price play between two weighted levels with a gap above at 4173 and a gap below at 4079. We will need to see ema5 cross and lock on either weighted level to determine the next range.
We will see levels tested side by side until one of the weighted levels break and lock to confirm direction for the next range.
We will keep the above in mind when taking buys from dips. Our updated levels and weighted levels will allow us to track the movement down and then catch bounces up.
We will continue to buy dips using our support levels taking 20 to 40 pips. As stated before each of our level structures give 20 to 40 pip bounces, which is enough for a nice entry and exit. If you back test the levels we shared every week for the past 24 months, you can see how effectively they were used to trade with or against short/mid term swings and trends.
The swing range give bigger bounces then our weighted levels that's the difference between weighted levels and swing ranges.
BULLISH TARGET
4173
EMA5 CROSS AND LOCK ABOVE 4173 WILL OPEN THE FOLLOWING BULLISH TARGETS
4264
EMA5 CROSS AND LOCK ABOVE 4264 WILL OPEN THE FOLLOWING BULLISH TARGET
4333
EMA5 CROSS AND LOCK ABOVE 4333 WILL OPEN THE FOLLOWING BULLISH TARGET
4333
EMA5 CROSS AND LOCK ABOVE 4333 WILL OPEN THE FOLLOWING BULLISH TARGET
4422
EMA5 CROSS AND LOCK ABOVE 4422 WILL OPEN THE FOLLOWING BULLISH TARGET
4494
BEARISH TARGETS
4079
EMA5 CROSS AND LOCK BELOW 4079 WILL OPEN THE SWING RANGE
3985
3873
EMA5 CROSS AND LOCK BELOW 3873 WILL OPEN THE SECONDARY SWING RANGE
3741
3632
As always, we will keep you all updated with regular updates throughout the week and how we manage the active ideas and setups. Thank you all for your likes, comments and follows, we really appreciate it!
Mr Gold
GoldViewFX

XAU/USD: Bullish Rally to 4225?OANDA:XAUUSD is priming for a bullish rally on the 1-hour chart , with price pulling back to a critical support zone after a sharp decline, forming a potential reversal point as buyers defend against further downside amid overall uptrend signals. This setup highlights a classic dip-buy opportunity near the confluence of support and recent lows.
Entry zone between 4007-4037 for a long position. Target at 4225 near the resistance zone for attractive upside potential. 📊 Set a stop loss on a close below 3991 to manage risk effectively. 🌟 Keep an eye on confirmation through a bullish engulfing pattern or increased volume pushing above the entry, leveraging gold's volatility in response to USD movements.
Fundamentally , today's US Initial Jobless Claims and Existing Home Sales data could introduce volatility to gold and the dollar—Jobless Claims are forecasted at around 233K, while Existing Home Sales are expected near 4.00M, potentially strengthening USD if figures beat expectations and pressuring gold prices. 💡
📝 Trade Plan:
✅ Entry Zone: $4,007 – $4,037 (buy zone near support)
❌ Stop Loss: Close below $3,991
🎯 Target: $4,225 (resistance zone / take-profit area)
💎 Risk-to-Reward: More than 1:4, offering a strong technical edge.
What's your outlook on this trade? Share below! 👇

XAU/USD : Gold Breaks $4,000 Support – Can Bulls Hold the Line?By analyzing the Gold (XAUUSD) chart on the 2-hour timeframe, we can see that after rising to $4,138 and entering the marked supply zone, gold faced strong selling pressure and continued to drop, finally breaking below the $4,000 support and reaching $3,971.
As shown on the chart, this area is a key demand zone, and we expected a reaction here.
If gold manages to hold above the current level, we could see a short-term bounce toward $4,015. This analysis will be updated soon!
Please support me with your likes and comments to motivate me to share more analysis with you and share your opinion about the possible trend of this chart with me !
Best Regards , Arman Shaban

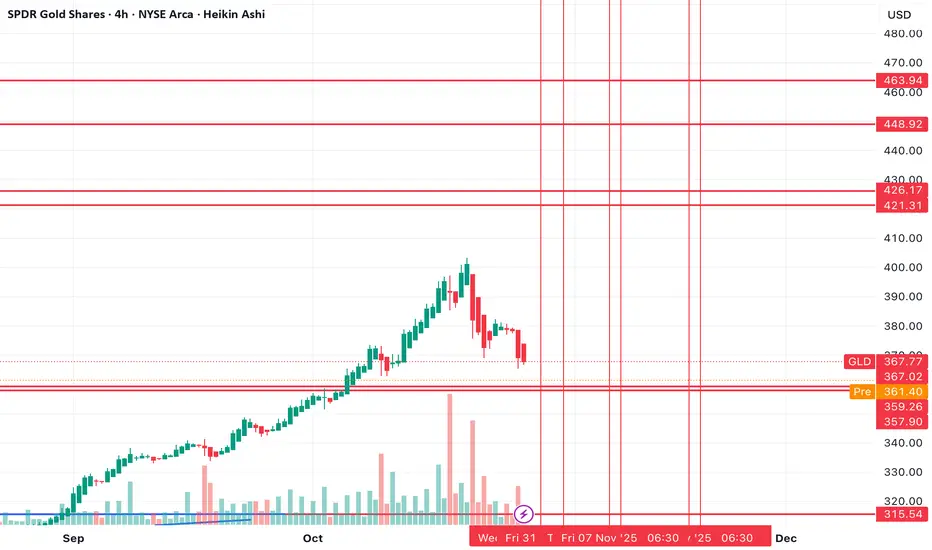
Buy the dip in GLD? Back above $400From a sentiment perspective, everyone is bearish GLD now that it's fallen so much over the last week. However, from the chart perspective, it looks like a great place to buy the dip.
If I turn on Bollinger bands, price is the furthest it's been outside of the bands to the downside from as far as I can see on the chart.
From an RSI standpoint, we're also still in extreme bullish areas on high timeframes. That makes me think that this is just a buy the dip scenario in a parabolic trend, and not the start of a larger selloff yet.
I think if we can hold these bottom support levels, the last leg higher will take us above $400. Likely to the first two resistance levels around the $420 area, but there's possibility that we can extend higher-- I've marked higher resistance levels off on the chart too. This should all play out before Nov 21st expiration.
Let's see how it plays out over the coming month or so.