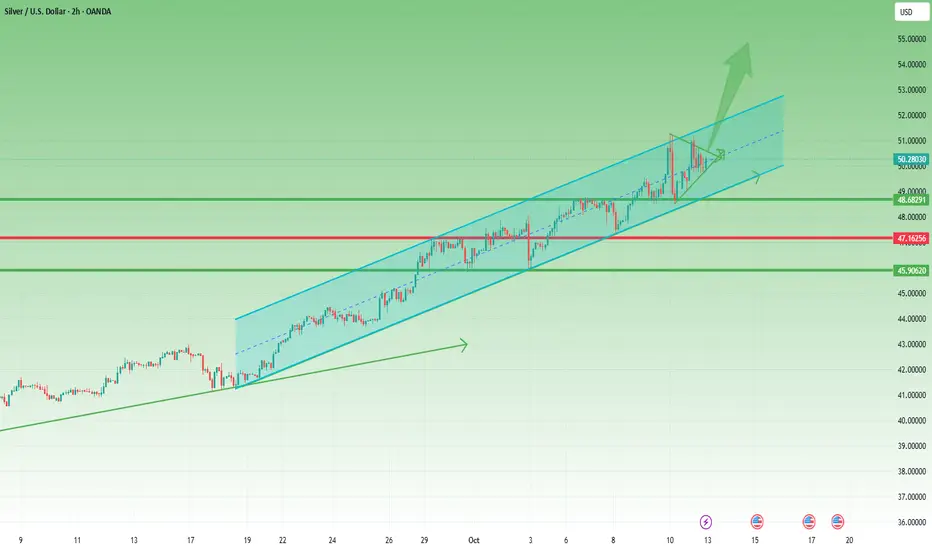
Silver: New ATH, Sharp Pullback, and What Comes NextLast week, something traders had been waiting for finally happened — Silver reached a new all-time high, touching 51.30 before a strong 3,000-pip selloff followed.
However, looking closely at the chart, we can see that this decline stopped precisely at the confluence of horizontal support and the ascending channel’s lower boundary — a technical level that often attracts renewed buying interest.
In my Friday’s analysis, I mentioned that although Silver looked very strong, traders should watch the ATH zone and the channel’s upper resistance for potential pullbacks. Indeed, XAGUSD reacted exactly from that area and corrected lower.
Now, things get very interesting:
1. Strong demand near $50 – Despite the initial drop on Friday, Silver built a solid floor just under the 50 level, suggesting that buyers remain in control and the recent ATH might just be a prelude to new highs.
2. Holding above the median line – The price is hovering around the channel’s midline without testing the lower boundary, a clear sign of underlying strength.
3. Potential pennant formation – Although not perfectly shaped, the price action since Thursday resembles a small pennant, which is typically a continuation pattern in bullish trends.
Putting these clues together, the technical picture still favors the upside, with confirmation coming if price sustains above the 50.50–50.70 zone.
If that happens, considering Silver’s recent momentum, we could easily see $55 as the next target in the coming week.
As long as $49 remains intact, my plan stays simple — buy the dips. 🚀
Metals
Global economic data faces disruptionThe trading week from October 11 to 17 is expected to be highly volatile as the U.S. government shutdown could delay the release of key economic data such as CPI and Nonfarm Payrolls (NFP), making it difficult for the Federal Reserve to assess inflation trends ahead of its upcoming policy meeting. Throughout the week, investors will focus on major events including the IMF and World Bank Annual Meetings, the NATO Defense Summit, and the G20 press conference.
Central banks like the Fed, ECB, and RBA will continue to shape market sentiment through speeches and meeting minutes, while China, OPEC, and the Eurozone will release crucial data on trade, inflation, and energy—potentially triggering short-term volatility across global markets.
Three key risks will dominate this week: escalating geopolitical tensions in Ukraine and the Middle East, central bank communications that could shift interest rate expectations, and the potential resurgence of trade wars dampening global risk appetite. In this environment, safe-haven assets such as gold, the U.S. dollar, and Treasury bonds are likely to attract capital inflows, while equities and commodities may face downward pressure.
Technical Outlook Analysis OANDA:XAUUSD
Trend Overview
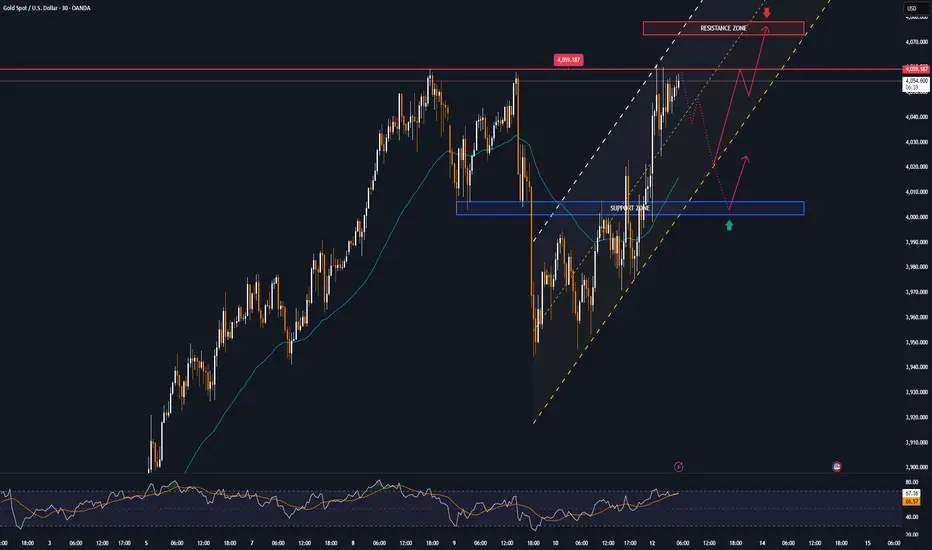
• After a short-term correction to around $3,950/oz, gold prices rebounded and closed above $4,000 – confirming the recovery momentum in the main uptrend.
• The main trend remains strong, supported by:
o The MA20 is clearly sloping up.
o RSI remains above 60, not yet giving an overbought signal.
o The uptrend channel is still maintained, the daily candle closed near the top – showing overwhelming buying power.
Key Technical Zones
• Nearest Resistance: $4,059 – this is the short-term top that needs to be overcome to extend the upside.
• Next Resistance:
o Fibonacci level 0.382 at $4,232,
o Level 0.5 at $4,320,
o And the 0.618 extension at $4,408 – potential targets if gold maintains the current momentum.
• Short-term Support:
o $4,000 (strong psychological zone – now turned from resistance to support).
o Deeper support at $3,896 – $3,871, coinciding with the confluence of MA20 + previous correction bottom.
Summary
• Gold is basically in an uptrend (Wave 3) with strong momentum and no RSI divergence signal yet.
• As long as the price holds above $3,950, the uptrend remains dominant.
• If there is a decisive breakout above $4,059, the next target will be the $4,230 – $4,320 zone in the short term.
SELL XAUUSD PRICE 4076 - 4074⚡️
↠↠ Stop Loss 4080
→Take Profit 1 4068
↨
→Take Profit 2 4062
BUY XAUUSD PRICE 4000 - 4002⚡️
↠↠ Stop Loss 3996
→Take Profit 1 4008
↨
→Take Profit 2 4014
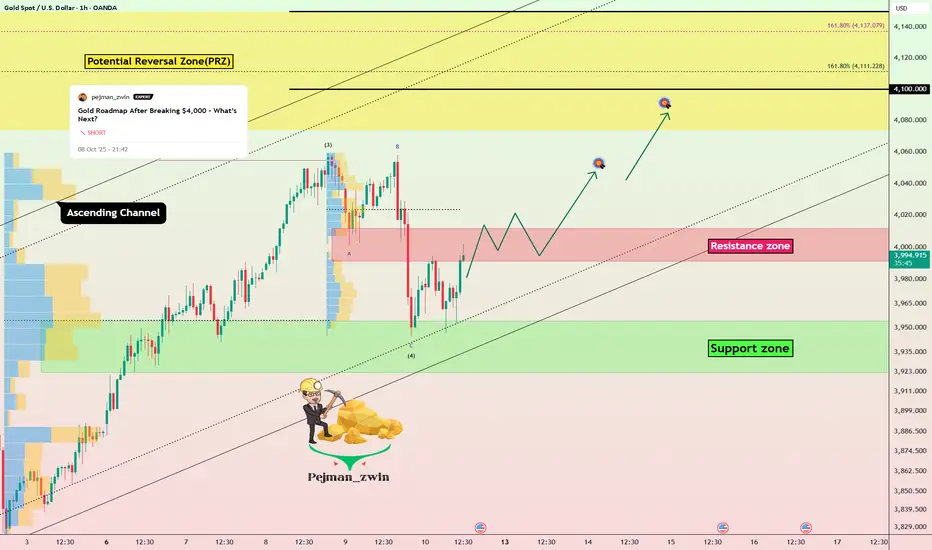
Gold Breakout Setup After Completing CorrectionGold ( OANDA:XAUUSD ) fell to $3,963 , as I expected in my previous idea .
Gold is currently moving near the lower line of the ascending and the Resistance zone($4,012 – $3,991) . If Gold touches $4,003 , we can expect a break of the Resistance zone($4,012 – $3,991) .
In terms of Elliott Wave theory , it seems that the Zigzag Correction(ABC/5-3-5) of Gold in the form of wave 4 has been completed, and we can expect a rise in Gold in the coming hours after the break of the Resistance zone($4,012 – $3,991) .
I expect Gold to break the Resistance zone($4,012 – $3,991) in the coming hours and rise to at least $4,047(First Target) .
Second Target: Potential Reversal Zone(PRZ)
Stop Loss(SL): $3,918(Worst)
Support zone: $3,954 – $3,923
-----------------------------
Today, we’ll be watching two reports :
Prelim UoM Consumer Sentiment and Prelim UoM Inflation Expectations.
If we see a significant deviation from expectations, it could trigger noticeable volatility in Gold .
-----------------------------
Please respect each other's ideas and express them politely if you agree or disagree.
Gold Analyze (XAUUSD), 1-hour time frame.
Be sure to follow the updated ideas.
Do not forget to put a Stop loss for your positions (For every position you want to open).
Please follow your strategy; this is just my idea, and I will gladly see your ideas in this post.
Please do not forget the ✅ ' like ' ✅ button 🙏😊 & Share it with your friends; thanks, and Trade safe.
XAUUSDXAUUSD If the price cannot break above 4077, it is expected that in the short term the price will likely go down. Consider selling in the red zone.
🔥Trading futures, forex, CFDs and stocks carries a risk of loss.
Please consider carefully whether such trading is suitable for you.
>>GooD Luck 😊
❤️ Like and subscribe to never miss a new idea!

gravestone after a strong uptrend gravestone in past week, as long as its below past week high, a shortsell candidate with that stop into consideration.

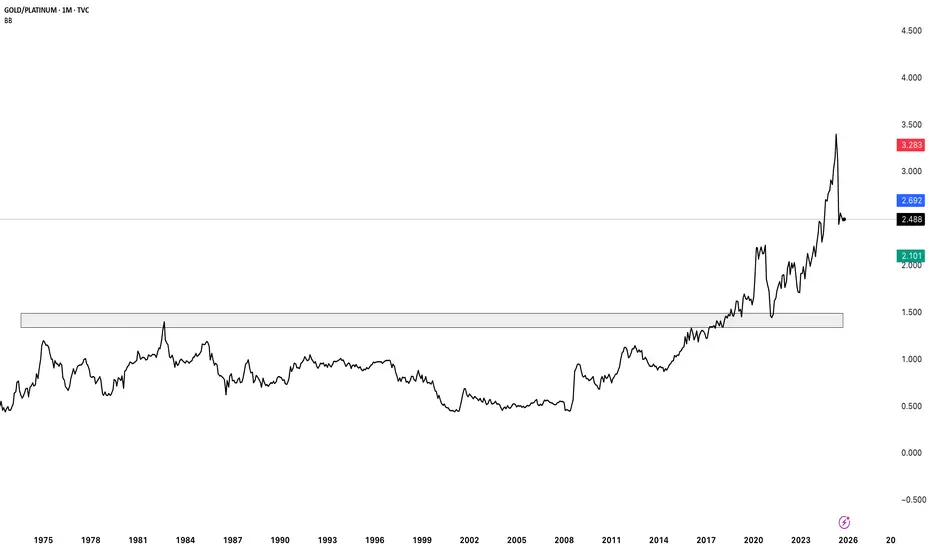
gold vs platinum ratio chart month scale gold strongly outperformed platinum on higher frame chart
Gold vs Platinum — A Tale of Two Precious Metals
Gold has always been the global store of value — a hedge against inflation, currency debasement, and geopolitical fear. Central banks hoard it, investors flock to it during crises. It’s less about industrial demand, more about trust.
Platinum, on the other hand, is the workhorse metal — crucial for automobile catalytic converters, hydrogen fuel cells, aerospace, and even medical implants. Unlike gold, its price is deeply tied to industrial cycles and EV transition trends.
🔎 Price Action Check (Gold/Platinum Ratio)
The chart shows the Gold-to-Platinum ratio stabilising after a steep fall, suggesting that platinum has been catching up after years of underperformance. Historically, whenever gold trades too far above platinum, it signals either platinum undervaluation... or gold over-enthusiasm.
With the renewable wave kicking in and auto demand reviving — is platinum gearing up for a comeback against gold?
XAU/USD Technical Outlook – October 13, 2025Gold continues to respect its ascending channel on the H1 timeframe. After retesting the 4,000 psychological level, price has regained momentum, forming a new short-term base around 4,035–4,045.
The structure remains bullish, supported by higher highs and higher lows, with dynamic support from the channel’s lower boundary. Traders are now watching the retest zone near 4,050—a potential launch point for the next impulsive wave toward 4,120–4,160.
Key levels to watch:
Support: 4,035 – 4,045 / 3,990
Resistance: 4,085 / 4,120 / 4,160
EMA alignment: Bullish across short and mid-term EMAs
RSI: Maintaining above the midline, confirming buying strength
Trading strategy:
If price holds above 4,035, consider buy setups on pullbacks toward the lower trendline or Fibonacci retracement 38.2–50% zones. A confirmed break above 4,085 may trigger strong continuation toward 4,120+.
However, failure to defend 4,035 could signal a temporary correction toward the 3,990 area before resuming the uptrend.
The bias stays bullish as long as structure and momentum remain intact within this channel.
Follow for more daily insights and advanced gold trading strategies.

Silver XAG/USD Eyes 49+ – Uptrend Intact, Pullback Could Fuel MoHello everyone,
Silver OANDA:XAGUSD is showing a strong uptrend and appears “well-fueled” to reach the 49+ region in the short term. This rally is supported not only by technical factors but also by a volatile macro backdrop. In the US, CPI and PCE metrics, especially Core, remain key drivers: softer-than-expected readings reduce real yields, weaken the USD, and boost silver; hotter prints apply pressure.
Growth and input-cost data such as ISM/PMI (Manufacturing & Services), notably Prices Paid, influence industrial demand – electronics, solar – but extreme readings could push yields and USD higher, offsetting the impact. Fed statements and FOMC minutes are also critical: dovish tones favor silver, hawkish stances weigh on price. ETF inflows and speculative positions further support the rally, with SLV, SIVR showing strong inflows and CFTC net longs rising.
On the 4H chart, the technical structure remains robust: price stays above the ascending Ichimoku cloud, FVG steps form and partially fill, producing healthy “push-rest-push” behavior. Key levels include support at 48.05–48.20, deeper at 47.60–47.80; resistance near 48.85–49.00, then 49.40, with higher targets at 49.80–50.00.
The preferred scenario is a shallow pullback to 48.05–48.20 to gather momentum, followed by a breakout through 48.85–49.00 toward 49.40; if buying pressure persists, 49.80–50.00 is reachable. This is supported by technical alignment, Ichimoku support, FVG steps, and a favorable macro backdrop: soft CPI/PCE/ISM data or dovish Fed moves lower real yields and USD, triggering strong breakout. Even neutral news favors buy-the-dip as long as 48.05–48.20 holds . The invalidation level is a 4H close below 47.60.
What do you think – will silver push past 49+, or will it need a corrective leg first?

SILVER (XAGUSD) 15M – Bearish Rejection Setup Ahead TVC:SILVER
Structure | Trend | Key Reaction Zones
Price reached the accumulation + resistance zone, facing repeated rejections.
Structure is forming a lower-high pattern beneath the descending trendline.
If the rejection confirms, a sharp drop toward the next liquidity pool (49.00 area) can follow.
Market Overview
Silver has been ranging within a broad accumulation zone after rejecting the upper resistance region around 50.8–51.2. The market shows weakness near the top of the channel, hinting at a bearish continuation phase. If momentum fails to break above the diagonal resistance, a downside move toward 49.5–49.0 becomes highly probable before a possible reaction from the strong demand box.
Key Scenarios
✅ Bearish Case 📉 → 🎯 Target 1: 49.52 | 🎯 Target 2: 49.03 | 🎯 Target 3: 48.70
❌ Bullish Case 🚀 → 🎯 Target 1: 50.80 | 🎯 Target 2: 51.20 (if resistance breaks cleanly)
Current Levels to Watch
Resistance 🔴 : 50.80 – 51.20
Support 🟢 : 49.50 – 49.00 – 48.70
⚠️ Disclaimer: For educational purposes only. Not financial advice.

$BTC / Global Liquidity Acceleration with Business Cycle Today’s PA confirmed an interesting theory I’ve had where liquidity reaches risk assets faster as the business cycle picks up.
I wrote about this in depth in my “Twin Peaks” cycle top thesis (pinned tweet).
We were charting Total Global Liquidity with a 12-week lead against CRYPTOCAP:BTC before the rate cut in September, and then we got a 1-point higher reading in the ISM PMI, which I believe accelerated the liquidity cycle by a couple weeks.
I think for every 25 bps rate cut, we will see TGL accelerate by 2-weeks.
The next rate cut is expected at the October 29th FOMC.
It will be interesting to track liquidity flows and the ISM PMI after the next rate cut to see how they adapt to markets.
The GOLD / BTC chart confirms this acceleration, as GOLD typically has a near 1:1 ratio with TGL.
I was one of the first analysts to point out this signal earlier in year before all your favorite large accounts ran with it (go figure).
This acceleration in TGL would mark our local bottom near perfectly.
If this theory is correct and liquidity does accelerate by another 2 weeks, based on TGL, we would have the cycle’s first top somewhere around November 11th.
Currently it’s the 25th with a 10-week lead.
That would coincide with my OG ₿itcoin cycle analysis that I put out over 1.5 years ago, where I said the cycle top would be between OCTOBER 6th, which was already a local top, and NOVEMBER 9th.
However, there is a discrepancy with the GOLD / BTC chart. The local top would be around December 3rd. It’s currently the 17th with a 10-week lead.
I think GOLD has overshot TGL simply based on bull market mechanics creating a parabola.
To sum it up, stay vigilant over these next few months, and take nothing for granted.
The first peak will for sure come sooner than you think.
Going to be fascinating to follow these liquidity flows, at the very least.

BRIEFING Week #41 : Havoc on CryptosHere's your weekly update ! Brought to you each weekend with years of track-record history..
Don't forget to hit the like/follow button if you feel like this post deserves it ;)
That's the best way to support me and help pushing this content to other users.
Kindly,
Phil

Gold’s outlook after Friday’s newsA question came in on TradingView about gold’s outlook after Friday’s news.
My analysis methodology is built on a holistic review of exchange data, where options flow plays a central role — something long-time followers of my posts are already familiar with.
So here’s what Friday’s options flow is quietly telling us:
🔸 The bearish put spread (on November option series ) targeting lower levels from October 8th onward is still intact — suggesting downside sentiment remains in play.
Now, let’s be realistic:
Sophisticated players can always flip this position mid-flight by adding futures to hedge — turning it into a neutral or even bullish setup if the rally continues.
After all, we’re dealing with pros with deep pockets — and they don’t like losing money.
They’ll adjust. They’ll hedge. They’ll exit clean.
🔸 Second, Friday’s CME activity leaned bearish (screen attached)— or at least, profit-taking (fixing).
We see call strikes above current price either being closed or re-sold.
Volume is present — but open interest is flat, declining, or even negative.
That tells a story:
No new conviction for higher prices.
Just closing old upside bets.
📌 Bottom line:
The flow doesn't scream "crash coming right now" — but it does whisper:
"Be careful with the longs."

GOLD (XAUUSD) – Smart Money Setup | Bullish Outlook Above 3985 Price is currently trading near a key FVG & Demand Zone (Fib 0.5–0.618), showing signs of potential bullish reversal.
If the structure holds above 3985–3970, buyers could target the Weekly High at 4059 after reclaiming the Previous Day High (4022).
Analysis Highlights:
HTF Bias: Bullish – Rejection from demand + liquidity sweep.
Key Levels:
Support: 3985 / 3970 / 3947
Resistance: 4022 / 4059
Trade Idea: Waiting for liquidity grab → bullish CHoCH → entry confirmation.
Target Zones: 4022 → 4059
Invalidation: Break and close below 3947 zone.

Gold’s Playbook Repeating in Silver?HI GUYS!
History doesn’t repeat, but in the markets, it often rhymes, and silver’s chart looks eerily familiar.
Gold’s long-term cup-and-handle pattern between 2013–2023 led to a massive breakout above $4,000. Now, silver appears to be tracing the same formation, just a few years behind.
Silver’s cup (2011–2024) has completed, and its handle (a descending channel) is forming right where gold’s did before it launched.
The measured target? Around $200+ USD, a level that would mark a historic revaluation of the metal.
With industrial demand rising and monetary uncertainty persisting, silver could soon follow gold’s lead, turning this technical Deja vu into a full-blown breakout.
History’s playbook is open. Silver might be next.

GOLD Free Signal! Buy!
Hello,Traders!
GOLD breaks above a key horizontal level, confirming bullish momentum as Smart Money drives price toward premium zones. The breakout suggests continuation to the 4,035$ target while respecting liquidity structure.
-------------------
Stop Loss: 3,993$
Take Profit: 4,035$
Entry: 4,016$
Time Frame: 1H
-------------------
Buy!
Comment and subscribe to help us grow!
Check out other forecasts below too!
Disclosure: I am part of Trade Nation's Influencer program and receive a monthly fee for using their TradingView charts in my analysis.

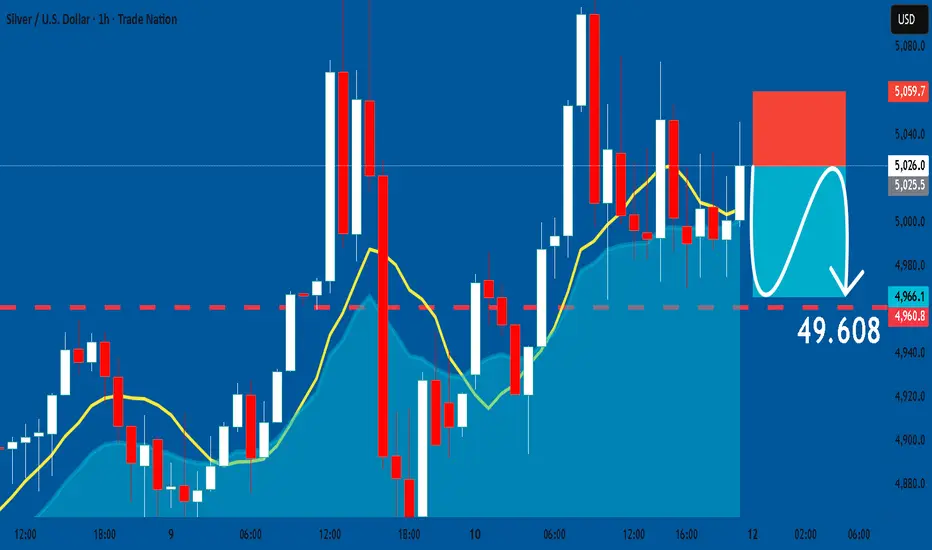
SILVER: Short Trade Explained
SILVER
- Classic bearish pattern
- Our team expects retracement
SUGGESTED TRADE:
Swing Trade
Sell SILVER
Entry - 50.260
Stop - 50.597
Take - 49.608
Our Risk - 1%
Start protection of your profits from lower levels
Disclosure: I am part of Trade Nation's Influencer program and receive a monthly fee for using their TradingView charts in my analysis.
❤️ Please, support our work with like & comment! ❤️
GOLD (XAUUSD): Bullish After Opening
Just a quick follow-up for my Friday's publication for Gold.
I do believe that we will see a bullish market opening with
a highly probable test of 4039 level.
Taking into consideration the latest news, the price may
establish a new ATH and continue rising.
❤️Please, support my work with like, thank you!❤️
I am part of Trade Nation's Influencer program and receive a monthly fee for using their TradingView charts in my analysis.

“Distribution? Maybe. Reversal? Nah. Just liquidity doing yoga.”Dear Goldies, ✨
Ten straight weeks — gold has climbed without looking back.
But every rally meets gravity, and this one now stands at the top of its own empire.
Above 4,000, price breathes thin air — a zone where profit-taking becomes a language, not a choice.
The macro trend remains bullish, yet momentum is stretched.
Price sits high above its 21–50 EMA band, RSI prints divergence — the signature of an overextended leg.
This isn’t weakness — it’s distribution inside strength. The first calm breath after a ten-week sprint.
🟡 Gold (XAUUSD) Structural Outlook
Macro Bias: Bullish, corrective phase
Gold trades deep within the premium range (4,050–4,180) — a historical supply.
Above 4,180 → 4,280–4,380 expansion
Below 3,720 → 3,420–3,300 re-accumulation
⚖️ The battle zone sits between 4,050–3,720, where liquidity decides control.
Weekly View:
Control Zone: 3,980–3,900
Supply: 4,050–4,130
Demand: 3,740–3,640
Soft USD = possible fake-out toward 4,185–4,260 before cooling.
H4 View: Compression → Expansion
Above 3,900: bullish rotations → 4,025 → 4,125 → 4,180
Below 3,900: correction → 3,840–3,700
H1 Intraday:
Main Supply: 4,045–4,065
Flip Zone: 4,015–4,030
Demand OB: 3,965–3,975
Sweep Zone: 3,945–3,925
Final Defense: 3,875–3,895
🎯 Tactical Paths:
🔼 Reclaim 4,030 → 4,065 → 4,105
🔽 Lose 3,975 → 3,945 → 3,875
🧭 Summary
Gold’s macro remains structurally bullish, but price is testing the top of its own range.
Expect engineered sweeps before FOMC as liquidity builds both sides.
4,050–4,180 → premium supply
3,900–3,740 → tactical demand
🦅 Patience > Prediction.
Reaction reveals intention — expansion follows timing.
Disclaimer : For Educational Purposes Only

YALLA XAUMO — WEEKLY COMPREHENSIVE (Confluence Edition)YALLA XAUMO — WEEKLY COMPREHENSIVE (Confluence Edition)
Educational only — not financial advice. Timezone: Africa/Cairo.
1) Snapshot & Map
Spot (XAUUSD): ~4012.8
Distribution Gate: 4022–4029 → unlocks 4046 → 4059.2 → 4090
Uploading bands (supports): 3985 (≈VWAP) • 3970.65 (15m swing low) • 3944.2 (H1/H4 base)
Context: Uptrend intact; repeated probes of 4029 with liquidity building below.
2) GC Futures Structure (COMEX)
GC1 (front): 4036.2
GC2 (next): 4054.4
Term spread: +0.45% → Contango (healthy carry)
Read: Spot marginally under GC1 → synced. Breakout quality improves if the spread flattens during a push.
Plain-English futures curve explainer (always included):
Contango → GC2 > GC1: a normal upward curve; storage/carry cost is priced in (not inherently bearish).
Backwardation → GC2 < GC1: often signals strong near-term demand or short supply.
Term spread (%) → % difference between GC2 and GC1 that shows whether the curve is rising or falling.
3) Fib-Kicker Volume Matrix
(Directional read; volumes summarized from your charts.)
Uploading = accumulation; Offloading = distribution at resistance.
4) Ichimoku Regime Table
15m: Price above cloud; Tenkan > Kijun; Chikou free above price → Bias +
1h: Touching/above Kijun; future cloud slightly up → Bias + (light)
4h: On/near cloud edge; needs a clean 4h close >4029 → Neutral → +
Daily: Well above cloud, stretched from Kijun → Bias ++
Weekly: Above cloud; major trend up → Bias ++
5) Schabacker Patterns (concise)
4h: Flag/rectangle build over 3985–4005.
Daily: Ongoing ascending structure; measured pushes toward 4046/4059.
Weekly: Extended uptrend; 4090 as decision/supply.
6) POC / VAL / VAH / VWAP Table
15m: POC ~4004 • VAL ~3996 • VAH ~4015 • VWAP ~4003
1h: POC ~4006 • VAL ~3992 • VAH ~4022 • VWAP ~4003
4h: POC ref ~3975.15 • value area rising toward ~4020 • VWAP wkly > 3995
Daily: POC 4012 • VAL 3995 • VAH 4029 • VWAP 4003
7) XAUMO Trend Map
15m: 62% Up — buy dips above VWAP 4003
1h: 58% Up — holding >4012 strengthens breakout odds
4h: 55% Neutral→Up — decision >4029
Daily: 68% Up — targets 4046/4059
Weekly: 72% Up — 4090 supply/trim zone
Composite bias: +61% Up — Prefer buy-the-dip; avoid chasing without RVOL & positive delta.
8) Kicker Improvement (Fib + Price Projections)
Gate: 4022–4029
Kickers: 4046 → 4059.2 → 4090
Below gate: Layered support 4003 → 3985/3971; 3944 break would invalidate the weekly bull case.
9) Trade Scenarios
A) Swing — Long (bias)
Type: Buy Limit on pullback into 3985–3971
Entry: 3988 ±
SL: 3961
TP1/TP2/TP3: 4029 / 4059 / 4090
Probability: 62% ↑
Confirmation: RVOL ≥ 1.1 + positive delta + 1H close above 4012/VWAP.
B) Reversal / Edge-Fade — Short (conditional)
Type: Sell Limit from 4046–4059 only on strong rejection
SL: 4066
TP1/TP2/TP3: 4029 / 4011 / 3995
Probability: 48% ↓
Confirmation: Negative delta + failure to close 1H above 4059 + RVOL rolls < 0.9.
Invalidation: 4H close >4066.
C) Scalping — Long (execution)
Type: Buy Stop >4022; add only after 15m/1h close >4029
SL: 4014
TP1/TP2: 4036 / 4046 (move SL to BE after TP1)
Probability: 58% ↑
Confirmation: RVOL ≥ 1.2, green delta, no sharp sell-off at 4046.
10) (Quick Kicker Reference)
4022 is ignition; sustained closes >4029 activate 4046 → 4059.2; 4090 is weekly decision/supply.
11) Macro Calendar — Week Ahead (Cairo)
Mon: Central-bank speaks / bill auctions.
Tue: Sentiment/Business surveys; secondary inflation prints.
Wed: Key inflation/central-bank minutes (if scheduled).
Thu: US jobless claims + activity gauges.
Fri: Consumer sentiment / inflation expectations.
Always re-check your platform calendar for exact times and adjust risk.
12) Arabic Quick Summary (one-liner)
Uptrend, buy dips 4003/3985, gate 4022–4029 → 4046/4059, fade 4046–4059 only with rejection & red delta, break 3944 kills weekly bull.
13) Quick Reference (levels)
Supports: 4003 • 3985 • 3970.65 • 3944.2
Gate: 4022–4029
Upside: 4046 → 4059.2 → 4090
Invalidation (Swing): Daily break <3944.
Disclaimer: Educational content only; not investment advice. Trading involves substantial risk.
🏆 Winners trade with XAUMO

GOLD MONTHLY CHART LONG TERM/RANGE ROUTE MAPHey Everyone,
We’ve just released our new Monthly Chart idea, which we’ll now be tracking following the successful completion of our previous long term monthly chart idea. That one played out beautifully, and now it’s time to shift focus to the next big setup.
Currently, price is trading above the channel midline, and we’ve also seen an important EMA5 cross and lock above 3099, with a candle body close confirming a long term gap above at 3557.
While this confirms the bullish long term structure, we’re also mindful of the potential for a short term retracement, particularly around the EMA5 detachment zone (highlighted with a circle on the chart). This would offer a healthy dip opportunity, aligning perfectly with our strategy to buy into weakness on the way up.
For the bigger structure to remain intact, we’ll be looking for 3099 to continue holding as key structural support. As long as that level is respected, the long term gap toward 3557 remains firmly in play.
This is a higher timeframe idea that we’ll be building on as structure continues to unfold.
We will continue to use all support structures, across all our multi time frame chart ideas to buy dips also keeping in mind our long term gaps above. Short term we may look bearish but looking at the monthly chart allows us to see the bigger picture and the overall long term Bullish trend.
As always, we will keep you all updated with regular updates throughout the week and how we manage the active ideas and setups. Thank you all for your likes, comments and follows, we really appreciate it!
Mr Gold
GoldViewFX

Silver Long-Term Outlook: Wyckoff, Fibonacci & Volunacci in PlayOn the monthly chart, Silver is showing a strong setup for long-term investors. We can clearly identify two adjacent Wyckoff accumulation patterns, signaling institutional accumulation phases.
Price action is following an ascending Fibonacci channel, reflecting a steady bullish structure. After breaking out of the second Wyckoff pattern, a Volunacci projection has formed—pointing toward a potential move to retest its historical high near $48.
This alignment of classic technical patterns with volume-based projection tools strengthens the long-term bullish case for Silver.

GOLD WEEKLY CHART MID/LONG TERM ROUTE MAPWeekly Chart Update – Follow Up
3732 & 3806 Objectives Achieved, 3910 Gap Opens
Hey Everyone,
Last week’s structure played out precisely as projected, we achieved our 3806 target following a confirmed body close above 3732, validating the continuation leg within our Goldturn structures.
This week, we’ve seen a weekly candle body close above 3806, officially opening the 3910 gap zone. The bullish structure remains well defined, supported by four consecutive weeks of EMA5 detachment, which confirms sustained upside momentum. However, this extended separation also signals potential for sharp corrective phases, requiring careful risk management and dynamic positioning.
Current Outlook
🔹 3732 Breakout & 3806 Objective Completed
Last week’s projected upside target was met precisely following a strong candle close confirmation.
🔹 3910 Gap Now Active
With the weekly close above 3806, the next structural resistance opens toward the 3910 zone.
🔹 EMA5 Detachment (4 Weeks Running)
Persistent detachment supports ongoing bullish momentum, but traders should remain alert for any mean reversion pullbacks or exhaustion on lower timeframes.
🔹 Support Structure
Immediate support now rests at 3806, followed by 3732 as a pivotal retest zone. Deeper support sits at 3659, which aligns with the ascending channel top confluence a critical structural level if broader correction unfolds.
Updated Key Levels
📉 Supports: 3806 (immediate), 3732 (secondary), 3659 (pivotal channel confluence)
📈 Resistance / Next Upside Objective: 3910–4015 zone
Plan & Risk Outlook
The bullish framework remains intact, but with EMA5 detachment now stretched, traders should anticipate volatility spikes or short term corrective dips. A controlled pullback into the lower Goldturns would be considered technically healthy and may offer fresh accumulation opportunities in line with the broader structure.
We’ll continue to monitor for confirmation closes and EMA5 realignments during the week to gauge whether momentum extends or correction begins.
Trade safe, stay disciplined, and manage exposure around volatility.
Mr. Gold
GoldViewFX

Gold. Cycle analysis 12/Oct/25XAUUSD's Cycle number 14 ( black bold ) is overdue, probably a big dive of gold price just before/after postponed many weeks NFP news?
