XAUUSD Long: Buyers Eye Push Toward $4,100 ResistanceHello traders! XAUUSD is developing a clear technical structure after reacting multiple times to both the Supply and Demand zones, forming a well-defined pattern of price behavior. Recently, Gold rejected the Supply Line after creating a new Pivot Point near the $4,230 area — the same region where a previous strong rejection occurred. This confluence confirms that sellers remain active at the upper boundary of the market. Earlier, the market formed a Double Top pattern near the same Supply Zone, which triggered a strong bearish reversal. After the breakdown, price retested the $4,100 level several times, turning it into a meaningful local resistance. Multiple breakout attempts above this level failed, signaling strong selling pressure from the supply area.
Currently, XAUUSD is testing the Demand Line that has been respected consistently throughout the recent bullish leg. Each touch of this trendline resulted in a higher pivot point, confirming active buyers stepping into the market. This area aligns with the $4,000–$4,010 Demand Zone — a key support cluster where price has reacted with strong bullish impulses before.
My scenario as long as XAUUSD holds above the Demand Line and the $4,000–$4,010 support, the bullish structure remains valid. A rebound from this zone may initiate a fresh move toward the $4,100 Supply Zone (TP1), where the next important reaction is expected. A clean breakout above $4,100 would strengthen the bullish scenario and open the path toward $4,150–$4,170, aligning with the upper Supply Line. If Gold fails to hold above the Demand Zone, sellers may regain control and push the price lower toward the $3,960 support, signaling a deeper correction phase. For now, the market favors buying pullbacks near demand while monitoring price action closely around the $4,100 resistance. Manage your risk!
Metals

XAUUSD: Bullish Rebound Setup as Price Holds Above Wedge SupportHello everyone, here is my breakdown of the current Gold setup.
Market Analysis
XAUUSD is currently maintaining a bullish market structure after rebounding from the key Wedge Support Line, which continues to act as a major dynamic support for the ongoing uptrend. The chart shows that Gold previously formed a broad Range at the top, followed by a sharp rejection from the Resistance Area near $4,170–$4,200, where strong sellers stepped in. This zone remains the primary supply region and aligns closely with the Wedge Resistance Line, creating a strong confluence barrier. After the rejection, price moved back into a correction phase, retesting both the Support Zone around $4,040–$4,070 and the ascending wedge structure. Notably, the recent bullish reaction inside this zone indicates that buyers are still defending this area effectively. Multiple breakouts and a prior fake breakout highlight that sellers are struggling to maintain downward momentum, while buyers continue to accumulate at lower levels.
Currently, XAUUSD is stabilizing just above the Support Zone, forming early signs of a potential upward continuation. As long as the price respects the wedge support and holds above $4,070, the bullish structure remains intact. The market behavior suggests increasing buyer interest, especially during retests of lower support.
My Scenario & Strategy
I expect Gold to continue its upward movement from the current support area and retest the $4,170–$4,200 Resistance Zone once again. This level will be the next major decision point; a successful breakout above this zone could open the path toward higher highs and potentially signal a continuation of the broader bullish trend.
However, if XAUUSD breaks below the Wedge Support Line, the bullish outlook would weaken, and the price could revisit deeper support levels before buyers attempt another recovery. For now, bullish continuation remains the most probable scenario as long as the support structure holds. Pullback-based long entries remain the best approach while price continues to trade above the key support zone and upward trendline.
That's the setup I'm tracking. Thank you for your attention, and always manage your risk.

DeGRAM | GOLD will rebound from the $4000 level📊 Technical Analysis
● XAU/USD is rebounding from the 3,980–4,000 support zone, aligning with the rising channel support and a confluence of dynamic trendlines.
● A break of the descending structure signals a potential push toward 4,138, followed by 4,175 if momentum sustains above the reclaimed support.
💡 Fundamental Analysis
● Gold is gaining as US yields ease and safe-haven demand picks up amid renewed geopolitical tensions.
✨ Summary
Support: 3,980–4,000. Targets: 4,138 → 4,175. Bias stays bullish while price holds above channel support.
-------------------
Share your opinion in the comments and support the idea with a like. Thanks for your support!

SILVER Will Go Down From Resistance! Short!
Take a look at our analysis for SILVER.
Time Frame: 1D
Current Trend: Bearish
Sentiment: Overbought (based on 7-period RSI)
Forecast: Bearish
The market is approaching a key horizontal level 5,142.9.
Considering the today's price action, probabilities will be high to see a movement to 4,723.3.
P.S
The term oversold refers to a condition where an asset has traded lower in price and has the potential for a price bounce.
Overbought refers to market scenarios where the instrument is traded considerably higher than its fair value. Overvaluation is caused by market sentiments when there is positive news.
Like and subscribe and comment my ideas if you enjoy them!

GOLD REBOUNDS AFTER THE 4000 DIP – ARE THE BUYERS COMING BACK?📌 XAUUSD PLAN – 19/11/2025
🖥 1. Key Market Highlights
The Asian session dropped to 4000, but the European and US sessions pushed gold back up to 4075–4080.
US data: Jobless claims increased to 1.9 million, supporting a recovery in gold prices.
🎯 2. Intraday Outlook
Leaning towards a sideways–to–slightly–bullish structure.
Strong selling pressure is still present at higher levels → monitor price reactions closely.
🟢 3. Potential SELL Zones
4080–4090
4105–4115
4150–4160
4205–4215
🔼 4. Potential BUY Zones
4040–4030
4000–3990
3975–3965
🔐 5. Notes
Suggested stop-loss: 10 dollars.
Only trade based on market reactions at key levels; avoid chasing price moves.

GOLD H1 – Trump’s Fed Comments Shake Market Sentiment🟡 XAUUSD – Intraday Smart Money Plan | by Ryan_TitanTrader (19/11)
📈 Market Context
Gold is trading in a tight corrective structure as markets react to breaking headlines that Donald Trump is considering removing Fed Chair Jerome Powell.
This news injects uncertainty into Fed policy expectations, causing short-term volatility in USD and positioning gold at a critical decision zone.
• Trump’s comments increase speculation about a potential policy shift, which may temporarily weaken USD sentiment.
• However, gold remains capped below the premium supply zone as institutional flows continue to engineer liquidity sweeps.
• Price is hovering near $4,080 ahead of key Fed-related discussions, keeping both sides of liquidity active.
Institutional order flow suggests controlled accumulation at the discount range while premium regions remain defended by sellers.
🔎 Technical Analysis (1H / SMC Structure)
• Structure: Price is forming a short-term distribution pattern after multiple BOS events from the 4150 breakdown.
• Premium Sell Zone: 4109–4111, aligning with unmitigated supply and internal liquidity pockets.
• Discount Buy Zone: 4009–4007, sitting inside a clean demand block + previous sell-side sweep.
• Liquidity:
→ Buy-side liquidity sits above 4111, where equal-high clusters form.
→ Sell-side liquidity rests between 4007–4000, where earlier long positions were cleared.
🔴 Sell Setup (Premium Reaction Zone)
• Entry: 4109 – 4111
• Stop-Loss: 4119
• Take-Profit:
→ 4055 (minor inefficiency)
→ 4028 (BOS retest)
→ 4009–4007 (discount demand)
📌 Execute only after a liquidity sweep into the zone + bearish CHOCH on M5–M15.
🟢 Buy Setup (Discount Reaction Zone)
• Entry: 4009 – 4007
• Stop-Loss: 4000
• Take-Profit:
→ 4040 (short-term range high)
→ 4075 (inefficiency rebound)
→ 4105/4110 (premium retest)
📌 Valid if price sweeps 4007 and shows bullish displacement.
⚠️ Risk Management Notes
• Expect volatility as traders react to Trump’s comments on Fed leadership.
• Avoid trading in the 4030–4080 chop zone without a clear structural break.
• Reduce position size during impulsive spikes around USD sentiment shifts.
• Trail stops once price clears each liquidity pocket.
📝 Summary
Gold is being influenced heavily by uncertainty around Trump’s remarks about replacing Fed Chair Powell. Liquidity is building at both extremes, offering clean opportunities at the edges of the range.
• Sell Zone: 4109–4111 (premium supply)
• Buy Zone: 4009–4007 (discount accumulation)
Expect a manipulation → reaction → continuation pattern as institutions play both sides of the current structure.
📍 Follow @Ryan_TitanTrader for more Smart Money updates.
🎁 Gifts in BIO for traders who follow daily plans.

Gold still in it's year-end range, good scalping opportunitiesThis year's high is in, the same forecast as last year if you watched with me this time last December.
We can expect that the new year candle will target the previous high quickly and swiftly as always, but until then we scalp this year-end wick range using LTF OB/FVGs for minimal pip TPs

Stop!Loss|Market View: SILVER🙌 Stop!Loss team welcomes you❗️
In this post, we're going to talk about the near-term outlook for SILVER ☝️
Potential trade setup:
🔔Entry level: 50.69205
💰TP: 47.22310
⛔️SL: 52.42652
"Market View" - a brief analysis of trading instruments, covering the most important aspects of the FOREX market.
👇 In the comments 👇 you can type the trading instrument you'd like to analyze, and we'll talk about it in our next posts.
💬 Description: Based on yesterday's metal price close, a slight rally in both silver and gold is expected today. Silver is expected to rally to 52 in order to liquidate sellers. The most reliable entry point will be a false breakout at 51.30625, which is expected soon. The downside target is seen at key support today—46.20000—while the medium-term outlook is near 40.
Thanks for your support 🚀
Profits for all ✅

Stop!Loss|Market View: GBPUSD🙌 Stop!Loss team welcomes you❗️
In this post, we're going to talk about the near-term outlook for the GBPUSD currency pair☝️
Potential trade setup:
🔔Entry level: 1.32300
💰TP: 1.30490
⛔️SL: 1.33190
"Market View" - a brief analysis of trading instruments, covering the most important aspects of the FOREX market.
👇 In the comments 👇 you can type the trading instrument you'd like to analyze, and we'll talk about it in our next posts.
💬 Description: The pound remains a selling priority, but potential manipulation remains near 1.31590. Therefore, a short-term upside move to 1.32000 - 1.32500 is likely, from where, under a more aggressive scenario, selling could be considered. Furthermore, a more medium-term downside target of 1.27000 - 1.28000 remains.
Thanks for your support 🚀
Profits for all ✅

XAUUSD – High-Impact Levels to Dominate the Day🌐 MARKET CONTEXT
Gold opens today in a compression phase after a high-volatility session yesterday, where both premium and discount liquidity pools were partially swept. Despite this, the market structure on M30 remains intraday bearish, with price continuously rejecting premium supply while building liquidity below.
Recent Drivers:
USD strengthened modestly following hawkish comments from Fed speakers
Market remains in “wait mode” ahead of upcoming PMI and inflation data
Safe-haven demand is neutral → no strong fundamental bias, giving technicals more influence
Sentiment Outlook:
London session: Liquidity grabs likely on both sides before directional movement
NY session: Expected expansion after liquidity sweep
Bias: Bearish intraday unless discount zones trigger a structure shift
Gold is currently trading in the middle of the intraday range, meaning entries must be placed at premium or deep-discount liquidity zones only.
📉 TECHNICAL ANALYSIS (SMC + LIQUIDITY)
Market Structure
Current structure: Lower High → Lower Low
M30 equilibrium → 4135–4140
Price hovering under potential inducement levels near 4170–4180
Multiple unmitigated OBs match today’s entries
Liquidity Map
Buy-side liquidity (BSL): above 4176
Mini BSL: above 4147
Sell-side liquidity (SSL): below 4116 and deeper at 3993
Clear liquidity pockets for engineered wicks and traps
Imbalance (FVG)
Bearish FVG at 4176–4178 → optimal sell zone
Small discount imbalance at 4116–4118 → scalp buy reaction zone
Deep imbalance around 3993–3995 → strong liquidity magnet for later sessions
🔑 KEY PRICE ZONES (With Captivating Explanations)
4178–4176 ▶️ Premium Supply – High Probability Sell Zone
Large premium imbalance + unmitigated bearish OB + BSL inducement above.
This is where institutions typically offload positions before pushing price lower.
4148–4147 ▶️ Scalp Sell Zone – Minor Liquidity Trap
Previous sweep zone with compressed liquidity.
Expect a quick reaction as price hunts micro-BSL then rejects.
4118–4116 ▶️ Discount Buy Zone – Scalping Reaction Point
Mitigation of bullish micro-OB + SSL liquidity resting below.
Perfect for small intraday bounces or CHoCH attempts.
3995–3993 ▶️ Deep Discount Buy Zone – High-Value Liquidity Pool
Major SSL cluster + higher timeframe discount region.
If price drops this low, expect aggressive reactions and potential intraday reversal.
⚙️ TRADE SETUPS
✅ SELL SETUP 1 – MAIN PREMIUM SUPPLY
Entry: 4178–4176
Stoploss: 4184
TP1: 4160
TP2: 4148
TP3: 4120
Logic: BSL sweep → imbalance fill → sharp rejection expected in London.
⚠️ SELL SETUP 2 – SCALPING PREMIUM REJECTION
Entry: 4148–4147
Stoploss: 4126 (Adjusted for safety as provided)
TP: 4137 – 4128 – 4120
Logic: Liquidity trap + inducement zone → ideal quick scalp.
✅ BUY SETUP 1 – SCALPING DISCOUNT DEMAND
Entry: 4118–4116
Stoploss: 4110
TP1: 4126
TP2: 4140
Logic: SSL sweep + micro CHoCH potential. Perfect scalp in NY open.
✅ BUY SETUP 2 – DEEP DISCOUNT REVERSAL
Entry: 3995–3993
Stoploss: 3987
TP1: 4010
TP2: 4040
TP3: 4110 (If strong reversal forms)
Logic: High probability liquidity reversal zone. Strong reaction expected.
🧠 NOTES / SESSION PLAN
Wait for M5/M15 confirmation before executing buys in discount zones
Avoid buying near premium zones; structure favors sell setups first
Expect stop-hunt wicks during London session
New York session likely provides the real expansion move
Avoid trading immediately after high-impact USD news
🏁 CONCLUSION
Gold remains in a bearish intraday structure on M30, with two premium sell zones (4178 and 4148) offering the best risk–reward setups.
Discount buy zones (4116 and 3993) provide high-quality countertrend reactions and potential reversals.
Trade only at extremes. Avoid mid-range noise.

Gold Holds $4000Gold has retraced lower from last week’s high, though it is holding above 4000 for now. Two bullish pinbars have also formed on the daily chart, hinting at a potential swing low. A break above yesterday’s high could see bulls target the 4200 handle, with a move through the 4250 high bringing the 4300 handle and monthly S1 into view.
However, keep in mind the weekly chart may be forming a Wave B within a broader ABC correction. I’ll also be watching for signs of a swing high on the daily chart and a potential resumption of the move lower from the record high. A 100% projection of Wave A from B implies a downside target near 3800.
Matt Simpson, Market Analyst at City Index.

XAU/USD – Price Tests Key Resistance ZoneXAU/USD – Price Tests Key Resistance Zone, Watching for Breakout or Rejection
Gold (XAU/USD) is approaching an important intraday resistance area on the H1 chart. After forming a short-term bullish structure with higher lows along the rising trendline, price is now retesting a supply zone that previously triggered strong selling pressure.
This is the decisive zone that will determine whether the market extends its recovery or resumes the broader downtrend. Traders should pay close attention to how price reacts here.
Technical Outlook
1. Market Structure
Price has formed a short-term uptrend on H1 but remains inside a larger bearish structure.
The current upward leg shows momentum but is approaching a major resistance cluster.
2. Key Resistance Zones
4088 – 4105: Immediate intraday resistance where price is currently testing.
4150 – 4170: The next strong supply zone, aligned with previous swing highs.
4210 – 4230: Deeper supply zone; only reachable if bulls break multiple levels.
These zones match the previous liquidity areas where sellers stepped in aggressively.
3. Key Support Zones
4040 – 4050: First support below current price; break below forms a bearish signal.
4000 – 4015: Major support; losing this zone opens room toward 3950.
3910 – 3930: Deeper support where buyers previously accumulated.
4. Trendline and EMA Confluence
Price is riding above the short-term ascending trendline.
A break of this trendline signals bearish momentum returning.
EMA cluster on H1 is still flat, confirming indecision.
5. RSI Momentum
RSI is approaching the upper range but not overbought yet.
This indicates potential continuation but also warns of weakening momentum near resistance.
Trading Scenarios
Scenario 1: Bullish Breakout
If price breaks and closes above 4105, the next upside targets become:
4150 - 4170 - 4210
This breakout would confirm that buyers are gaining strength.
Possible strategy (aggressive):
Buy the breakout once a clean H1 close above resistance forms.
Stops can be placed below 4080.
Targets: 4150 – 4170.
Scenario 2: Bearish Rejection
If price rejects the 4088 – 4105 zone and breaks the rising trendline:
Expect a move back toward 4040
Below that, further downside into 4000 – 4015
Possible strategy (conservative):
Wait for a rejection pattern (pin bar, engulfing) and a break below the trendline.
Stops above 4110.
Targets: 4040 then 4015.
Conclusion
Gold is now at a decisive resistance level.
The market can choose either a bullish continuation or a bearish retracement depending on whether the 4100 zone breaks or holds.
This is a high-probability zone for both sides, so traders should follow price action closely and wait for confirmation.
If you find this analysis helpful, remember to save this post and follow for more daily strategies.

Gold Extends Its Downward Pressure Amid Clouded MomentumHello everyone, I see gold still holding its downward pace after forming a top around 4,230–4,250 USD/oz, now hovering near 4,030 USD/oz — trading below the Ichimoku cloud and squeezed between several unfilled Fair Value Gaps, signalling that the market may be rebalancing liquidity before choosing a clearer direction. After the strong surge earlier this month, corrective pressure has returned, pushing price toward the short-term support zone at 4,000–3,980 USD/oz — an area that overlaps with previous green FVGs and where buying reactions typically appear. On the upside, 4,070–4,100 USD/oz has turned into a key resistance region where price has repeatedly attempted to break but failed. Only a decisive breakout above this zone would restore the short-term bullish structure; otherwise, losing 3,980 could open the door for further downside.
On the news front, gold continues to face weight from fading expectations of a Fed rate cut next month, a strengthening US dollar, and the return of risk-off sentiment, all of which leave the metal struggling for momentum. The probability of a 25-basis-point cut, according to CME FedWatch, has sharply fallen from 61.9% to 39.8%, while the likelihood of unchanged rates has climbed to 60.2%. This extends the pressure on gold — a non-yielding asset — while the dollar benefits more clearly. The prolonged government shutdown in the US has also delayed key inflation and labour reports for October, leaving the Fed with less evidence to support a firmer forward-guidance message. Meanwhile, Chair Powell’s cautious stance reinforces the view that higher rates will persist for longer, adding further strain to gold.
Based on both technical and macro factors, I feel this could be gold’s final corrective phase before the market finds equilibrium again. I expect price to ease toward 3,990–3,970 USD/oz to “test” liquidity — an area where demand historically returns. If buyers step in as before, gold could rebound toward 4,100–4,150 USD/oz, and once above 4,150, the next target expands toward 4,200–4,250 USD/oz.

The Calm Before the Expansion — Gold Pre-Setup MapGold rejecting the Asian Range low and showing early signs of reversal. Missed the London setup after oversleeping, but tonight I’m watching for a retrace back into the H1 FVG + lower HVN. That pocket sits just under 50% of yesterday’s Asian range and lines up with weekly volume sitting just outside of value. If price pulls back into that zone and shows displacement, I’m looking for continuation to the upside and potential expansion toward the H4 FVG above. Premature breakouts tonight may be traps.

Gold XAUUSD at Key Support: Watching for a Retrace & BreakoutGold has recently traded down into a major support zone, a level that has historically attracted strong buying interest. 🪙📉➡️📈
If this support continues to hold and bullish momentum resumes, I’ll be monitoring the 30-minute timeframe for a clean pullback into discount pricing. From there, a decisive break in market structure would provide a high-probability opportunity to position long with the trend. 🔍⏳✨
As always, confirmation is key — chasing early entries in consolidation zones can expose traders to unnecessary risk.
🛑 Disclaimer: This is not financial advice. Educational purposes only.

Silver bees: level to accumulate on 18 nov Silver gave a strong rally during oct 2025, after that corrected for 30%, from there again shown a bull run for 20%.
Now I assume silver bees are good to be added below 150 for 158, and if that is broken then towards 168.
Considering the strong demand for silver across the world, it is unlikely to go below 138, which was its recent low.
#silver

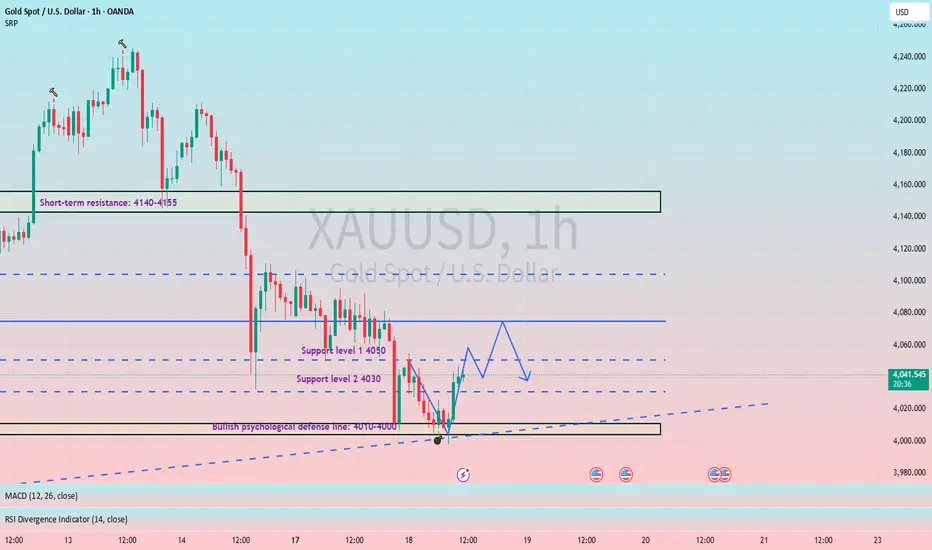
A rebound after hitting bottom is bound to face pressure again.#XAUUSD OANDA:XAUUSD TVC:GOLD
Gold rebounded after falling to around 3997, forming a V-shaped pattern and has now largely recovered its Asian session losses. However, judging from the timeline, the mid-term correction is not yet completely over. During the NY session, we should continue to pay attention to the 4000-3980 range. Only a break below this level can open up further downside potential. Similarly, as I mentioned before, the market is expected to remain volatile before the data release, so the short-term upside resistance level to watch is 4055-4060, and the key resistance level is 4080-4090. If gold prices first touch 4055-4060 and encounter resistance during the NY session, consider shorting gold with a small position.
GBPUSD Buy Strategy: From Safe Zone to the TopGuys,
I have prepared a GBPUSD analysis for you.
📌 When GBPUSD reaches the 1.31642 - 1.31495 zone, I will open a buy position, aiming for the 1.37937 level as my target.
My friends, I share these analyses thanks to each like I receive from you. I sincerely thank all of you who support me with your appreciation.

Gold remains bearish.Gold traded sideways yesterday before breaking out of a converging triangle pattern and falling to a low of around 4006, marking its third consecutive day of decline on the daily chart. In the short term, the 4090 level has become effective resistance. While the highs are consistently lower, the market isn't extremely weak; each rebound has its strength but is quickly suppressed and falls again. Continue to wait for a rebound before selling today!
Although there was a technical rebound after yesterday's sharp drop, its strength was limited. As long as the key resistance level of $4100 cannot be broken, any upward movement is a selling opportunity. In the short term, pay attention to whether the 4000 support level can hold. My view remains unchanged: the resistance after a rebound is in the $4100-$4090 range; look for selling opportunities within this range.
Key Levels:
First Support: 4020, Second Support: 4006, Third Support: 3995
First Resistance: 4055, Second Resistance: 4073, Third Resistance: 4090
Gold Intraday Trading Strategy:
Buy: 4000-4005, SL: 3990, TP: 4025-4035;
Sell: 4080-4085, SL: 4095, TP: 4060-4050;
More Analysis →

Gold 30-Min — Volume Sell Reversal Triggered⚡Base : Hanzo Trading Alpha Algorithm
The algorithm calculates volatility displacement vs liquidity recovery, identifying where probability meets imbalance.
It trades only where precision, volume, and manipulation intersect —only logic.
✈️ Technical Reasons
/ Direction — SHORT / Reversal 4045 Area
☄️Bearish rejection confirmed through sharp candle body.
☄️Lower-high forming beneath resistance supply region.
☄️Volume decreasing confirms exhaustion in price rally.
☄️Sellers regained imbalance with heavy top rejection.
☄️Algorithm detects fading demand and shift to control.
⚙️ Hanzo Alpha Trading Protocol
The Alpha Candle defines the day’s real control zone — the first battle of momentum.
From this origin, the Volume Window reveals where the next precision strike begins.
⚙️ Hanzo Volume Window / Map
Window tracked from 10:30 — mapping true market behavior.
POC alignment exposes institutional bias and breakout potential zones.
⚙️ Hanzo Delta Window / Pulse
Delta window monitors real buying vs. selling power behind each move.
Tracks volume aggression to expose who controls the candle — buyers or sellers.
When Delta aligns with Volume Map, momentum becomes undeniable.

EUR/USD | Euro Preparing for a Bearish Reversal Zone! (READ)By analyzing the EURUSD chart on the 6H timeframe, we can see the price trading around 1.1590. I expect a small push upward first, followed by a potential rejection from the 1.16085–1.1640 zone. If we get a strong rejection there, a powerful bearish move could follow.
This bearish scenario only fails if the price breaks above 1.1660.
Please support me with your likes and comments to motivate me to share more analysis with you and share your opinion about the possible trend of this chart with me !
Best Regards , Arman Shaban

GOLD(xauusd): Structure Breaks Suggest Deeper Correction AheadHi!
Gold has shown clear signs of weakening after failing to sustain its push toward the recent highs. The market engulfed the last major low before the top, signaling a structural shift, and has already broken below the secondary ascending trendline. This confirms that bullish momentum is fading.
Price is currently retesting the first demand zone, but if buyers fail to hold this level, the chart suggests a potential continuation to the downside. The key level to watch is the horizontal support around $4,000. A clean break below this zone would likely open the door for a deeper move toward the major demand area highlighted around $3,560 – $3,520.
As long as Gold remains below the broken structure and fails to reclaim the upper zone, the broader bias leans bearish, with lower highs forming and liquidity sitting below.
Disclaimer: As part of ThinkMarkets’ Influencer Program, I am sponsored to share and publish their charts in my analysis.

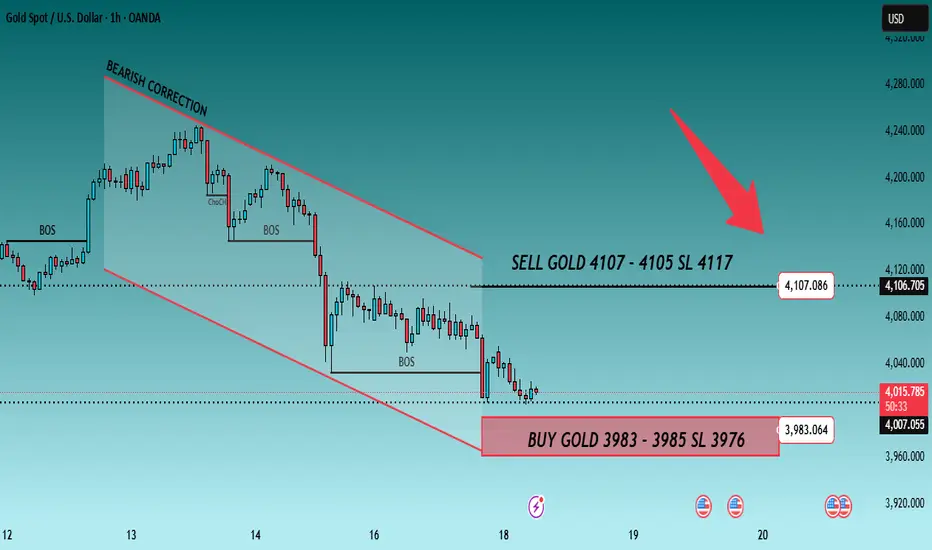
GOLD H1 – Hawkish Fed Pressure Ahead of Key NFP Data🟡 XAUUSD – Intraday Smart Money Plan | by Ryan_TitanTrader (18/11)
📈 Market Context
Gold is trading inside a bearish corrective channel as markets react to hawkish Federal Reserve commentary and positioning ahead of this week’s U.S. NFP data.
• Fed officials signaled a stronger stance against premature rate cuts, keeping USD supported and limiting gold’s upside.
• Price continues to hover near $4,080, reflecting uncertainty as traders balance Fed tone with upcoming labor-market reports.
Institutional order flow shows controlled downside pressure, with engineered liquidity sweeps forming around both channel extremes.
🔎 Technical Analysis (1H / SMC Structure)
• Structure: Price remains inside a Bearish Correction Channel, creating consecutive BOS points, confirming distribution.
• Premium Sell Zone: 4107–4105 aligns with a previous mitigation block + internal liquidity.
• Discount Buy Zone: 3983–3985 sits at the lower boundary of the channel + liquidity sweep zone.
• Liquidity:
→ Buy-side liquidity above 4107 (clean equal-high pocket).
→ Sell-side liquidity resting around 3985–3976, where prior long positions were removed.
🔴 Sell Setup (Premium Reaction Zone)
• Entry: 4,107 – 4,105
• Stop-Loss: 4,117
• Take-Profit Targets:
→ 4,060 (minor imbalance fill)
→ 4,030 (BOS retest)
→ 3,985 (discount zone)
📌 Execute only after a liquidity sweep into the zone + bearish BOS on M5–M15.
🟢 Buy Setup (Discount Reaction Zone)
• Entry: 3,983 – 3,985
• Stop-Loss: 3,976
• Take-Profit Targets:
→ 4,030 (short-term structure high)
→ 4,060 (inefficiency midpoint)
→ 4,105 (premium retest)
📌 Valid if price taps channel low + shows bullish displacement.
⚠️ Risk Management Notes
• Expect volatility as markets digest hawkish Fed remarks before NFP.
• Avoid entering trades inside the 4020–4070 chop region without clear BOS.
• Reduce position size during news hours.
• Trail stops once price clears each liquidity pocket.
📝 Summary
Gold remains pressured by Fed rhetoric, but liquidity is building at both extremes.
• Sell Zone: 4107–4105 (premium mitigation area)
• Buy Zone: 3983–3985 (discount liquidity sweep)
Price is likely to form a manipulation → reaction → continuation pattern within the channel.
📍 Follow @Ryan_TitanTrader for more Smart Money updates ⚡
🎁 More insights & gifts on my TradingView profile.