Gold/Oil Signaling Market Is In A Super Bubble Gold = Fear
Oil = how strong the economy is.
Except for COVID we have never seen such an extreme reading. Yet people are buying up stocks like we will never again be able to produce another stock again as long as we live!
Tulips!
Here are just a few of the factors to consider that make this indicator important.
Why This Indicator Matters: Key Factors at a Glance
Gold’s Surge Signals a Shift
Gold has soared nearly 60% year-to-date, adding a staggering $10 trillion in market capitalization. This rally effectively erases all the stock market gains made since May 2021, including those driven by AI enthusiasm and speculative tech runs.
USD Can Only Be Measured Against Gold
As the world’s reserve currency, the U.S. dollar’s real value is best gauged in terms of gold. This is a critical point—because when gold rises this dramatically, it reflects monetary inflation. A large part of the stock market rally has been driven by an expanding money supply, not true value creation.
Curiously, this inflation hasn’t shown up in oil prices, which have collapsed, despite geopolitical risks. More on that below.
The Dollar’s Worst Year in Decades
2025 marks one of the most significant declines for the U.S. dollar in recent history. Its role as the world reserve currency (WRC) has diminished—from 85% in the 1970s to just 50% today. Trade wars and tariffs are only accelerating this trend.
Monetary Inflation Drives Stock Prices
Stock markets are being lifted by monetary inflation, not organic growth. Stocks can be created endlessly—unlike gold. That makes gold a true inflation benchmark. The stock market’s rise is, in large part, a mirage, reflecting debased currency, not real productivity.
Oil Isn’t Behaving as Expected—Why?
Typically, when the dollar weakens, oil prices rise—because more dollars are needed to buy the same barrel of oil. But right now, oil prices are soft. Why?
Global demand is weak, outpaced by supply. Even the Russia-Ukraine war hasn’t changed that dynamic. In fact, Russia is now importing gasoline, as Ukrainian forces continue to target and disable refining capacity.
Here’s why this matters: when oil wells are opened, they can't just be turned off. If the refiners are destroyed and the oil has nowhere to go—it’s wasted. That’s a strategic win for Ukraine.
The Disconnect Between Stock Prices and Profits
While inflation has pushed stock prices higher, it hasn’t translated into equivalent profit growth.
Example: If a stock goes from $10 to $20 due to inflation, you'd expect earnings to go from $1 to $2 to maintain the same P/E ratio. Instead, the earnings yield is just 3.2%—a historical low. That’s a major red flag.
As pilots would say: WTF, over?
Here’s the likely explanation:
The money hasn’t reached consumers—it's concentrated in the hands of wealthy savers and leveraged investors, who are buying more stocks to sell to the next buyer willing to lever up even more. It’s a classic feedback loop—and a superbubble reminiscent of the tulip mania era.
The Smart Money Knows What's Coming
As this imbalance grows more obvious, central banks and institutional investors are quietly increasing their gold holdings—well above the pace of supply growth.
So when Gold/Oil (two important commodities) completely disconnect like this, and Gold explodes up like this, you'd better take notice!
Lastly, it takes 100 ounces to buy a new home. Last time this occurred was in 1978 ish, 2011, and now!
Debt to GDP in 76 was 33%, 2011 was 99% and today 126% It is not the same animal as the past.
GTFO & STFO! No matter where the prices for stocks go!
CAUTION!!!
Metals

SILVER (XAGUSD) – 15M | Strong Support Holding, Bullish ContinuTVC:SILVER
Market Overview
Silver took a quick rejection from the 48.70 resistance zone and corrected downward into the major support.
Price is now consolidating around 47.50, a key level that previously sparked bullish impulses.
If this level holds, momentum may shift again toward the upper range — signaling a potential bullish continuation phase.
Key Scenarios
✅ Bullish Case 🚀 →
🎯 Target 1: 47.80
🎯 Target 2: 48.23
🎯 Target 3: 48.70 (resistance retest)
❌ Bearish Case 📉 →
Invalidation if price closes below 47.30 (support breakdown).
Current Levels to Watch
Resistance 🔴: 48.23 / 48.70
Support 🟢: 47.40 / 47.50
⚠️ Disclaimer: This analysis is for educational purposes only. Not financial advice.

Gold Price Rally Sustains – Market Eyes Next Breakout PointGold (XAUUSD) continues to follow a strong bullish trajectory, confirming consistent market confidence and institutional participation. The chart structure reveals clear liquidity shifts and a steady series of bullish break-of-structure (BOS) points, suggesting that buyers remain in firm control. After a brief consolidation phase, gold resumed upward momentum, supported by sustained volume and steady market sentiment.
The current trend indicates controlled buying pressure rather than speculative spikes, showing the market’s preference for stability as price builds toward higher levels. If momentum maintains its present pace, gold could extend gains in the short term while maintaining its established bullish rhythm across the higher timeframe outlook.

4050-4030 oscillation, bullish trend remains the main trendGold is currently still in a bullish upward trend. Our core trading strategy remains unchanged, and the key points I reminded you of earlier this morning must be carefully considered. Judging from the trend, gold in the US market is basically oscillating back and forth in the range of 4050-4030. I mentioned before that gold has repeatedly tested 4030. Once it falls below, gold may test the support range of 4020-4010 below in the US market. This has been marked in the chart. I believe brothers can see it very clearly. At the same time, we should still take precautions on the upside. As time goes by, we can pay moderate attention to the short-term channel pressure around 4065. Once gold stabilizes above 4050, it will definitely touch around 4065. On the downside, we continue to monitor a break of 4030. If, while waiting for gold to fall back to the support range, it first rises and hits the channel resistance, you can retest gold shorts based on market trends. If you have any questions, you can leave me a message for help. If you think Allen's analysis is helpful to you, you can give it some encouragement by clicking the like button.

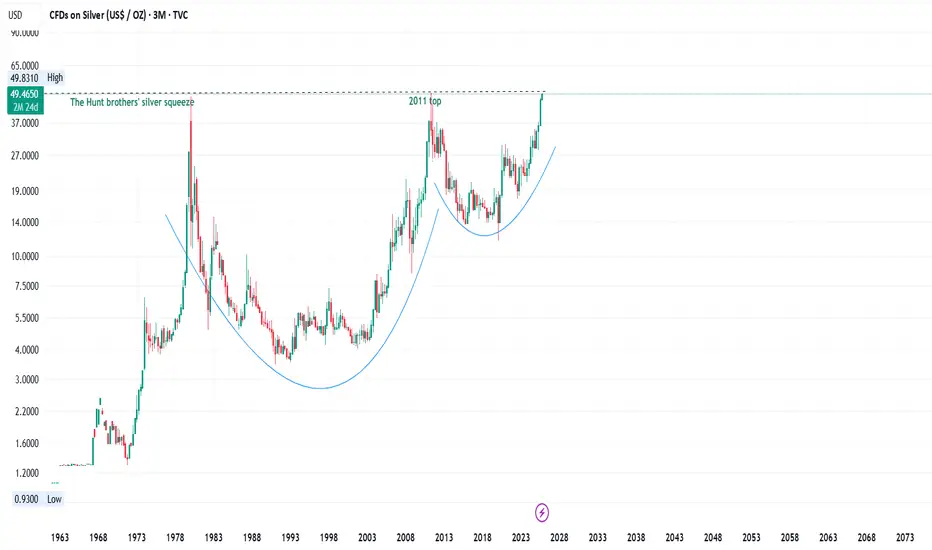
SilverThe Hunt brothers' silver squeeze was an attempt by brothers Nelson Bunker and William Herbert Hunt to corner the silver market in the late 1970s and early 1980s by accumulating massive amounts of physical and paper silver, driving prices to nearly $50 per ounce. This attempt backfired when the COMEX, in response to market chaos and margin calls, implemented rule changes that triggered a market collapse, an event known as Silver Thursday, leading to the Hunts' financial ruin but a systemic crisis averted by a bailout
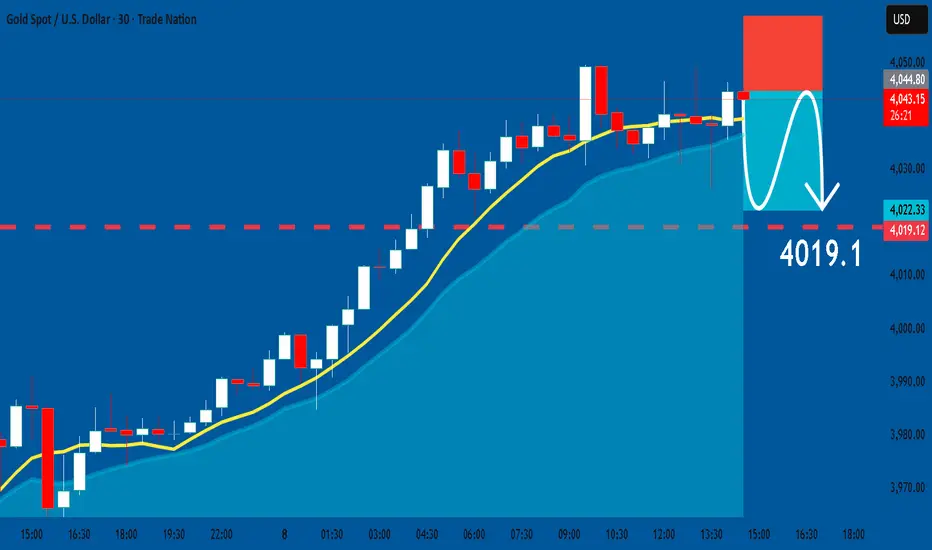
GOLD: Short Trade with Entry/SL/TP
GOLD
- Classic bearish formation
- Our team expects pullback
SUGGESTED TRADE:
Swing Trade
Short GOLD
Entry - 4045.1
Sl - 4058.9
Tp - 4019.1
Our Risk - 1%
Start protection of your profits from lower levels
Disclosure: I am part of Trade Nation's Influencer program and receive a monthly fee for using their TradingView charts in my analysis.
❤️ Please, support our work with like & comment! ❤️
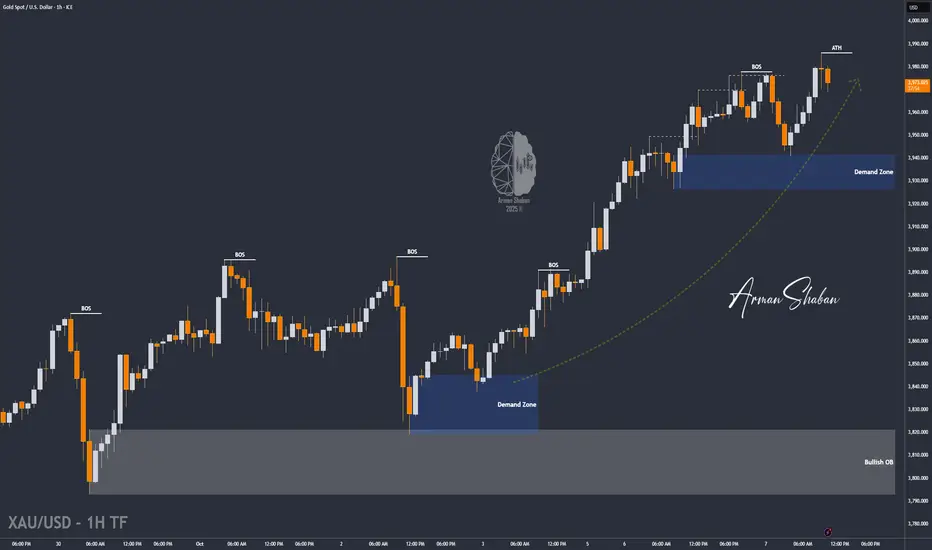
XAU/USD | Gold Nears $4000 as Goldman Sachs Target $4900 by 2026By analyzing the Gold (XAUUSD) chart on the 1-hour timeframe, we can see that the price continued its strong bullish momentum today and reached $3985.66, marking a new all-time high (ATH)! Gold is now just a step away from the $4000 milestone.
Interestingly, Goldman Sachs has raised its gold price forecast to $4900 by December 2026, which seems realistic given the current bullish trend and the possibility of further interest rate cuts.
The key demand zones are $3943–$3956 and $3898–$3910. So far, there’s no sign of structural weakness in the chart, meaning a major correction isn’t confirmed yet.
This analysis will be updated soon!
Please support me with your likes and comments to motivate me to share more analysis with you and share your opinion about the possible trend of this chart with me !
Best Regards , Arman Shaban
GOLD (XAUUSD): The Next Psychological Resistances
Gold successfully reached 4000 psychological resistance and broke through that.
Here are the next potentially significant structures:
Resistance 1: 4048 - 4052 area
Resistance 2: 4098 - 4102 area
For now the price is testing 4050 psychological resistance.
Its breakout will push the prices to Resistance 2.
❤️Please, support my work with like, thank you!❤️
I am part of Trade Nation's Influencer program and receive a monthly fee for using their TradingView charts in my analysis.

GOLD: The Market Is Looking Up! Long!
My dear friends,
Today we will analyse GOLD together☺️
The market is at an inflection zone and price has now reached an area around 4,030.40 where previous reversals or breakouts have occurred.And a price reaction that we are seeing on multiple timeframes here could signal the next move up so we can enter on confirmation, and target the next key level of 4,056.64.Stop-loss is recommended beyond the inflection zone.
❤️Sending you lots of Love and Hugs❤️

Gold ATH – Uncle Jimmy, Silver Momentum & The Market Signal🏆📈 Gold ATH – Uncle Jimmy, Silver Momentum & The Market Signal 🧠🪙
Welcome to Episode 2 of “When Gold Believers Flip.”
Gold has officially broken to all-time highs , and Uncle Jimmy’s quiet rotation into silver suddenly looks like genius…
🟡 GOLD (XAUUSD)
Gold just printed a fresh all-time high at $4,068 🔥
Technically, I still hold a long-term target at $4,489, but the market is overextended.
📉 Game plan:
I’ll only consider shorting below $3,983.
🎯 Short setup:
• Entry: Below $3,983
• Stop-loss: $4,015
Until that trigger hits, bulls remain in control — but risk is rising.
⚪ SILVER (XAGUSD)
Now here’s where it gets juicy.
Remember Uncle Jimmy — the 30-year gold maxi?
This summer, he shocked everyone:
“I’m selling gold to buy silver.” 💬🪙
Guess what? He might’ve nailed it.
Silver is now trading at $48.97, just shy of historical resistance:
🏆 $49.83 (Jan 18, 1980)
✴️ $49.51 (Apr 25, 2011)
🎯 Target: $50.03
But this move is more than a breakout — it’s a sentiment shift.
🧠 The Macro Signal
Yesterday:
🟡 Gold ↑, Silver ↓ = Defensive positioning → not great for markets.
Today:
⚪ Silver ↑, Gold ↓ = Risk appetite returning → bullish tone across assets.
That’s a tailwind for:
• Nasdaq
• Bitcoin
• Broad markets
Silver is part money, part industrial metal — when it leads, optimism rises.
🔁 The Rotation Is Real
📉 Gold looks tired (recent action says not; but my analysis says it is)
🪙 Silver is shining
₿ Bitcoin is waiting
📊 Nasdaq is leading
When hard-money believers like Uncle Jimmy flip...
Pay attention.
Watch the metals.
Watch the sentiment.
This is how macro mood shifts begin.
Mindset Check 🧘
When veterans change conviction, it’s rarely random. Markets evolve — the smartest adapt. Don’t cling to narratives; flow with signals.
One Love,
The FXPROFESSOR 💙
Disclaimer: These charts and analyses reflect my personal opinion only. I am not a financial advisor. Nothing here is financial advice. Trading involves risk, and you are fully responsible for your own decisions. Trade wisely.

SILVER: Bears Are Winning! Short!
My dear friends,
Today we will analyse SILVER together☺️
The price is near a wide key level
and the pair is approaching a significant decision level of 49.015 Therefore, a strong bearish reaction here could determine the next move down.We will watch for a confirmation candle, and then target the next key level of 48.691.Recommend Stop-loss is beyond the current level.
❤️Sending you lots of Love and Hugs❤️

XAUUSD: October 6 Market Analysis and StrategyGold Technical Analysis
Weekly chart resistance: 4000, support: 3683.
Daily chart resistance: 3950, support: 3819.
Four-hour chart resistance: 3950, support: 3879.
One-hour chart resistance: 3950, support: 3919.
Gold continues its upward trend. This seemingly sudden surge is actually the inevitable result of the combined forces of monetary policy expectations, political risks, and geopolitical conflicts. Gold, as a safe-haven asset, is attracting investors.
Gold Trading Recommendations: Based on the four-hour chart, focus on the effective support levels below, which remain at 3919-3879. Focus on the 3950 level for upward pressure. If the 3919 support fails, the maximum retracement limit is around 3879. In terms of trading, wait for a pullback before looking for support levels to buy.
BUY: 3919near
BUY: 3879near

My TOP10 picks list in (Silver & Gold) Mining companies 5/10Silver Dollar Resources Inc are a silver focused junior, project generator with four exploration properties in Canada and Mexico. They have approximately 50Moz. of silver in the reserves.
They have a market capitalisation of 10 million USD, which is a steal !
Recently (as of march 2024) the silver in the ground was valued at below 10 cents per Ounce !
That was the time when the price broke out of the broadening descending channel after 4 years of painful downward spiral ! Since then the price has been sitting on the support of the descending downward trend line (previous resistance that now acts as support).
It has been sitting there for about 4 months. Yesterday the price shot up about 35% showing that interest for the sector is coming back after Silver has cleared the important 30$ mark.
There is no need to hurry in this stock, since it will probably digest yesterdays strong move in the following days.
Not financial advice but I will probably double my position soon.

XAU/USD Intraday Analysis – October 8, 2025Gold is currently trading around 4,036 USD, maintaining a strong bullish trend after breaking out of the previous ascending channel. The H1 chart shows clear momentum with higher highs and higher lows, indicating buyer dominance. A minor pullback is expected before the continuation of the uptrend.
Technical Highlights:
Current Price: 4,036 USD
Recent High: 4,049 USD
Recent Low: 4,033 USD
Support Levels:
S1: 4,020 – 4,025 USD (short-term pullback zone)
S2: 3,980 – 3,990 USD (former channel resistance turned support)
S3: 3,940 – 3,950 USD (major intraday support)
Resistance Levels:
R1: 4,060 – 4,065 USD (next intraday target)
R2: 4,100 USD (psychological barrier)
R3: 4,120 USD (projection based on recent momentum)
Indicators & Patterns:
Price has broken above the previous ascending channel, signaling strong bullish momentum.
A minor retracement towards 4,020 – 4,025 could provide a high-probability buying opportunity.
EMA cluster below the current price supports the bullish trend.
RSI indicates slight overbought conditions, suggesting a temporary pullback is possible before continuation.
Trading Strategy:
Aggressive Buy: On minor pullback to 4,020 – 4,025 USD
Stop Loss: 4,010 USD
Take Profit 1: 4,060 USD
Take Profit 2: 4,085 USD
Take Profit 3: 4,120 USD
Conservative Buy: Wait for confirmation of support hold at 4,025 USD
Stop Loss: 4,015 USD
Take Profit: 4,085 – 4,100 USD
Summary:
Gold remains in a bullish trend on H1, with a potential continuation towards 4,100 – 4,120 USD after a short-term retracement. Traders should monitor the 4,020 – 4,025 support zone for high-probability entries and use proper risk management.
Remember: Always confirm momentum with price action and key support before entering new trades. Save this analysis if you find it helpful and follow for further intraday strategies.

GOLD Will Go Higher From Support! Buy!
Please, check our technical outlook for GOLD.
Time Frame: 1h
Current Trend: Bullish
Sentiment: Oversold (based on 7-period RSI)
Forecast: Bullish
The market is trading around a solid horizontal structure 3,958.06.
The above observations make me that the market will inevitably achieve 4,000.95 level.
P.S
Overbought describes a period of time where there has been a significant and consistent upward move in price over a period of time without much pullback.
Like and subscribe and comment my ideas if you enjoy them!

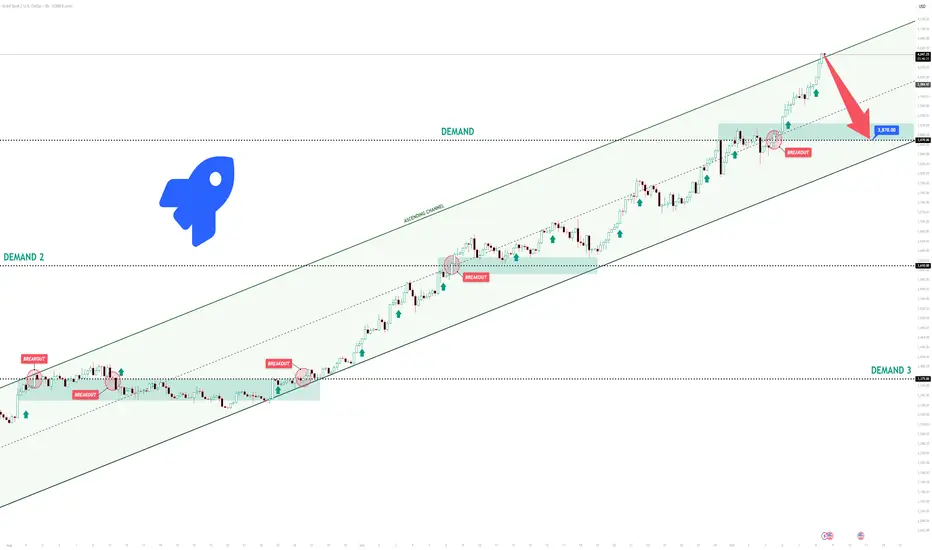
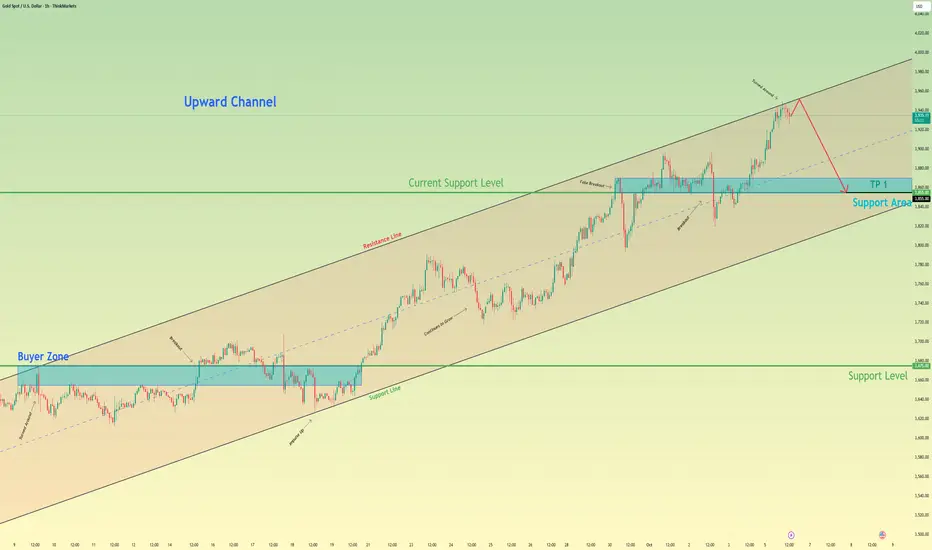
XAUUSD Short: Targeting 3870 on a Corrective MoveHello, traders! The price auction for XAUUSD has been moving within a clearly defined ascending channel, reflecting a persistent and well-structured bullish trend. This pattern has effectively guided the market upward, with buyers maintaining firm control and driving the price through several significant resistance levels, including 3375 and 3610. Such momentum highlights the continued dominance of bullish sentiment in recent sessions.
At the moment, the price is approaching a critical inflection point near the upper boundary of this channel. Following an aggressive rally, XAUUSD is now testing the channel’s ascending supply line, an area that often acts as a strong resistance zone. This is typically where selling pressure begins to surface, as traders look to capitalize on overextended bullish moves.
My short-term expectation is a corrective phase. I anticipate that the price may attempt a brief breakout above the channel’s resistance, forming a potential “fake breakout” trap for late buyers, before reversing lower. A confirmed rejection from this region would likely trigger a pullback toward the 3870 area, which aligns with prior structural support. Accordingly, I have placed my take-profit target at 3870. Manage your risk!
Gold can Start a Correction Towards 3855 SupportHello traders, I want share with you my opinion about Gold. The broader market context for Gold has been decidedly bullish since the price reversed and broke out from a prior descending channel. This structural shift established a new uptrend, which has since been neatly contained within a well-defined ascending channel. The price action for XAU has been creating a clear sequence of higher highs and higher lows. Currently, the asset is trading very close to the resistance line of this ascending channel, an area where sellers may re-emerge. My strategy is based on the expectation that the price will reach this line, be rejected, and then begin a corrective decline. I think after such a strong run, a pullback is a probable scenario. A confirmed reversal from this upper boundary would validate the short idea. Therefore, I have placed my TP at the 3855 current support level. Please share this idea with your friends and click Boost 🚀
Disclaimer: As part of ThinkMarkets’ Influencer Program, I am sponsored to share and publish their charts in my analysis.
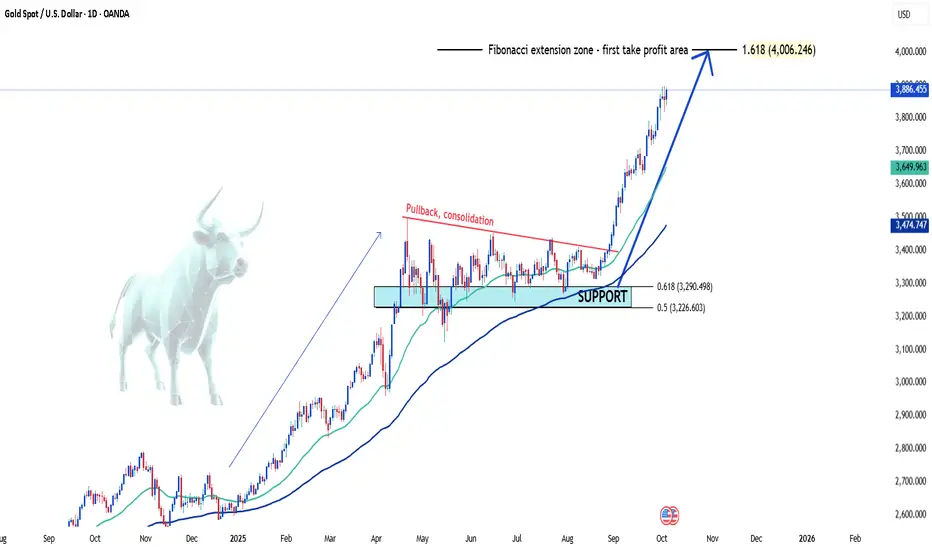
XAUUSD Continues on Its Path to Conquer Record-High Levels👋Hello everyone, what are your thoughts on the trend of OANDA:XAUUSD ?
Today, I'll provide a long-term perspective. XAUUSD has recently surged, driven by global instability, particularly the Fed's rate cuts. The risk of a U.S. government shutdown has also led investors to turn to gold as a safe haven, contributing to the significant price increase.
From a technical standpoint, gold is showing a strong bullish structure over the long term, with a clear breakout above key resistance levels. After consolidating around the Fibonacci 0.5 retracement support zone, the price has rebounded and is now heading towards the Fibonacci extension zone. This area is considered the first major take-profit target, also coinciding with the psychological level at $4,000 ( a common target for 2025 ).
With both market structure and fundamental analysis supporting the bullish outlook, I remain optimistic about both the short and long-term prospects for XAUUSD. What do you think about the XAUUSD trend? Feel free to leave your thoughts in the comments!
Has Gold Reached Its Fullest Potential?Has gold reached its fullest potential? It depends on the US dollar.
As we can see when dollar declines, gold went up.
i) From 2001 to 2011, when dollar was down, gold went up.
ii) From 2017 to 2020, when dollar was down, gold went up.
iii) And from 2022 to current, when dollar is down, gold is up.
With de-dollarization, this also means gold may have more upside potential.
Mirco Gold Futures and Options
Ticker: MGC
Minimum fluctuation:
0.10 per troy ounce = $1.00
Disclaimer:
• What presented here is not a recommendation, please consult your licensed broker.
• Our mission is to create lateral thinking skills for every investor and trader, knowing when to take a calculated risk with market uncertainty and a bolder risk when opportunity arises.
CME Real-time Market Data help identify trading set-ups in real-time and express my market views. If you have futures in your trading portfolio, you can check out on CME Group data plans available that suit your trading needs www.tradingview.com

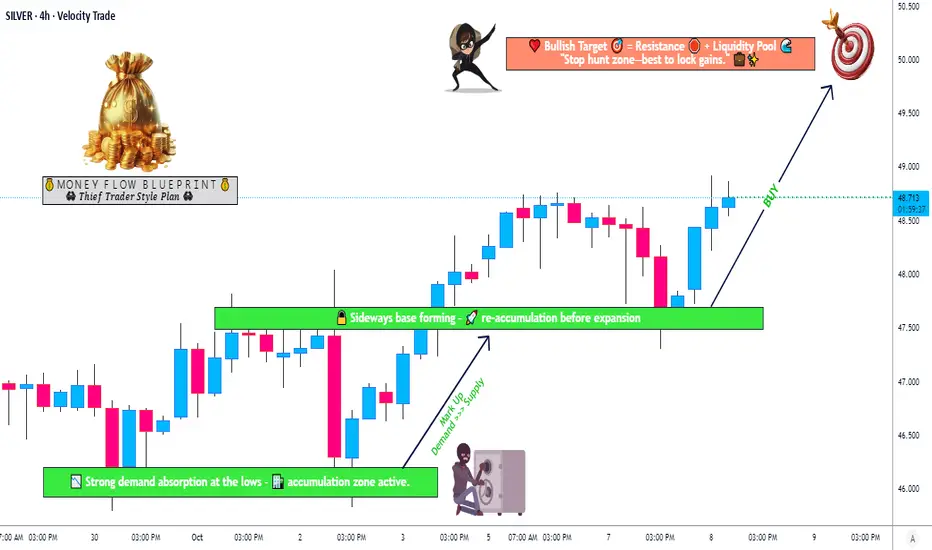
Silver Price Action Update – Smart Money Reaccumulation PhaseXAG/USD "SILVER vs U.S. DOLLAR" — Metal Market Cash Flow Management Strategy 💰
Thief Strategy | Layered Entry | Swing / Day Trade Plan
🧭 Plan Overview
The Bullish momentum in Silver (XAG/USD) has been confirmed through accumulation and re-accumulation phases, signaling a potential continuation move upward.
Smart money appears to be building positions below major resistance — time for us to follow the metal flow. ⚙️
💎 Entry Plan — Thief Layer Style
Thief Strategy = Layered Limit Entries 🧠
We use multiple limit orders to build a smarter position gradually — instead of chasing the price.
Entry Layers:
47.500
48.000
48.500
(You can add more layers based on your own plan and risk appetite.)
🛑 Stop Loss (SL)
This is the Thief SL @47.000.
However, dear Ladies & Gentlemen (Thief OGs) — please manage your own risk.
It’s your money, your strategy, and your exit. 💼
“Make money → Take money → Protect money.”
🎯 Target Zone
A strong resistance zone + overbought conditions may create a trap at the highs.
So, when Silver reaches around $50.000, be smart and secure your profits before the metal traps the late buyers.
Remember: we steal profits, not dreams. 🕶️
💬 Note from the Thief OG
This is a Thief-style strategy — meant for educational fun and insight sharing.
Not a signal service or financial advice.
Use your own judgment and always plan your risk ahead of your entries.
Let’s manage our cash flow, not our emotions. ⚖️
🌍 Related Pairs to Watch (Correlation Check)
OANDA:XAUUSD (Gold) → Often moves in sync with Silver; watch for Gold strength confirmation.
💵 TVC:DXY (U.S. Dollar Index) → Inverse correlation; a weaker USD supports Silver upside.
💰 OANDA:AUDUSD & OANDA:NZDUSD → Commodity-linked currencies; bullish moves support Silver’s strength.
OANDA:XCUUSD → Industrial metals correlation; when Copper rallies, Silver often follows.
Keep your eyes on these pairs — they reveal how liquidity shifts across the metals and forex markets.
✨ “If you find value in my analysis, a 👍 and 🚀 boost is much appreciated — it helps me share more setups with the community!”
⚠️ Disclaimer:
This is a Thief-style trading strategy — shared just for fun and educational purposes.
Always do your own research and trade responsibly. 🧩
#XAGUSD #SilverAnalysis #MetalsMarket #SwingTrade #DayTrading #TechnicalAnalysis #ThiefStrategy #LayeredEntry #CommodityTrading #SmartMoney #BullishSetup #TradingViewCommunity #MarketFlow #TradeResponsibly
Gold will retraceThe last move of Gold hasn't made a good base, and 3600 is the price it may find that base to retrace and retest.

XAUUSD NEXT POSSIBLE MOVE Gold is currently testing a strong support zone where buyers have previously shown strong reactions. If the price continues to respect this level, a bullish push can be expected.
Market sentiment remains positive above support, indicating potential upside if buyers hold their ground.

The rise in gold is still continuing.Wave -(i) of (E) is forming, and the target of 3900-4050 remains valid, and it could even go higher than this price. After the completion of wave -(i) of (E), there is a possibility of a corrective period in both time and price. A time-based corrective period is more likely.
Good luck
NEoWave Chart
