Can Silver Extend Its Rally Into 2026? - Watch This Week's CloseCan silver extend its rally into 2026? How should investors manage the increase in volatility as silver margins rise?
As long as the US dollar remains in a downtrend, precious metals are likely to continue their bullish trend.
Mirco Silver Futures
Ticker: SIL
Minimum fluctuation:
0.005 per troy ounce = $5.00
Disclaimer:
• What presented here is not a recommendation, please consult your licensed broker.
• Our mission is to create lateral thinking skills for every investor and trader, knowing when to take a calculated risk with market uncertainty and a bolder risk when opportunity arises.
CME Real-time Market Data help identify trading set-ups in real-time and express my market views. If you have futures in your trading portfolio, you can check out on CME Group data plans available that suit your trading needs www.tradingview.com
Microfutures

FX 2025 RecapThe price action in FX futures throughout 2025 was defined by a historic retreat of the U.S. dollar, which saw its "grip slip" as the U.S. Dollar Index fell by approximately 9% over the year. The primary driver was a dramatic shift in Federal Reserve policy; after holding rates steady for much of the year, the Fed Pivot in September, triggered by a softening labor market and the "One Big Beautiful Bill," resulted in a series of rate cuts that brought the fed funds rate down to 4.25% by December. This dollar weakness provided a massive tailwind for major G10 futures, with the Swedish Krona emerging as the top performer with a 20% gain, while the Euro and Swiss Franc both surged roughly 14% against the greenback in the first half of the year alone.
Volatility reached "monstrous" levels in the second quarter due to the "Liberation Day" tariffs announced on April 2. This event triggered a massive risk-off stampede, causing the Cboe
Volatility Index to witness its largest-ever one-day spike and sending daily global FX turnover to a record $9.6 trillion. While the dollar initially spiked on safe-haven demand, the subsequent "Trump trade" exhaustion and concerns over fiscal sustainability during the longest U.S. government shutdown in history cemented the bearish trend. In contrast, the Japanese Yen futures experienced significant whipsaws as the Bank of Japan diverged from its peers by raising rates to 0.5%, creating a complex environment where traders had to balance narrowing interest rate differentials against the threat of 24% tariffs on Japanese auto exports.
If you have futures in your trading portfolio, you can check out on CME Group data plans available that suit your trading needs tradingview.com/cme/
*CME Group futures are not suitable for all investors and involve the risk of loss. Copyright © 2023 CME Group Inc.
**All examples in this report are hypothetical interpretations of situations and are used for explanation purposes only. The views in this report reflect solely those of the author and not necessarily those of CME Group or its affiliated institutions. This report and the information herein should not be considered investment advice or the results of actual market experience.

Options Blueprint Series [Advanced]: Structuring Long VolatilityWhy Long Volatility Matters in Euro FX Right Now
Euro FX futures offer a clean and highly liquid way to observe how macro forces, relative growth expectations, and monetary policy differentials express themselves through price. While directional narratives often dominate discussion, options markets frequently reveal a different story — one centered on volatility pricing rather than directional certainty.
This Options Blueprint focuses on Euro FX futures (6E) and Micro EUR/USD futures (M6E) during a period when implied volatility is historically compressed, while price structure suggests an elevated probability of expansion. The purpose of this case study is not to anticipate direction, but to explore how options structures can be engineered to respond to range resolution risk when price compression and technical conflict coexist.
This article is strictly educational and illustrative, designed to demonstrate principles of volatility analysis, options structure design, and risk management.
Volatility Context: Reading Implied Volatility with CVOL
Implied volatility reflects the market’s collective expectation of future price variability. When implied volatility is elevated, options tend to price in larger potential moves. When it is compressed, options reflect an assumption of relative calm.
In this case, the CVOL index for Euro FX futures is observed at relatively low levels compared to its behavior earlier in the year. While CVOL is not predictive, it provides valuable context: the market is currently assigning a lower probability to large price swings than it has at other times.
Periods of compressed implied volatility are noteworthy because price expansion often follows periods of contraction, particularly when price structure begins to show signs of instability. This does not guarantee movement, but it shifts the analytical focus toward strategies that can benefit from expansion rather than stagnation.
Technical Landscape: A Market at an Inflection Point
From a structural perspective, Euro FX futures present a rare but important configuration: conflicting continuation and reversal patterns.
A bullish flag has developed following an impulsive advance, suggesting the potential for trend continuation.
Simultaneously, a double top formation has emerged, introducing the possibility of a downside resolution.
When viewed in isolation, each pattern offers a directional narrative. When viewed together, they create directional ambiguity but expansion risk clarity. In other words, the market may not be signaling where it intends to go — but it is signaling that remaining stagnant may be increasingly difficult.
This type of structural conflict is often where volatility-focused strategies become more relevant than directional trades.
Mapping Price Targets to Market Structure
Technical patterns are most useful when they provide reference points, not predictions. In this case, both patterns generate projected levels that act as structural guideposts.
The bullish flag projects an upside objective near 1.2116, which also aligns with a clearly defined UFO resistance zone.
The double top projects a downside objective near 1.1618, aligning with a well-defined UFO support zone.
These levels form a structural range boundary. Price acceptance beyond either boundary would represent meaningful resolution of the current compression phase. For options traders, these projected zones are valuable because they provide logical strike selection reference points when designing volatility structures.
Strategy Foundation: The Role of a Long Straddle
A traditional long straddle involves purchasing both a call and a put at the same strike, typically near the current price. This structure is directionally neutral and benefits from large price movements in either direction.
The strength of a long straddle lies in its convexity. Its primary weakness lies in time decay, particularly when implied volatility is low and price remains range-bound.
In compressed volatility environments, a pure long straddle can be inefficient if price takes time to resolve. This is where structure refinement becomes essential.
Strategy Evolution: Structuring an Asymmetric Long Volatility Approach
Instead of relying on a textbook long straddle, this Options Blueprint explores an asymmetric volatility structure designed to reflect the underlying technical landscape.
The structure begins with a long at-the-money straddle, capturing core volatility exposure:
Long 1.175 Call
Long 1.175 Put
To refine the payoff and reduce exposure to time decay, options are sold at technically
meaningful projected targets:
Short 1.21 Call
Short 1.16 Put
This transforms the strategy into a defined-risk, asymmetric volatility structure.
Key educational concepts illustrated by this construction:
The long options capture expansion risk near the current price.
The short options align with projected structural boundaries.
The payoff becomes skewed, favoring upside expansion while still allowing for limited downside participation.
Theta exposure is reduced compared to a pure long straddle.
The goal is not optimization, but intentional payoff shaping based on structure.
Risk Profile Analysis: Understanding the Payoff Diagram
The resulting risk profile highlights several important principles.
Maximum risk occurs if price remains trapped between the short strikes into expiration.
Upside expansion toward the upper projected level produces the most favorable outcome.
Downside expansion produces a smaller, but still positive, outcome.
Both risk and reward are defined, removing uncertainty around extreme scenarios.
This structure favors movement over stagnation, reflecting the belief that expansion risk outweighs the likelihood of prolonged consolidation — without requiring directional conviction.
Contract Specifications
Euro FX futures are available in both standard and micro formats.
o 6E (Euro FX Futures)
Larger notional exposure
Suitable for accounts with higher margin tolerance
o M6E (Micro EUR/USD Futures)
One-tenth the size of the standard contract
Greater flexibility for position sizing
Often useful for testing or scaling strategies
Both contracts reference the same underlying market structure, allowing the same analytical framework to be applied across different risk profiles.
Margin requirements vary and are subject to change, making position sizing and risk definition essential considerations when selecting between standard and micro contracts.
Euro FX futures (6E) have a tick size of 0.000050 per Euro increment = $6.25 tick value and currently require roughly ~$2,700 in margin per contract, while Micro EUR/USD Futures (M6E) use a 0.0001 tick size per euro = $1.25 tick value and margin closer to ~$270.
Risk Management Considerations
Options strategies are not defined solely by payoff diagrams — they are defined by how risk is managed over time.
Key considerations include:
Sizing positions so that the maximum loss is acceptable within the broader portfolio context.
Understanding how time decay accelerates as expiration approaches.
Recognizing that volatility expansion does not occur on a fixed schedule.
Accepting predefined loss zones as part of the structure rather than reacting emotionally.
Risk management is not about avoiding losses; it is about controlling exposure to uncertainty.
Key Takeaways from This Options Blueprint
Implied volatility provides context, not direction.
Conflicting chart patterns often increase expansion risk.
Options structures can be shaped to reflect technical asymmetry.
Modifying classic strategies can improve alignment with market conditions.
Defined risk and intentional design matter more than prediction.
This case study demonstrates how volatility, structure, and risk management intersect — without requiring directional forecasts.
Data Consideration
When charting futures, the data provided could be delayed. Traders working with the ticker symbols discussed in this idea may prefer to use CME Group real-time data plan on TradingView: www.tradingview.com - This consideration is particularly important for shorter-term traders, whereas it may be less critical for those focused on longer-term trading strategies.
General Disclaimer
The trade ideas presented herein are solely for illustrative purposes forming a part of a case study intended to demonstrate key principles in risk management within the context of the specific market scenarios discussed. These ideas are not to be interpreted as investment recommendations or financial advice. They do not endorse or promote any specific trading strategies, financial products, or services. The information provided is based on data believed to be reliable; however, its accuracy or completeness cannot be guaranteed. Trading in financial markets involves risks, including the potential loss of principal. Each individual should conduct their own research and consult with professional financial advisors before making any investment decisions. The author or publisher of this content bears no responsibility for any actions taken based on the information provided or for any resultant financial or other losses.

When Indexes Stop Agreeing, Markets Start TalkingEver notice how markets can look strong… yet feel a little off?
That’s usually when indexes stop marching in sync — and right now, that’s exactly what’s happening.
Let’s break it down, no jargon overload, no crystal balls.
Four Indexes, Four Different Stories
Here’s the current lineup in US equity index futures:
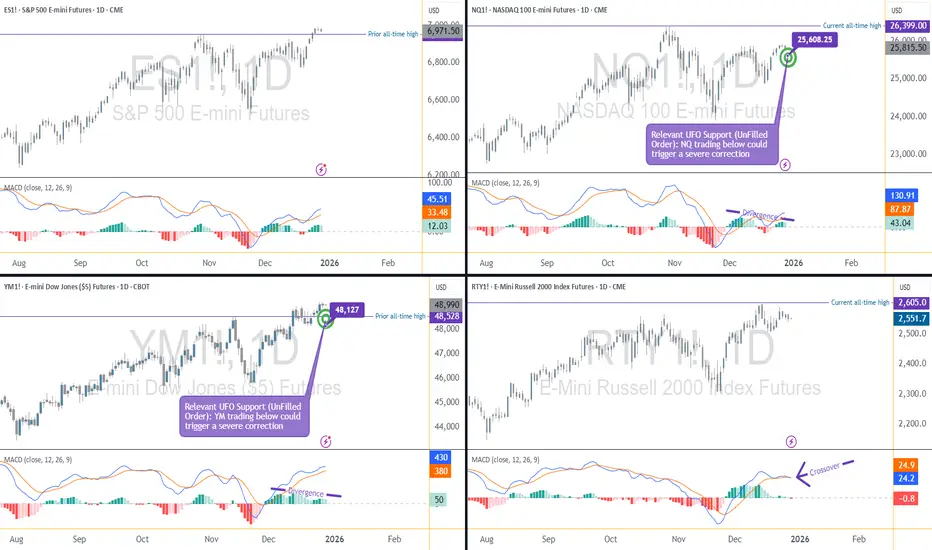
S&P 500 (ES) → Pushing to fresh all-time highs
Dow Jones (YM) → Also holding above prior highs
NASDAQ 100 (NQ) → Lagging below its peak
Russell 2000 (RTY) → Still stuck under its highs
When all four move together, trends tend to behave.
When they don’t? Markets usually get… interesting.
Why This Disagreement Matters
The NASDAQ is packed with technology and AI-related names — the same group that carried much of the upside through 2025. Its failure to confirm new highs raises an eyebrow.
Meanwhile:
The Dow (YM) is strong, despite being less tech-heavy
Small caps (RTY) aren’t joining the party
Leadership is narrowing, not expanding
That’s not a signal by itself — but it is a clue.
Momentum Is Whispering (Not Shouting)
Momentum indicators aren’t screaming danger, but they are quietly tapping the mic:
NASDAQ shows a bearish divergence
Dow also shows a bearish divergence (yes, even while strong)
Russell goes a step further with a divergence and a momentum crossover
The S&P 500? Still holding up — but increasingly alone.
When momentum fades while price stays elevated, markets often shift from trending to fragile.
The Levels That Actually Matter
Here’s where structure comes in.
Two UFO (UnFilled Orders) support zones sit right below price:
NASDAQ (NQ): ~25,608
Dow (YM): ~48,127
Above these levels, structure is intact.
Below them? That’s when momentum warnings could start turning into price action.
Think of these zones as market tripwires — nothing happens until they’re crossed.
Condition-Based Thinking (No Guessing Required)
Instead of asking “Will the market drop?”, a better question is:
What would need to happen for risk to expand?
A simple framework:
NQ below support + YM below support
Weakest and strongest indexes failing together
Divergences resolving through price, not time
That’s when downside scenarios become more relevant — not before.
Quick Note on Contract Specs & Margin
All four index futures discussed are available in E-mini and Micro E-mini versions, moving tick-for-tick with the same underlying index.
At a glance:
Micro contracts = 1/10 the tick value of E-minis
Typical tick values:
ES / MES: $12.50 vs. $1.25
NQ / MNQ: $5.00 vs. $0.50
YM / MYM: $5.00 vs. $0.50
RTY / M2K: $5.00 vs. $0.50
Margin context (approximate):
ES / MES: $22,500 vs. $2,250
NQ / MNQ: $33,500 vs. $3,350
YM / MYM: $14,250 vs. $1,425
RTY / M2K: $9,500 vs. $950
Same market, same analysis — just different risk granularity. This becomes especially useful when markets are hovering near key structural levels.
The Big Takeaway
Markets don’t usually turn when everyone expects them to.
They turn when participation fades, leadership narrows, and structure starts cracking.
Right now:
Some indexes are strong
Others are lagging
Momentum is diverging
Key levels are close
No conclusions. No assumptions.
Just evidence — and levels worth paying attention to as 2026 approaches.
Want More Depth?
If you’d like to go deeper into the building blocks of trading, check out our From Mystery to Mastery trilogy, three cornerstone articles that complement this one:
🔗 From Mystery to Mastery: Trading Essentials
🔗 From Mystery to Mastery: Futures Explained
🔗 From Mystery to Mastery: Options Explained
When charting futures, the data provided could be delayed. Traders working with the ticker symbols discussed in this idea may prefer to use CME Group real-time data plan on TradingView: www.tradingview.com - This consideration is particularly important for shorter-term traders, whereas it may be less critical for those focused on longer-term trading strategies.
General Disclaimer:
The trade ideas presented herein are solely for illustrative purposes forming a part of a case study intended to demonstrate key principles in risk management within the context of the specific market scenarios discussed. These ideas are not to be interpreted as investment recommendations or financial advice. They do not endorse or promote any specific trading strategies, financial products, or services. The information provided is based on data believed to be reliable; however, its accuracy or completeness cannot be guaranteed. Trading in financial markets involves risks, including the potential loss of principal. Each individual should conduct their own research and consult with professional financial advisors before making any investment decisions. The author or publisher of this content bears no responsibility for any actions taken based on the information provided or for any resultant financial or other losses.

When Indexes Disagree: Evidence-Based Clues Heading Into 2026Market Context: Why Futures-Based Index Analysis Matters
When equity markets approach historical extremes, surface-level price action often hides important structural information. This is especially true when analyzing cash indices alone. Futures markets, by contrast, provide continuous pricing across all trading sessions, including the Globex (Extended Trading Hours) session, offering a more complete picture of participation, liquidity, and risk transfer.
By focusing on US equity index futures rather than cash indices, traders gain visibility into how markets behave outside regular trading hours — often where meaningful positioning occurs. This becomes particularly important when markets are near all-time highs and internal alignment begins to fracture.
In this analysis, attention is placed on the four most relevant US equity index futures:
E-mini S&P 500 Index Futures (ES)
E-mini NASDAQ 100 Index Futures (NQ)
E-mini Dow Jones Index Futures (YM)
E-mini Russell 2000 Index Futures (RTY)
Together, these markets represent large-cap growth, broad market exposure, industrial and value-oriented components, and small-cap participation. When these indexes move in harmony, trends tend to persist. When they diverge, conditions often become more fragile.
All-Time Highs in Focus: Who Is Leading and Who Is Lagging
A defining characteristic of the current environment is disagreement among indexes, despite elevated price levels.
The E-mini S&P 500 Index Futures (ES) has recently pushed to a new all-time high. This reflects ongoing strength in the broader market and confirms that headline risk appetite remains intact.
In contrast, the E-mini NASDAQ 100 Index Futures (NQ) has failed to confirm this strength. Despite previous leadership, NQ is currently trading below its all-time high. This matters because the NASDAQ is heavily weighted toward technology and growth-related stocks, including those linked to artificial intelligence (AI) — sectors that provided a significant portion of upside momentum throughout 2025.
Meanwhile, the E-mini Dow Jones Index Futures (YM) is trading above its prior all-time high. This is notable because the Dow has a more diversified sector composition and is less concentrated in high-growth technology names. Its relative strength suggests that current market resilience may be coming from areas outside of the technology complex.
Finally, the E-mini Russell 2000 Index Futures (RTY) remains below its all-time high. Small- and mid-cap stocks often act as a confirmation layer for broader economic participation. When large-cap indexes make new highs while small caps lag, it can signal uneven economic traction and rising internal imbalance.
This combination — ES and YM showing strength, while NQ and RTY lag — forms the foundation of the current intermarket tension.
Momentum Evidence: What MACD Is Revealing Across Indexes
Price alone rarely tells the full story near extremes. Momentum indicators, when used correctly, help evaluate the quality of participation behind price movement.
In this case, the MACD indicator reveals important divergences across multiple indexes.
The NQ is displaying a bearish momentum divergence, where price remains elevated but momentum fails to confirm. This suggests that upside participation is narrowing rather than expanding.
The YM — despite being one of the strongest indexes — is also showing a bearish divergence on MACD. This is particularly important because divergences forming in strong markets often precede broader shifts, not because price must reverse immediately, but because momentum strength is no longer accelerating.
The RTY presents the most advanced signal set. It is not only showing a bearish divergence, but also a MACD crossover, which can be interpreted as early-stage downside momentum attempting to assert itself.
The ES, while not currently exhibiting the same degree of momentum weakness, stands increasingly isolated. When leadership narrows to one index, risk becomes asymmetric rather than evenly distributed.
Structural Risk Zones: Interpreting UFO (UnFilled Orders) Support
Momentum divergences alone do not constitute actionable signals. They require structural confirmation.
This is where UFO support and resistance levels (UnFilled Orders) become relevant. UFO zones represent areas where liquidity previously failed to transact fully, often acting as structural support or resistance when revisited.
In the current structure, two UFO support zones stand out due to their proximity to price and their relevance to both the strongest and weakest markets:
NQ: UFO support ending near 25,608.25
YM: UFO support ending near 48,127
These levels are significant because they sit directly beneath current price action. As long as price remains above these zones, structure remains intact despite momentum warnings.
However, a violation of such UFO supports would represent a meaningful shift. It would indicate that buyers previously willing to defend these levels are no longer present, allowing momentum divergences to express themselves more fully.
Conditional Scenarios: What Would Confirm a Broader Risk Shift
Rather than anticipating outcomes, evidence-based analysis focuses on conditions.
From a structural standpoint, bearish scenarios would gain credibility if:
NQ trades below 25,608.25, violating its nearby UFO support
YM trades below 48,127, removing structural support from the strongest index
Weakness emerging simultaneously in both the weakest and strongest indexes would suggest that divergence is resolving through price rather than consolidation. In such a case, broader downside expansion could develop, potentially manifesting as a sharp corrective phase.
Importantly, this framework does not assume that such a move must occur. It simply defines what conditions would matter if they do.
Illustrative Trade Framework (Educational Example Only)
For traders studying downside scenarios, a hypothetical bearish framework could be structured as follows:
Trigger: Confirmed daily close below relevant UFO support
Risk Definition: Invalidation above reclaimed structure
Objective: Next lower structural liquidity zone
Reward-to-Risk: Favorable only if structure breaks decisively
This framework is illustrative and intended solely to demonstrate how structure, momentum, and confirmation can align. It does not imply expectations or outcomes.
E-mini vs. Micro E-mini Contracts
All four equity index futures discussed — ES, NQ, YM, and RTY — are available in both E-mini and Micro E-mini formats. Both versions track the same underlying index and move tick-for-tick together. The difference lies in how risk is expressed.
ES / MES Tick size: 0.25 index points = $12.50 (ES) | $1.25 (MES)
NQ / MNQ Tick size: 0.25 index points = $5.00 (NQ) | $0.50 (MNQ)
YM / MYM Tick size: 1 index point = $5.00 (YM) | $0.50 (MYM)
RTY / M2K Tick size: 0.10 index points = $5.00 (RTY) | $0.50 (M2K)
Across all four indexes, Micro E-mini contracts represent one-tenth of the tick value of their E-mini counterparts.
Margin requirements vary by broker and market conditions. From a structural perspective:
ES / MES required margin = ~$22,500 (ES) | ~$2,250 (MES)
NQ / MNQ required margin = ~$33,500 (NQ) | ~$3,350 (MNQ)
YM / MYM required margin = ~$14,250 (YM) | ~$1,425 (MYM)
RTY / M2K required margin = ~$9,500 (RTY) | ~$950 (M2K)
This difference allows traders to express the same market thesis with far greater precision, especially when working around tight structural levels or conditional triggers.
With momentum divergences developing and key structural zones nearby, position sizing flexibility becomes critical. Micro E-mini contracts make it possible to:
Scale exposure gradually
Reduce concentration risk
Align risk more closely with invalidation levels
The analysis remains identical across E-minis and Micros — only the risk calibration changes.
Risk Management Considerations
Divergences can persist longer than expected, especially in strong trends. Acting without confirmation often leads to premature positioning.
Key principles include:
Waiting for structural validation
Defining risk before engaging
Managing exposure across correlated instruments
Avoiding overconfidence near historical extremes
Markets rarely turn because of opinion. They turn when structure and participation change.
Final Takeaway: Evidence Over Assumptions
As 2025 comes to a close, US equity index futures present a market that is strong on the surface but fractured underneath. Leadership is narrowing, momentum is diverging, and structural levels are increasingly relevant.
Whether these signals resolve through consolidation or correction remains unknown. What matters is that the evidence is now visible — and futures markets provide the clarity needed to observe it.
Data Consideration
When charting futures, the data provided could be delayed. Traders working with the ticker symbols discussed in this idea may prefer to use CME Group real-time data plan on TradingView: www.tradingview.com - This consideration is particularly important for shorter-term traders, whereas it may be less critical for those focused on longer-term trading strategies.
General Disclaimer
The trade ideas presented herein are solely for illustrative purposes forming a part of a case study intended to demonstrate key principles in risk management within the context of the specific market scenarios discussed. These ideas are not to be interpreted as investment recommendations or financial advice. They do not endorse or promote any specific trading strategies, financial products, or services. The information provided is based on data believed to be reliable; however, its accuracy or completeness cannot be guaranteed. Trading in financial markets involves risks, including the potential loss of principal. Each individual should conduct their own research and consult with professional financial advisors before making any investment decisions. The author or publisher of this content bears no responsibility for any actions taken based on the information provided or for any resultant financial or other losses.
Forget the Textbook: A 30-Year Reality CheckA Big Policy Moment
A central bank (BOJ) just pushed interest rates to levels not seen in 30 years.
That’s not a routine tweak — that’s a regime shift.
Textbooks might suggest a clean, logical market response.
Reality? Markets got emotional. Fast.
Selling Got Loud
Instead of an orderly adjustment, selling pressure exploded.
Not just “price going down,” but effort going through the roof.
That’s where Volume Delta comes in — the net difference between buying and selling volume. It tells us who is pressing the gas pedal.
And in this case, sellers floored it.
When an Indicator Starts Yelling
Now here’s the interesting part.
Bollinger Bands weren’t applied to price…
They were applied to Volume Delta itself.
Result?
Volume Delta plunged far below its lower Bollinger Band.
That’s not normal selling.
That’s everyone trying to get out at the same time.
Does that mean price must reverse?
Nope. But it does suggest selling is becoming inefficient.
No Safety Net Below
Here’s the catch.
There are no meaningful UFO supports (UnFilled Orders) below current price.
No obvious institutional “safety net.”
Instead, only two old technical floors remain:
0.0063330
0.0062415
Think of them as floors, not trampolines. Price may react… or punch straight through.
Reaction Beats Guessing
This is where patience matters.
Extreme selling doesn’t mean “buy now.”
It means watch closely.
At those levels, traders are looking for:
Selling pressure slowing down
Price stabilizing
Daily closes showing acceptance or rejection
No assumptions. Only reactions.
Don’t Forget the Ceiling
Even if price bounces, there’s a ceiling waiting above.
A clear sell-side UFO resistance sits near 0.0065640.
That’s leftover supply — the kind that often stops rallies in their tracks.
So any upside move?
Treat it as corrective until structure says otherwise.
Contract Specs
This analysis uses both standard and micro futures to illustrate scalable risk. Japanese Yen Futures (6J) have a tick size of 0.0000005 with a $6.25 tick value and currently require roughly ~$2,800 in margin per contract, while Micro JPY/USD Futures (MJY) use a 0.000001 tick size with a $1.25 tick value and margin closer to ~$280. Margin requirements vary by market conditions and broker policies, and micro contracts can be especially useful when volatility expands following major macro events.
The Big Takeaway
Historic policy decisions don’t end stories — they start messy chapters.
Extreme Volume Delta shows stress, not certainty.
Structure decides what comes next.
When markets digest big shocks, the edge doesn’t come from predicting —
It comes from staying disciplined while everyone else reacts.
Want More Depth?
If you’d like to go deeper into the building blocks of trading, check out our From Mystery to Mastery trilogy, three cornerstone articles that complement this one:
🔗 From Mystery to Mastery: Trading Essentials
🔗 From Mystery to Mastery: Futures Explained
🔗 From Mystery to Mastery: Options Explained
When charting futures, the data provided could be delayed. Traders working with the ticker symbols discussed in this idea may prefer to use CME Group real-time data plan on TradingView: www.tradingview.com - This consideration is particularly important for shorter-term traders, whereas it may be less critical for those focused on longer-term trading strategies.
General Disclaimer:
The trade ideas presented herein are solely for illustrative purposes forming a part of a case study intended to demonstrate key principles in risk management within the context of the specific market scenarios discussed. These ideas are not to be interpreted as investment recommendations or financial advice. They do not endorse or promote any specific trading strategies, financial products, or services. The information provided is based on data believed to be reliable; however, its accuracy or completeness cannot be guaranteed. Trading in financial markets involves risks, including the potential loss of principal. Each individual should conduct their own research and consult with professional financial advisors before making any investment decisions. The author or publisher of this content bears no responsibility for any actions taken based on the information provided or for any resultant financial or other losses.

3-Decade Rate Milestone: How Markets Digest Policy ShocksA Central Bank Decision Decades in the Making
When a central bank moves interest rates to levels not seen in three decades, markets rarely respond in a linear or orderly fashion. Such decisions are not interpreted as isolated adjustments, but as structural signals that force participants to reassess positioning, risk, and longer-term assumptions.
The recent interest rate increase by the Bank of Japan marked exactly that kind of milestone. Beyond the numerical change itself, the decision carried symbolic weight: a clear departure from an era defined by extraordinary accommodation. Yet, rather than triggering a straightforward repricing, the immediate market response leaned heavily toward aggressive selling pressure in the Japanese Yen.
This disconnect between policy intent and market reaction highlights an important reality: markets do not simply react to decisions — they digest them. And digestion is often messy.
From Policy Shock to Positioning Shock
Major policy announcements tend to unfold in two phases. The first phase is informational, where the headline is absorbed. The second phase is positional, where traders and institutions adjust exposure based on how that information interacts with existing risk.
In this case, the rate hike represented a known risk event, but its implications were far from binary. Messaging around future policy paths, real-rate dynamics, and external yield differentials all contributed to uncertainty. That uncertainty translated into heavy participation on the sell side, not because the outcome was definitively bearish, but because positioning needed to be reset.
This is where flow-based tools become especially valuable. Price alone often obscures what is really happening beneath the surface.
Flow Exhaustion as an Analytical Framework
Flow exhaustion is not about calling tops or bottoms. It is about identifying moments when participation becomes unusually one-sided, increasing the probability that continuation becomes harder to sustain.
One easy way to observe this phenomenon is through Volume Delta, defined as the net difference between buying volume and selling volume over a given period. Volume Delta provides insight into how aggressively one side of the market is pressing its case.
Unlike traditional price-based indicators, Volume Delta focuses on effort rather than outcome. Price can move modestly while effort is extreme — and it is often in those situations where future responses become most interesting.
Bollinger Bands® on Volume Delta, Not Price
In this framework, Bollinger Bands® are applied not to price, but to Volume Delta itself. This distinction is critical.
Bollinger Bands® on price measure volatility relative to price behavior. Bollinger Bands® on Volume Delta measure participation extremes relative to historical flow behavior. When Volume Delta trades far beyond its lower band, it signals that selling pressure is not just dominant, but statistically stretched.
On the daily chart, Volume Delta recently moved well below its lower Bollinger Band®. This represents an exaggerated imbalance, suggesting that sellers were acting with urgency and intensity rarely sustained over extended periods.
Importantly, this does not imply that price must reverse. It simply indicates that the marginal impact of additional sellers may be diminishing.
What Extreme Selling Really Means
Extreme selling does not mean that buyers suddenly appear in force. It means that the market has already absorbed a significant amount of sell-side participation.
In practical terms, when Volume Delta reaches such depressed levels, one of two things tends to occur:
Selling slows, leading to consolidation or corrective movement.
Price seeks lower levels where new participants are willing to engage.
Which outcome unfolds depends heavily on structure — specifically, what lies beneath price.
The Support Landscape Below Price
A critical observation in the current structure is the absence of UFO support levels (UnFilled Orders) beneath current price levels. UFO supports represent areas where prior institutional participation was not fully satisfied, often acting as structural reference points.
Without meaningful UFOs below, the market cannot rely on obvious liquidity-backed demand. Instead, attention shifts to historical technical supports derived from prior pivot lows.
Two such levels stand out:
0.0063330
0.0062415
These levels represent areas where price previously found acceptance.
Reaction Zones, Not Assumptions
At this stage, the distinction between anticipation and reaction becomes essential. Extreme Volume Delta does not justify preemptive positioning. Instead, it highlights zones where observation becomes critical.
At each technical support, traders may evaluate:
Whether selling pressure visibly decelerates
Whether price stabilizes despite continued effort
Whether daily closes show acceptance or rejection
The first support may hold. It may also fail. The absence of structural UFO support means the market retains flexibility, and traders must adapt accordingly.
Overhead Structure: Supply Still Matters
While attention often gravitates toward potential downside exhaustion, it is equally important to recognize what exists above price.
A relevant sell-side UFO resistance is located near 0.0065640. This zone represents UnFilled Sell orders and remains structurally intact.
Should price respond positively from lower levels, this area becomes a natural reference point where supply could reassert itself. In downtrending environments, rebounds frequently encounter resistance before any broader shift occurs.
This reinforces the importance of framing any upside move as corrective unless proven otherwise by structure.
Hypothetical Trade Framework (Illustrative Case Study)
To translate these observations into a practical framework, consider a purely illustrative example.
A hypothetical long-side case study could involve:
Monitoring price behavior at either technical support level
Waiting for evidence of stabilization or responsive buying
Using the support zone as a contextual risk reference
Defining invalidation below the chosen support
Referencing the overhead UFO resistance as a potential objective (target)
The reward-to-risk profile in such a framework depends entirely on execution and confirmation. This example is presented solely to demonstrate how flow exhaustion and structure may be combined.
Contract Specifications
This analysis references both standard and micro futures contracts to illustrate scalability and risk calibration.
Japanese Yen Futures (6J):
Tick size: 0.0000005
Tick value: $6.25
Currently ~$2,800 per contract
Micro JPY/USD Futures (MJY):
Tick size: 0.000001
Tick value: $1.25
Currently ~$280 per contract
Margin requirements vary by market conditions and broker policies. Micro contracts can be particularly useful in environments where volatility expands following macro events.
Risk Management Considerations
Policy-driven markets tend to remain unstable longer than expected. Even when selling pressure appears exhausted, uncertainty persists.
Key risk management principles include:
Defining risk before engagement
Adjusting size to reflect volatility
Avoiding emotional responses to extreme indicators
Accepting that not all exhaustion leads to reversals
Structure, not conviction, should guide decision-making.
How Markets Digest Policy Shocks
Major policy milestones do not resolve narratives — they reshape them. Flow extremes reveal stress points in positioning, not certainty in direction.
In the aftermath of a 3-decade rate milestone, the market enters a digestion phase. Volume Delta extremes suggest that selling pressure has been intense, but structure determines how that pressure resolves.
Patience, observation, and disciplined reaction remain the most reliable tools when markets recalibrate after historic decisions.
Data Consideration
When charting futures, the data provided could be delayed. Traders working with the ticker symbols discussed in this idea may prefer to use CME Group real-time data plan on TradingView: www.tradingview.com - This consideration is particularly important for shorter-term traders, whereas it may be less critical for those focused on longer-term trading strategies.
General Disclaimer
The trade ideas presented herein are solely for illustrative purposes forming a part of a case study intended to demonstrate key principles in risk management within the context of the specific market scenarios discussed. These ideas are not to be interpreted as investment recommendations or financial advice. They do not endorse or promote any specific trading strategies, financial products, or services. The information provided is based on data believed to be reliable; however, its accuracy or completeness cannot be guaranteed. Trading in financial markets involves risks, including the potential loss of principal. Each individual should conduct their own research and consult with professional financial advisors before making any investment decisions. The author or publisher of this content bears no responsibility for any actions taken based on the information provided or for any resultant financial or other losses.

How I Spot Trading Opportunity – Part IILast week, we discussed how to spot trading opportunities using multiple asset classes. I also created multiple tabs for each asset class, such as currencies, commodities, and indices. Within each asset class, there are multiple products.
The whole idea is this: if you already have a trading methodology that is working well for you in a particular asset, say gold or silver, and you have been trading it for a long time, why not apply the same trading methodology across other markets?
It is not too difficult to pick up trading ideas fairly quickly from the market at any point in time. And I am going to share with you how I do that.
Micro E-mini Nasdaq Futures & Options
Ticker: MNQ
Minimum fluctuation:
0.25 index points = $0.50
Disclaimer:
• What presented here is not a recommendation, please consult your licensed broker.
• Our mission is to create lateral thinking skills for every investor and trader, knowing when to take a calculated risk with market uncertainty and a bolder risk when opportunity arises.
CME Real-time Market Data help identify trading set-ups in real-time and express my market views. If you have futures in your trading portfolio, you can check out on CME Group data plans available that suit your trading needs www.tradingview.com

When Price Gets Ahead of ItselfMarkets love drama.
Price breaks out, momentum accelerates, and suddenly everything feels obvious. Charts look clean, conviction is high, and everyone agrees — this thing is strong.
But here’s the catch: strong doesn’t always mean sustainable.
When price moves too far too fast, it stretches liquidity, pulls in late participants, and often leaves structure behind. That’s when volatility expands, Bollinger Bands® get left in the dust, and the market quietly becomes fragile.
This is where mean reversion sneaks into the conversation — not as a call for collapse, but as a reminder that markets like balance. Extremes attract attention, and attention attracts counter-flow.
Add in order-flow context — like UnFilled Orders (UFOs) lining up near pattern objectives — and suddenly those “obvious” moves don’t look quite as comfortable anymore.
Mean reversion trades aren’t about being right.
They’re about managing risk when price runs ahead of itself.
Because in trading, the real edge isn’t momentum.
It’s knowing when momentum starts to wobble.
Know your specs…
Standard Futures Contract (6E)
Minimum price fluctuation (tick): 0.000050 per Euro increment = $6.25
Typical margin characteristics: ~$2,700 per contract
Micro Futures Contract (M6E)
Minimum price fluctuation (tick): 0.0001 per euro = $1.25
Typical margin characteristics: ~$270 per contract
Want More Depth?
If you’d like to go deeper into the building blocks of trading, check out our From Mystery to Mastery trilogy, three cornerstone articles that complement this one:
🔗 From Mystery to Mastery: Trading Essentials
🔗 From Mystery to Mastery: Futures Explained
🔗 From Mystery to Mastery: Options Explained
When charting futures, the data provided could be delayed. Traders working with the ticker symbols discussed in this idea may prefer to use CME Group real-time data plan on TradingView: www.tradingview.com - This consideration is particularly important for shorter-term traders, whereas it may be less critical for those focused on longer-term trading strategies.
General Disclaimer:
The trade ideas presented herein are solely for illustrative purposes forming a part of a case study intended to demonstrate key principles in risk management within the context of the specific market scenarios discussed. These ideas are not to be interpreted as investment recommendations or financial advice. They do not endorse or promote any specific trading strategies, financial products, or services. The information provided is based on data believed to be reliable; however, its accuracy or completeness cannot be guaranteed. Trading in financial markets involves risks, including the potential loss of principal. Each individual should conduct their own research and consult with professional financial advisors before making any investment decisions. The author or publisher of this content bears no responsibility for any actions taken based on the information provided or for any resultant financial or other losses.

The Aussie on the brink: annual highs under siegeFollowing the bullish impulse initiated at the end of November, the Aussie is now challenging its annual highs. With the latest monetary policy decisions largely digested and implied volatility declining, the market is refocusing on microstructure and flows.
Fundamental Analysis
The RBA’s latest hold, the third in a row, confirmed a “hawkish hold” bias that continues to support the Australian dollar. The central bank acknowledges that inflation is proving broader than initially expected and remains alert to second-round risks, keeping real rate expectations elevated for Australia. The RBA Rate Tracker, which measures the implied probability of a rate change, is also starting to price in a moderate chance of a hike in 2026.
On the US side, while the official message remains cautious, the market has mainly noted the inability of US yields to re-establish a sustained upward trend. This is compounded by a well-established seasonal factor, as December has historically been a period of USD underperformance, driven by hedging flows and profit repatriation.
The broader global backdrop is also supportive for the AUD given its strong correlation with commodities, with copper and gold trading at historically high levels.
Technical Analysis
From a technical standpoint, the daily chart of 6AH6 shows a clear structure of higher lows and higher highs since the November trough. Prices are trading above key moving averages, notably the 55-day average, which is acting as dynamic support. The current consolidation is taking place above former value areas, a typical feature of a market accepting higher prices rather than one in distribution.
Volume analysis provides additional insight. Upward phases have been accompanied by rising volumes, while recent pullbacks have occurred on more moderate volume. This suggests an absence of aggressive selling pressure. The visible volume profile on the chart shows a high concentration of trading activity around 0.6550–0.6600, corresponding to a former equilibrium now located below the market. Since the bullish recovery, price has moved into a low-volume area above, indicating that the market is exploring levels with limited historical trading.
The current zone around 0.6650–0.6670 appears more like a pause than a definitive resistance. As long as price remains above the core of the volume profile, probabilities favor continuation or, at a minimum, a high-level consolidation.
Sentiment Analysis
Retail sentiment on spot AUD/USD is particularly skewed, with retail traders heavily net short. Some platforms even show ratios exceeding 80% or 90% short positions. This configuration is typical of market phases where retail participants attempt to anticipate a top based on psychological levels or visible resistance, without waiting for a confirmed reversal signal.
From a contrarian perspective, this positioning represents potential fuel for further upside. It indicates that the market is not overloaded with fragile speculative longs, but instead crowded with sellers who may be forced to cover if key levels are broken.
On the institutional side, no major desks appear to be arguing for an immediate, structural bearish reversal in AUD/USD.
Options Analysis
In the options space, calls are more in demand and more expensive, confirming a dominant short-term bullish bias and a market that is primarily expecting extension.
The options heatmap also shows large clusters of call options at the 0.6700 and 0.6750 strikes. In the event of an approach to or break above these levels, call sellers could find themselves short gamma and forced to hedge via futures buying, thereby amplifying the bullish move.
Trade Idea (6AH6)
With a lighter news calendar and market liquidity gradually declining, there is limited likelihood of sufficient catalysts to reverse the trend before year-end. In this context, a directional bullish strategy remains the most coherent, at least over the next two weeks.
Entry zone: on pullbacks toward 0.6620–0.6630
Stop loss: below the 55-day average, currently around 0.6540
Primary target: 0.6750
Extended target: 0.6850 in the event of an options-driven squeeze
Final Thoughts
Even though the AUD has shown some hesitation over the past few sessions, signals continue to converge toward an intact bullish potential. Fundamentals are supportive, technical analysis points to acceptance of higher prices, retail sentiment is heavily contrarian, and options positioning highlights the risk of a squeeze above well-identified levels.
In this type of environment, the market’s ability to force weak hands out should not be underestimated, particularly during periods of lower liquidity. As long as the structure remains intact, a bullish extension beyond the annual highs remains the most coherent scenario into year-end, ahead of a likely consolidation phase in early 2026.
---
When charting futures, the data provided could be delayed. Traders working with the ticker symbols discussed in this idea may prefer to use CME Group real-time data plan on TradingView: tradingview.com/cme/ .
This consideration is particularly important for shorter-term traders, whereas it may be less critical for those focused on longer-term trading strategies.
General Disclaimer:
The trade ideas presented herein are solely for illustrative purposes forming a part of a case study intended to demonstrate key principles in risk management within the context of the specific market scenarios discussed. These ideas are not to be interpreted as investment recommendations or financial advice. They do not endorse or promote any specific trading strategies, financial products, or services. The information provided is based on data believed to be reliable; however, its accuracy or completeness cannot be guaranteed. Trading in financial markets involves risks, including the potential loss of principal. Each individual should conduct their own research and consult with professional financial advisors before making any investment decisions. The author or publisher of this content bears no responsibility for any actions taken based on the information provided or for any resultant financial or other losses.

The Anatomy of an Overextended Market MoveMarket Context: When Momentum Accelerates
Markets periodically enter phases where price accelerates rapidly, often driven by a combination of macro catalysts, positioning imbalances, and behavioral feedback loops. In such environments, momentum can appear self-reinforcing: higher prices attract more participation, which in turn pushes prices even higher. While these phases can feel decisive and convincing, they also introduce an important analytical question — is the move being accepted by the market, or is it simply expanding faster than structure can support?
This distinction matters because strong momentum does not automatically imply durability. In fact, the most aggressive moves often carry the seeds of their own instability, particularly when price begins to disconnect from commonly observed reference points such as volatility envelopes, prior value zones, and resting order clusters.
The recent advance examined in this case study provides a clear example of this dynamic: a structurally bullish resolution followed by a sharp acceleration that raises legitimate questions about sustainability.
Pattern Resolution Versus Move Sustainability
Classical chart patterns are useful because they describe how markets transition from balance to imbalance. A double bottom, for example, reflects a failed attempt by sellers to extend lower prices, followed by renewed demand. Once the neckline is cleared, the pattern is considered resolved.
However, pattern resolution only explains directional bias — it does not guarantee how price will behave after the breakout.
In practice, many pattern completions coincide with:
Early participants reducing exposure
Profit-taking activity near projected objectives
New positioning that is more sensitive to short-term adverse movement
As a result, the completion of a pattern can sometimes mark the end of a clean directional phase rather than the beginning of an extended one. This is especially relevant when the breakout is followed by aggressive price expansion rather than gradual acceptance.
Volatility Expansion and the Bollinger Band Framework
Bollinger Bands® are commonly misunderstood as directional indicators. In reality, they function as volatility envelopes, providing context for how far price has deviated from its recent mean.
When price trades:
Outside the upper band
After a gap higher
And remains extended for multiple sessions
it signals volatility expansion, not necessarily trend continuation.
From a statistical perspective, such conditions indicate that price has moved beyond its recent distribution range. From a behavioral perspective, they often reflect:
Late participation
Emotional decision-making
Reduced liquidity on one side of the market
None of these imply that price must reverse immediately. What they do imply is that the informational risk of continuation increases, while the probability of mean reversion back toward equilibrium also rises.
Mean Reversion as a Structural Tendency
Mean reversion is not a prediction tool. It is a structural tendency observed across liquid markets, driven by the constant interaction between:
Value discovery
Liquidity provision
Inventory management by participants
When price moves “too far, too fast,” it stretches these mechanisms. Liquidity providers become more selective, directional participants begin to manage exposure, and resting orders closer to the mean regain relevance.
Importantly, mean reversion does not require a bearish narrative. It simply reflects the market’s natural inclination to revisit areas where participation was previously deeper and more balanced.
In this context, mean reversion should be viewed as a risk consideration, not a directional conviction.
Order-Flow Structure
A key element of this case study is the alignment between classical technical projections and observable order-flow structure, described here through the lens of UnFilled Orders (UFOs).
UFOs represent areas where prior activity suggests the presence of resting interest that has not yet been fully executed. These zones often coincide with:
Prior consolidations
Structural inflection points
Pattern-derived objectives
In the current structure:
o An upper zone near 1.18350 aligns with:
The projected objective of the resolved pattern
UFO resistance
Likely areas of trade closure and sell on-field activity
o A lower zone near 1.16875 aligns with:
UFO support
Areas where price previously attracted participation
A logical mean reversion destination
The importance of these zones lies not in their precision, but in their confluence. When multiple frameworks point to the same areas, they tend to attract attention from a broader range of participants.
Why Overextended Moves Become Fragile
Overextended markets often appear strongest right before they become most sensitive. This is because:
Positioning becomes one-sided
Liquidity thins as fewer participants are willing to transact at extremes
Small shifts in order flow can have outsized impact
In such conditions, price does not need a major catalyst to retrace. It often only needs:
A pause in aggressive buying
Routine profit-taking
A minor shift in expectations
This fragility is what makes mean reversion a relevant consideration after sharp extensions, even within broader bullish structures.
Illustrative Trade Framework (Case Study Only)
To translate these concepts into a practical framework, consider the following illustrative structure, presented strictly as a case study.
o Context
Price has resolved a bullish pattern
Volatility has expanded sharply
Price is trading outside the upper Bollinger Band
o Area of Interest - Upper reference zone near 1.18350, where:
Pattern objectives converge
UFO resistance is present
Trade closure activity is likely
o Mean Reversion Reference - Lower zone near 1.16875, aligned with:
Buy UFO support
Prior participation
The statistical mean
o Risk Definition
Invalidation occurs if price demonstrates acceptance above the resistance zone rather than rejection
This framework highlights an important principle: mean reversion trades are defined by risk first, not by direction. They require patience, flexibility, and a clear understanding of when the underlying premise no longer applies.
Standard and Micro Contracts
This case study can be examined using both standard and micro futures contracts, which offer different exposure profiles while referencing the same underlying market. Understanding their basic specifications is essential, particularly when volatility expands and mean reversion risk increases.
o Standard Futures Contract (6E)
Minimum price fluctuation (tick): 0.000050 per Euro increment = $6.25
Typical margin characteristics: ~$2,700 per contract
o Micro Futures Contract (M6E)
Minimum price fluctuation (tick): 0.0001 per euro = $1.25
Typical margin characteristics: ~$270 per contract
Margin requirements are dynamic, not fixed. They are influenced by market volatility, exchange risk controls, and clearing firm policies.
From a risk-management perspective, the availability of both standard and micro contracts enables traders to align position size with conviction and uncertainty, rather than forcing binary exposure decisions.
Risk Management Considerations
Mean reversion setups carry unique risks. Unlike momentum trades, they often involve entering against recent price direction, which requires:
Smaller position sizing
Wider tolerance for initial adverse movement
Strict invalidation criteria
It is also important to distinguish between being early and being wrong. Overextended markets can remain extended longer than expected. Risk management exists to ensure that such scenarios do not result in disproportionate losses.
Ultimately, the objective is not to capture every retracement, but to participate selectively when structure, volatility, and order-flow context align.
Data Consideration
When charting futures, the data provided could be delayed. Traders working with the ticker symbols discussed in this idea may prefer to use CME Group real-time data plan on TradingView: www.tradingview.com - This consideration is particularly important for shorter-term traders, whereas it may be less critical for those focused on longer-term trading strategies.
General Disclaimer
The trade ideas presented herein are solely for illustrative purposes forming a part of a case study intended to demonstrate key principles in risk management within the context of the specific market scenarios discussed. These ideas are not to be interpreted as investment recommendations or financial advice. They do not endorse or promote any specific trading strategies, financial products, or services. The information provided is based on data believed to be reliable; however, its accuracy or completeness cannot be guaranteed. Trading in financial markets involves risks, including the potential loss of principal. Each individual should conduct their own research and consult with professional financial advisors before making any investment decisions. The author or publisher of this content bears no responsibility for any actions taken based on the information provided or for any resultant financial or other losses.

Neckline Breaks and Trader Nerves: A Quick Guide to Bearish H&S The head and shoulders pattern is like the market’s way of clearing its throat and saying, “Things might be changing up here.” Once that neckline snaps, traders often sit up straighter — not because something magical happened, but because the chart finally drew a clean line between “maybe” and “now it matters.”
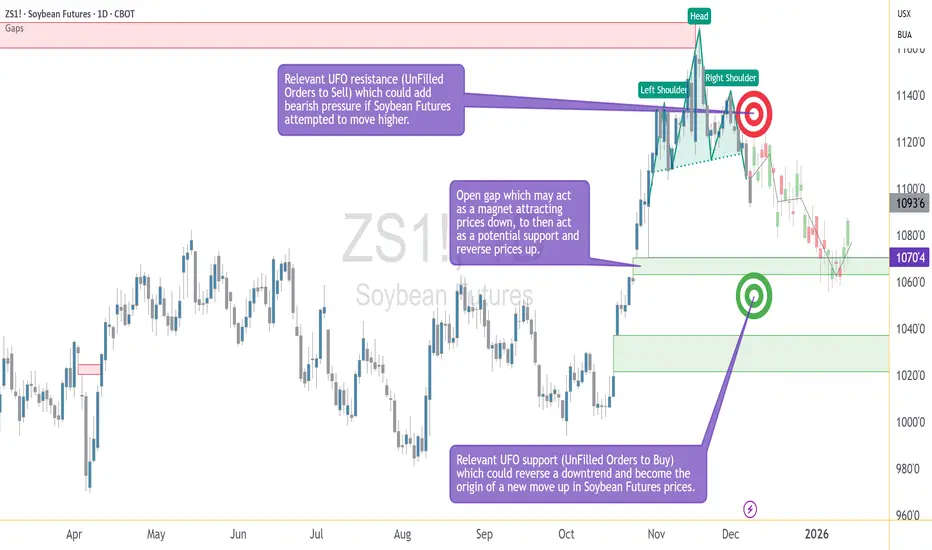
In this ZS (Soybean Futures) example, price slipped under the neckline and started wandering toward lower ground. Traders who work with this pattern usually focus on three things:
A possible bounce back toward the neckline (because markets love second chances),
A clear invalidation level (in this case, above 1136),
A logical downside objective such as the gap-and-support combo near 1070'4.
That simple trio turns a chaotic chart into a calm plan.
Contract specs matter too. The ZS contract moves in bigger bites:
Tick: 1/4 of one cent (0.0025) per bushel = $12.50 per contract
Margin: $2,000 per contract
The MZS (Micro Soybean Futures) contract takes smaller ones:
Tick: 0.0050 per bushel = $2.50 per contract
Margin: $200 per contract
Traders who want more precision sometimes choose the micro so their stop-loss distance and account size stay on speaking terms. Either way, the chart sets the idea, but the contract size sets the comfort level.
And of course, the golden rule in pattern-based trading: the market can still do whatever it wants. That’s why traders define their exit if wrong, their objective if right, and their size before clicking anything. A head and shoulders isn't about predicting — it's about organizing.
The chart example ties it all together: neckline break, resistance overhead, downside target below. Simple, structured, and practical — just the way traders like it.
Want More Depth?
If you’d like to go deeper into the building blocks of trading, check out our From Mystery to Mastery trilogy, three cornerstone articles that complement this one:
🔗 From Mystery to Mastery: Trading Essentials
🔗 From Mystery to Mastery: Futures Explained
🔗 From Mystery to Mastery: Options Explained
When charting futures, the data provided could be delayed. Traders working with the ticker symbols discussed in this idea may prefer to use CME Group real-time data plan on TradingView: www.tradingview.com - This consideration is particularly important for shorter-term traders, whereas it may be less critical for those focused on longer-term trading strategies.
General Disclaimer:
The trade ideas presented herein are solely for illustrative purposes forming a part of a case study intended to demonstrate key principles in risk management within the context of the specific market scenarios discussed. These ideas are not to be interpreted as investment recommendations or financial advice. They do not endorse or promote any specific trading strategies, financial products, or services. The information provided is based on data believed to be reliable; however, its accuracy or completeness cannot be guaranteed. Trading in financial markets involves risks, including the potential loss of principal. Each individual should conduct their own research and consult with professional financial advisors before making any investment decisions. The author or publisher of this content bears no responsibility for any actions taken based on the information provided or for any resultant financial or other losses.

From Neckline to Target: Setting H&S Bearish Entries and ExitsUnderstanding the Head & Shoulders Breakdown
A bearish head and shoulders pattern gives traders a structured way to define entries and exits using price geometry rather than emotion. The pattern forms when a market transitions from strength to distribution, creating a left shoulder, a higher head, and then a lower right shoulder as momentum begins to fade. The neckline acts as the key support level that separates a developing pattern from a completed one.
In the case study illustrated on the chart, the daily timeframe shows a fully developed head and shoulders structure that confirmed during the December 5 trading session, when price closed below the neckline. This type of close is often interpreted by traders as evidence that bearish participation has taken control of the pattern. Whether a trader enters immediately or waits for a retest, the priority becomes identifying the levels that will structure the trade: the area of invalidation, the downside objective, and the points where risk must be controlled.
A confirmed neckline break does not imply certainty about future price direction. Instead, it provides an organized framework—a map traders can use to define where their idea is considered valid and where it is considered invalid. The educational value of this pattern lies not in its ability to predict, but in its ability to help traders pre-plan actions with clarity.
Structuring the Bearish Entry: Neckline Retests and Resistance Zones
One of the most common approaches to trading a bearish head and shoulders is to monitor for a modest bounce back toward the neckline after the breakdown. Retests do not always occur, but when they do, many traders see them as opportunities to enter with more control over the distance between entry and stop.
In this example, price sits beneath a well-defined UFO resistance area between 1123 and 1136. This band aligns with a cluster of unfilled sell orders, which may reinforce bearish pressure if price attempts to climb. More importantly, the upper boundary of the zone—1136—serves as an objective point of invalidation. If price were to move above that level, the logic of the completed bearish structure would no longer hold. Therefore, traders could use this upper boundary as a stop-loss level. It is neither arbitrary nor emotional; it is derived directly from the structure.
This type of predefined invalidation is essential because even the cleanest technical patterns can fail. The purpose of using a pattern is not to guarantee the outcome, but to know exactly when the trade thesis no longer makes sense. In this framework, the neckline provides context for the entry, while the resistance zone provides clarity for where the idea is wrong.
Defining the Target: Gap Alignment and Technical Confluence
After establishing where a trade becomes invalid, traders turn to the question of where it becomes complete. In pattern-based trading, target selection often blends classical measurement rules with the identification of technical areas where price has reason to react. In this case study, the downside objective centers on 1070'4, where two important elements align.
First, there is an open gap at this price level. Gaps frequently attract price because they represent prior imbalances in trading activity—areas where the market moved too quickly for participants to fully transact. When price revisits such a location, it becomes a zone where activity may increase. Second, the gap coincides with a region of unfilled buy orders that may serve as a UFO support area. When gaps and demand zones overlap, the confluence strengthens the rationale for using the level as a target.
Because the bearish pattern is already confirmed, traders using this structure may calculate a reward-to-risk ratio by comparing the distance from the entry zone to the stop (near 1136) and the distance from the entry zone to the target (1070'4). The role of the target is not to predict where price will go, but to anchor the trade in a predefined and measurable plan. It transforms the setup into a risk-managed scenario rather than an open-ended directional hope.
Understanding Contract Specs, Margin, and Risk Management
Traders using standardized futures contracts must structure their decisions around contract size, tick value, and margin requirements. The chart example in this idea uses the standard ZS contract, which represents 5,000 bushels. The micro contract (MZS) represents 500 bushels. This difference directly affects position sizing and the dollar impact of each tick. Because margin requirements vary over time, traders should always check the latest values before entering any position.
Tick (Minimum Price Fluctuation:
ZS: 1/4 of one cent (0.0025) per bushel = $12.50 per contract
MZS: 0.0050 per bushel = $2.50 per contract
Current Margin Requirements:
ZS: $2,000 per contract
MZS: $200 per contract
A key benefit of having two contract sizes available is flexibility. Traders seeking to maintain disciplined risk parameters often use micro contracts to fine-tune exposure, ensuring that the stop-loss level does not exceed their predefined risk tolerance. The objective of the head and shoulders pattern is not merely to identify a direction but to help traders organize their plan around risk boundaries. Knowing the contract’s characteristics enables the trader to size positions correctly.
Risk management remains the foundation of pattern-based approaches. Price can behave unpredictably, even when the chart seems decisive. This is why traders emphasize position sizing, controlled leverage, and strict adherence to the stop-loss level. The goal is not to avoid losses entirely but to keep them manageable and consistent. A well-constructed head and shoulders strategy relies not only on identifying the pattern but on respecting the risk parameters that accompany it.
Bringing It All Together: Structure, Context, and Discipline
The chart included in this idea illustrates the essential elements of the bearish head and shoulders setup: the left shoulder, head, and right shoulder; the neckline break; the gap at 1070'4; and the resistance band between 1123 and 1136. These levels form the backbone of a structured trading plan. Rather than reacting to market movement in real time, traders can use these predefined reference points to guide decision-making with consistency.
The purpose of this article is educational. It demonstrates how entries, exits, and risk parameters can be structured around a classical bearish head and shoulders pattern, how confluence strengthens downside targets, and how contract specifications help traders align position size with their risk tolerance. Above all, it shows that disciplined planning matters more than attempting to anticipate every price movement.
When charting futures, the data provided could be delayed. Traders working with the ticker symbols discussed in this idea may prefer to use CME Group real-time data plan on TradingView: www.tradingview.com - This consideration is particularly important for shorter-term traders, whereas it may be less critical for those focused on longer-term trading strategies.
General Disclaimer:
The trade ideas presented herein are solely for illustrative purposes forming a part of a case study intended to demonstrate key principles in risk management within the context of the specific market scenarios discussed. These ideas are not to be interpreted as investment recommendations or financial advice. They do not endorse or promote any specific trading strategies, financial products, or services. The information provided is based on data believed to be reliable; however, its accuracy or completeness cannot be guaranteed. Trading in financial markets involves risks, including the potential loss of principal. Each individual should conduct their own research and consult with professional financial advisors before making any investment decisions. The author or publisher of this content bears no responsibility for any actions taken based on the information provided or for any resultant financial or other losses.
Why Silver Is Reaching New High?Why Is Silver Reaching New Highs?”
There are two key reasons for this:
First, it is due to de-dollarization. At this juncture, there are no other currencies ready to take over as the dominant reserve currency. Therefore, the market is turning to precious metals like gold and silver. We can also observe that each time the dollar trends lower, precious metals tend to move in the opposite direction.
Second, why is silver gaining momentum over gold this time? While gold is still trading below its October high, silver has already broken above it with strong momentum.
These are the two questions we will be discussing today.
Mirco Silver Futures
Ticker: SIL
Minimum fluctuation:
0.005 per troy ounce = $5.00
Disclaimer:
• What presented here is not a recommendation, please consult your licensed broker.
• Our mission is to create lateral thinking skills for every investor and trader, knowing when to take a calculated risk with market uncertainty and a bolder risk when opportunity arises.
CME Real-time Market Data help identify trading set-ups in real-time and express my market views. If you have futures in your trading portfolio, you can check out on CME Group data plans available that suit your trading needs www.tradingview.com

AI Stocks Started Sneezing… and Indices May Have Caught a Chill?The NASDAQ (a.k.a. the AI theme park) just printed a much lower monthly low.
ES? It dipped… but only politely.
That mismatch matters. When tech acts tired, the broader market usually needs caffeine — or a correction.
The Indicators Are Whispering… and They Don’t Sound Bullish
The CCI is saying “lower highs,” while price is saying “higher highs.”
Classic divergence.
The MACD histogram is fading like holiday lights at 4 a.m.
Momentum? Not dead — just yawning.
Three Levels That Could Decide Whether Santa Shows Up
Think of December like a video game boss fight with three phases:
6,525.00 → First alarm bell. Break it and the mood changes.
6,239.50 → “Bear trap danger zone.” Plenty could happen here.
4,430.50 → The deep level nobody wants to talk about, but everyone should mark.
If ES finds its footing near 6,239.50, Santa still has a shot.
If not… well… Grinch season might come early.
ES & MES Contract Specs + Margins
E-mini S&P 500 Futures (ES)
Tick size: 0.25 index points = $12.50
Approx. margin (as of now): ~$22,400 per contract
Micro E-mini S&P 500 Futures (MES)
Tick size: 0.25 index points = $1.25
Approx. margin (as of now): ~$2,240 per contract
Margins vary by broker and can change with volatility, but these figures reflect current exchange-level requirements.
Risk Management: The Only Real Holiday Magic
ES and MES give traders the same view of the market but with different intensity levels.
December is emotional, fast, and occasionally rude — so size positions like someone who wants to enjoy the holidays, not stress through them.
Pick a zone → define the invalidation level → cap your dollar risk → choose ES or MES accordingly.
Simple. Calm. Holiday-friendly.
Final Thought
Santa hasn’t canceled the rally yet. But AI stocks aren’t exactly singing Christmas carols either.
If the tech giants recover, December could still sparkle.
If they don’t… the sleigh might need a repair shop.
Either way: chart levels > seasonal hope.
Trade safe — and maybe hide a cookie for the market, just in case.
Want More Depth?
If you’d like to go deeper into the building blocks of trading, check out our From Mystery to Mastery trilogy, three cornerstone articles that complement this one:
🔗 From Mystery to Mastery: Trading Essentials
🔗 From Mystery to Mastery: Futures Explained
🔗 From Mystery to Mastery: Options Explained
When charting futures, the data provided could be delayed. Traders working with the ticker symbols discussed in this idea may prefer to use CME Group real-time data plan on TradingView: www.tradingview.com - This consideration is particularly important for shorter-term traders, whereas it may be less critical for those focused on longer-term trading strategies.
General Disclaimer:
The trade ideas presented herein are solely for illustrative purposes forming a part of a case study intended to demonstrate key principles in risk management within the context of the specific market scenarios discussed. These ideas are not to be interpreted as investment recommendations or financial advice. They do not endorse or promote any specific trading strategies, financial products, or services. The information provided is based on data believed to be reliable; however, its accuracy or completeness cannot be guaranteed. Trading in financial markets involves risks, including the potential loss of principal. Each individual should conduct their own research and consult with professional financial advisors before making any investment decisions. The author or publisher of this content bears no responsibility for any actions taken based on the information provided or for any resultant financial or other losses.

NZD Futures Ready to Ignite?The New Zealand dollar has just posted one of its sharpest reversals since the summer, and the 6NZ5 contract is now trading solidly above 0.57. The strength of the move is striking: a rebound sparked by a less-dovish-than-expected RBNZ tone has turned into an impulse driven by the structural weakness of the US dollar and significant algorithmic repositioning.
December is also historically one of the weakest months for the greenback, creating a natural tailwind for the Kiwi. The market may be on the verge of a broader extension, but the 0.5735–0.5740 area remains a decisive pivot.
Fundamental Analysis
The RBNZ’s message remains the cornerstone of the current rally. The 25 bp cut was widely anticipated, but the central bank gave no indication of urgency to continue easing. The economy is viewed as weak but gradually improving, inflation pressures are easing, and OCR guidance will now be based on a more balanced medium-term outlook. This stance surprised markets, which had expected a more dovish signal and a prolonged easing cycle.
On the US side, USD dynamics have become the primary driver of the NZD. Markets now treat a Fed cut in December as almost guaranteed. US data are deteriorating, and the prospect of a more accommodative future Fed chair reinforces expectations of a sustained easing cycle.
Technical Analysis
The 6NZ5 has broken above 0.57, a level that acted as both horizontal resistance and a former volume-profile POC at 0.567. The market now trades just below the 0.5735–0.5740 zone corresponding to the 55DMA, a level the NZD has not managed to reclaim sustainably since the September decline.
For now, the 0.5620–0.5630 area, identified as the RBNZ reaction low, becomes a major pivot: as long as it holds, the technical bias remains bullish.
If the 55DMA is clearly breached, the next resistance levels are 0.58 and 0.5845. A sustained breakout would open the path toward 0.60, a psychological threshold also corresponding to the filling of the liquidity gap created on 17 September during the Fed event.
Recent trading activity also confirms a gradual transfer of liquidity toward higher zones, signaling accumulation rather than distribution.
Sentiment Analysis
Data from FX/CFD brokers show a balanced retail positioning on NZD/USD, although the pair remains less popular among retail traders.
On the sell-side, ANZ targets 0.58 on the NZD/USD spot. Crédit Agricole notes that December should be a difficult month for the USD, due to seasonality and global flow reallocation. For them, the bias is clearly anti-USD, indirectly supporting the NZD.
JP Morgan is more cautious. Systematic hedge funds have been buying NZD for three consecutive sessions, which supports prices. However, JPM prefers to wait for confirmation from hard data before encouraging new directional longs. In their view, the rally still relies too heavily on sentiment and flow dynamics.
Reuters analysts also note that the NZD continues to struggle with the 55-day moving average, while acknowledging that the probability of further RBNZ cuts has significantly decreased, providing a fundamental floor.
Trade Idea (6NZ5)
With the 6NZ5 contract trading at 0.572–0.573, the most coherent scenario is a conditional long, based on a confirmed break of the 55DMA.
Entry:
Wait for a clear break above 0.5740 (55DMA break + D1 close or possibly H4 close above).
Targets:
- TP1: 0.5840, just below a key resistance
- TP2: 0.5980, a natural post-breakout extension toward 0.60
Stop-loss:
Below 0.5620 (breach of the RBNZ pivot).
The trade aims to capture a persistent USD-weakness environment, renewed bullish positioning on NZD, a more neutral-than-expected central bank, and an improving technical structure. Risk is contained as the stop lies below a level explicitly defended by the market last month.
Final Thoughts
In a very short period of time, the NZD has shifted from an overlooked currency to a tactically sought-after asset. The halt in the RBNZ easing cycle, the structural weakness of the US dollar, and favourable seasonality create a window conducive to long strategies. The true test, however, remains a sustained break of the 55DMA. If the market stabilises above 0.5740, the path toward 0.58, 0.5840, and even 0.60 becomes natural. Conversely, a move back below 0.5620 would suggest the rally was merely a short-covering episode. In a market where flows are rapidly reshuffling, caution is warranted, but the continuation potential for the 6NZ5 contract remains significant.
---
When charting futures, the data provided could be delayed. Traders working with the ticker symbols discussed in this idea may prefer to use CME Group real-time data plan on TradingView: tradingview.com/cme/ .
This consideration is particularly important for shorter-term traders, whereas it may be less critical for those focused on longer-term trading strategies.
General Disclaimer:
The trade ideas presented herein are solely for illustrative purposes forming a part of a case study intended to demonstrate key principles in risk management within the context of the specific market scenarios discussed. These ideas are not to be interpreted as investment recommendations or financial advice. They do not endorse or promote any specific trading strategies, financial products, or services. The information provided is based on data believed to be reliable; however, its accuracy or completeness cannot be guaranteed. Trading in financial markets involves risks, including the potential loss of principal. Each individual should conduct their own research and consult with professional financial advisors before making any investment decisions. The author or publisher of this content bears no responsibility for any actions taken based on the information provided or for any resultant financial or other losses.
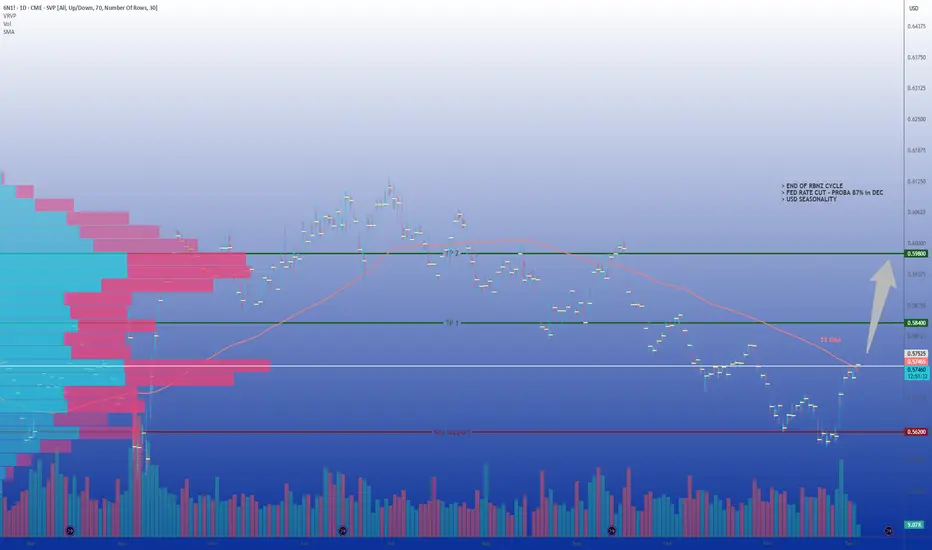
AI Stocks Weakness Could Spoil this Year’s Santa RallyAs December begins, traders worldwide are dusting off the same old question: Will we get a Santa Claus rally this year?
But 2025’s setup looks a little different. The market’s cheer seems to depend heavily on whether AI-related stocks can keep delivering miracles—and lately, the charts are suggesting they may be running out of steam.
When Tech Sneezes, the Market Catches a Cold
A quick look across U.S. equity futures shows a revealing pattern.
The E-mini NASDAQ 100 Futures (NQ), home to most AI and semiconductor giants, has posted a significantly lower monthly low compared to the prior month.
Meanwhile, the E-mini S&P 500 Futures (ES) declined much less, hinting at relative resilience, but also possible lagging weakness.
This divergence—NQ leading down while ES holds up—is a subtle warning. When the market’s growth engine (tech) loses traction, broader indices often follow with a delay. That’s the tension December traders are staring at: are we seeing the early signs of exhaustion before the holidays, or just a healthy pause?
Bearish Divergences Whisper “Caution”
The technicals are backing that cautious tone.
On the ES chart, the Commodity Channel Index (CCI) has been carving lower highs even as prices printed higher highs. This is a textbook bearish divergence, often an early sign that bullish momentum is fading.
The MACD histogram echoes the same message: momentum has been contracting through November despite new price highs, suggesting that underlying strength is eroding. Such divergences don’t predict direction on their own, but they do raise the probability of a short-term correction—or at least a choppy path into year-end.
The Price Map: Three Levels that Could Define December
Let’s outline the key technical zones traders are watching:
6,525.00: the prior monthly low—this is the first line of defense for the Santa Rally narrative. A break below this level would likely shift sentiment fast, especially if NQ continues under pressure.
6,239.50: the floor of a relevant UFO (UnFilled Orders) support zone. If ES dips below the prior low, this zone may become a “bear trap.” Many traders might short aggressively once 6,525.00 gives way, but those unfilled buy orders could absorb supply and trigger a sharp bounce. If the rally emerges from here, Santa might still make his visit.
4,430.50: a deeper UFO support cluster roughly 35% below current prices. If price were to cut through 6,239.50 and stay below it, the market would be entering a different regime altogether—likely accompanied by broken trendlines, volatility spikes, and a more defensive tone.
Reading Between the Lines: What the Divergence Means
Historically, the Santa Rally is powered by optimism, lighter volumes, and portfolio rebalancing. But this time, AI and semiconductor names—the champions of the current bull leg—are leading weakness.
That doesn’t mean doom; it means fragility.
The ES market may still rebound, but it’s doing so under reduced participation from the very sectors that drove prior gains.
Sizing the Trade Without Crossing the Line
For traders eyeing this setup through ES (E-mini S&P 500 futures) or MES (Micro E-mini S&P 500) futures, here’s a compliant, educational way to think about risk and position sizing:
Identify the Setup Zone: e.g., around 6,525.00 as potential demand, or below 6,239.50 as short-term breakdown.
Define Your Stop: the level where the technical picture is invalidated.
Set a Dollar Risk Limit: for instance, risking 1% of total account equity.
Derive Position Size: Divide your dollar risk by the price distance between entry and stop (converted into points). Then choose between the standard E-mini (ES) or Micro E-mini (MES) to match your risk tolerance and account size.
This framework lets traders adapt leverage responsibly—without needing the specific contract specs or margin figures, which vary by broker and time.
Risk Management: December Can Be a Trap
December is famous for emotional trading. The combination of holiday expectations, thinner liquidity, and year-end positioning can turn routine pullbacks into exaggerated moves.
That’s why focusing on risk before reward is critical.
The UFO support levels serve as reference zones where institutional activity might reappear, but they’re not guarantees. Managing stops, scaling out partial profits, and staying flexible matters more than trying to guess the market’s next headline.
ES and MES: Same Story, Different Scale
The Micro E-mini (MES) contract is a smaller version of the E-mini (ES), designed for traders who want the same price exposure but with lower notional size.
Both track the same index, tick for tick.
For traders exploring this December setup, the MES allows participation while controlling exposure more granularly—especially useful if volatility picks up and margin requirements shift.
Key Contracts Specs and Margins:
E-mini S&P 500 Futures (ES) with a point value = $50 per point.
Micro E-mini S&P 500 Futures (MES) with a point value = $5 per point.
As of the current date, the margin requirements for E-mini S&P 500 Futures and for the Micro E-mini S&P 500 Futures are approximately $22,400 and $2,240 per contract respectively.
Always verify the latest margin schedules and specifications directly with your broker or the exchange before entering trades, as those details update regularly and depend on market conditions.
Santa’s Setup: Scenarios to Watch
Scenario A — Santa Delivers: Price tests or slightly breaks the 6,525.00 low, finds support near 6,239.5, and rebounds into late December. Bearish divergences resolve sideways, and risk assets stabilize.
Scenario B — The Grinch Arrives: The 6,239.50 zone fails to hold, breaking trendline supports. The market slides toward 4,430.50, shaking off complacent longs and erasing part of the 2024-5 rally.
Both paths are technically valid. The difference will come from whether AI-heavy sectors regain strength—or confirm that this bull leg has indeed lost its engine.
Educational Takeaway
Divergences (CCI and MACD) highlight when momentum and price disagree—a sign of fatigue.
Intermarket analysis (ES vs. NQ) reveals where weakness may originate.
UFO levels identify potential institutional footprints—where traps or reversals often occur.
Discipline and risk control matter more than predicting whether Santa shows up.
Final Thought
Whether December brings gifts or grief may depend less on seasonal hope and more on how traders interpret these divergences.
If AI stocks can find footing again, the rally could revive. But if they keep sliding, this might be the year Santa takes a break.
When charting futures, the data provided could be delayed. Traders working with the ticker symbols discussed in this idea may prefer to use CME Group real-time data plan on TradingView: www.tradingview.com - This consideration is particularly important for shorter-term traders, whereas it may be less critical for those focused on longer-term trading strategies.
General Disclaimer:
The trade ideas presented herein are solely for illustrative purposes forming a part of a case study intended to demonstrate key principles in risk management within the context of the specific market scenarios discussed. These ideas are not to be interpreted as investment recommendations or financial advice. They do not endorse or promote any specific trading strategies, financial products, or services. The information provided is based on data believed to be reliable; however, its accuracy or completeness cannot be guaranteed. Trading in financial markets involves risks, including the potential loss of principal. Each individual should conduct their own research and consult with professional financial advisors before making any investment decisions. The author or publisher of this content bears no responsibility for any actions taken based on the information provided or for any resultant financial or other losses.

Bitcoin Corrected, What’s Next?Back in July, I did a tutorial identifying the 120,000 level as a potential peak for Bitcoin, with the possibility of an open correction. Bitcoin subsequently formed a double top before pulling back to its recent low.
In my view, Bitcoin should continue to trend along this parallel channel.
We will discuss why this is the case, and also what may come next for Bitcoin after this correction.
Mirco Bitcoin Futures and Options
Ticker: MBT
Minimum fluctuation:
$5.00 per bitcoin = $0.50 per contract
Disclaimer:
• What presented here is not a recommendation, please consult your licensed broker.
• Our mission is to create lateral thinking skills for every investor and trader, knowing when to take a calculated risk with market uncertainty and a bolder risk when opportunity arises.
CME Real-time Market Data help identify trading set-ups in real-time and express my market views. If you have futures in your trading portfolio, you can check out on CME Group data plans available that suit your trading needs www.tradingview.com

Ether Breaks the Ceiling: Is This the First Real Clue of a Turn?Ether Futures just pulled an interesting move — it finally pushed above the upper edge of the stubborn gap that has been capping price below 2853.5.
For a while, ETH was sliding down the lower Bollinger Band like a chilled skier who forgot how to turn. Now? It just jumped over the fence.
This changes things. A gap break doesn’t guarantee a trend reversal, but it’s the market’s way of saying:
“Hey, sellers… your seat might not be reserved anymore.”
The Old Barrier Is Now the New Test
That closed gap was acting like a reinforced ceiling. Buyers hitting their heads on it didn’t get far — until now. Trading above 2853.5 means the market is testing whether:
Sellers still have ammunition
Buyers can hold the reclaimed turf
Momentum is finally shifting gears
A close and hold above this zone is usually where early reversal logic starts to form.
Next Target: UFO Resistance at 3376.5
If buyers keep control, the next structural “magnet” is near 3376.5, where a cluster of unfilled sell orders waits. Markets love revisiting old unfinished business, and this is the next shelf of potential friction.
It’s not a prediction — it’s just where the roadmap naturally leads once the gap breaks.
Support Below: The New Battleground
What used to be resistance is now a potential support zone. If price pulls back toward the gap’s top edge and stabilizes, it would confirm that buyers have actually taken the wheel.
If price slips back into the gap, then this “break” was just a false alarm — the chart equivalent of stepping on a stair that wasn’t actually there.
Two Quick Read-Through Scenarios
Scenario 1 — Reversal Gains Traction
ETH stays above 2853.5
Buyers defend the reclaimed gap
Market may gravitate toward 3376.5
This would suggest the downtrend is losing its grip.
Scenario 2 — Rejection Back Into the Gap
ETH falls back below the gap ceiling
Sellers reclaim control
Market may return to prior support zones
This would keep Ether in a broader corrective environment.
The key here is not guessing — it’s waiting to see whether the breakout holds.
Futures Traders Have Two Contract Sizes to Play With
Ether Futures (ETH) are the big, fast movers.
Micro Ether Futures (MET) offer the same chart logic, but at 1/500th the size, which makes scaling more controlled.
Whether large or micro, the structure is the same — only the sizing changes.
Quick Specs (Fast & Simple)
ETH contract: 50 Ether
Tick: 0.25 per Ether = $12.50 per contract
Margin: ≈ $44,000 (varies)
MET contract: 1/500th of ETH (good for precision adjustments)
Bottom Line — The Story Just Got Interesting
For the first time in a while, Ether has stopped drifting and started acting. Breaking above the upper gap is the market’s first real sign of a potential power shift.
Now the question becomes simple:
Can buyers hold the line they just captured?
If yes → the path toward 3376.5 opens.
If no → the market falls back into its old bearish rhythm.
Either way, the quiet slide is over — this is where things get lively.
Want More Depth?
If you’d like to go deeper into the building blocks of trading, check out our From Mystery to Mastery trilogy, three cornerstone articles that complement this one:
🔗 From Mystery to Mastery: Trading Essentials
🔗 From Mystery to Mastery: Futures Explained
🔗 From Mystery to Mastery: Options Explained
When charting futures, the data provided could be delayed. Traders working with the ticker symbols discussed in this idea may prefer to use CME Group real-time data plan on TradingView: www.tradingview.com - This consideration is particularly important for shorter-term traders, whereas it may be less critical for those focused on longer-term trading strategies.
General Disclaimer:
The trade ideas presented herein are solely for illustrative purposes forming a part of a case study intended to demonstrate key principles in risk management within the context of the specific market scenarios discussed. These ideas are not to be interpreted as investment recommendations or financial advice. They do not endorse or promote any specific trading strategies, financial products, or services. The information provided is based on data believed to be reliable; however, its accuracy or completeness cannot be guaranteed. Trading in financial markets involves risks, including the potential loss of principal. Each individual should conduct their own research and consult with professional financial advisors before making any investment decisions. The author or publisher of this content bears no responsibility for any actions taken based on the information provided or for any resultant financial or other losses.
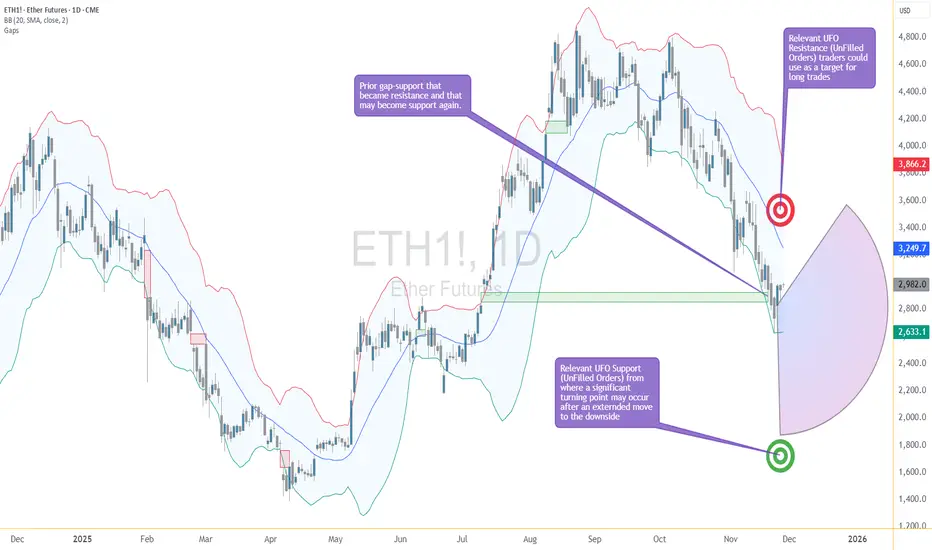
Crypto Walking the Edge: Will the Band Snap or Stretch Lower?Ether Futures (ETH) continue to tell a story of controlled pressure — one that traders have seen before across many markets, but rarely with this level of composure. The selling has been persistent, yet measured, and despite the depth of the decline, Ether has remained remarkably disciplined within its volatility structure. In short, price is walking the lower Bollinger Band — and doing it with intent.
The Market’s Controlled Descent
When an asset walks the lower Bollinger Band, it signals a market under steady directional momentum. The band represents volatility boundaries built around a moving average; hugging its lower edge reflects consistent downside force without capitulation. In Ether’s case, the message is clear — bears are in charge, but not panicking.
This pattern of orderly decline can be deceptive. It often convinces traders that “it can’t go lower” simply because volatility seems contained. Yet, in technical behavior, containment isn’t comfort — it’s momentum management. Until the market detaches from the band and closes above the midline, downside potential remains valid.
The Downside Magnet — UFO Support at 1883.0
Beneath the current price structure lies a level of particular interest: 1883.0. This is not just another number on the chart; it marks a UFO (UnFilled Orders) zone — an area where unexecuted buy orders from prior trading sessions may still be sitting.
Such levels often act as demand magnets. Price gravitates toward them as liquidity seeks to rebalance. If ETH continues its gradual descent, 1883.0 could act as a “final test” of demand strength. Traders currently short may view this area as a logical place to take profits or reduce exposure, while contrarian participants might monitor it for early signs of stabilization.
Walking the Edge — Bollinger Band Dynamics
The Bollinger Band is more than a volatility envelope; it’s a behavioral tool. Price hugging the lower band isn’t a reversal signal on its own. It shows persistent imbalance — sellers are comfortable pressing until they meet true counterflow demand.
The key observation isn’t where Ether trades, but how it interacts with the band:
If the band widens while Ether stays glued to its edge, volatility expansion favors continuation.
If the band narrows and Ether starts oscillating away from it, compression signals the potential for reversal.
At present, Ether remains on the outer lane — still walking the edge, with no confirmed volatility squeeze yet in play.
The Reversal Trigger — The Gap Between 2853.5–2769.0
Ether’s chart carries memory — and that memory is marked by the closure of a previously open gap between 2853.5 and 2769.0. Gaps represent unbalanced zones where the market skipped transactions, often leaving behind psychological resistance.
As long as ETH remains below 2769.0, bearish pressure dominates. A decisive close through the 2853.5 boundary would, however, suggest sellers have lost control. That event could flip the zone from resistance to support — the technical definition of a reversal confirmation.
Until that happens, Ether continues to operate in a bearish environment within its Bollinger framework, respecting lower boundaries and testing demand without capitulation.
The Upside Magnet — UFO Resistance at 3376.5
If the market does achieve a confirmed reversal through the gap zone, the next structural target stands near 3376.5. This region contains a UFO resistance cluster, where unfilled sell orders may wait to re-engage.
This becomes the “upside magnet” in the event of a bullish shift. Not as a forecast, but as a conditional marker — if price proves it can break through 2853.5, the 3376.5 zone becomes the next logical test for momentum sustainability.
Case Study: Risk Structure and Trade Framing
The beauty of futures markets lies in flexibility. Traders can define clear structural zones, build conditional scenarios, and design reward-to-risk ratios before any entry occurs. Ether’s chart currently offers two educational case studies:
Scenario 1 — Continuation Setup
If ETH continues trading below 2769.0, the bearish structure remains intact. Traders could study how price behaves as it approaches 1883.0 to understand profit-taking dynamics or potential trend exhaustion.
Scenario 2 — Reversal Setup
If ETH breaks and closes above 2853.5, the tone changes. It implies the market has absorbed overhead supply, opening the path toward 3376.5. In this case, risk would typically be defined below the reclaimed gap zone, maintaining a controlled risk ratio.
Whichever scenario unfolds, the discipline lies not in prediction but in preparation — in defining “if this, then that” logic.
Contract Specifications
To understand how traders express these views, it helps to revisit how Ether Futures work on CME.
Ether Futures (ETH)
Contract size: 50 Ether with a minimum tick: 0.25 per Ether = $25 per contract
Trading hours: Nearly 24 hours a day, Sunday to Friday, on CME Globex
Margin requirement: approximately $44,000 per contract (subject to changes)
For traders seeking smaller capital exposure, CME also lists Micro Ether Futures (MET) — 1/500th the size of the standard contract. This smaller format offers precision for testing setups, scaling positions, or managing margin during high volatility periods. Importantly, both ETH and MET track the same underlying price behavior, allowing consistent technical interpretation across sizes.
Managing Risk — Beyond Price Targets
Regardless of contract size, effective futures trading is a balance between conviction and constraint. Every trade requires three coordinates before execution:
Entry — based on objective price structure or confirmation.
Exit — determined by invalidation, not emotion.
Size — calibrated to volatility and margin.
A well-structured plan incorporates all three. For instance, a trader eyeing ETH’s move toward 1883.0 should define exit conditions before entry — not after volatility spikes. The same logic applies if Ether were to reclaim 2853.5 and aim higher; stop placement must be systematic, not spontaneous.
Ether Futures in Market Context
Ether’s futures market has become one of the clearest barometers of institutional sentiment in crypto. It reflects not retail enthusiasm but structured positioning, hedging, and liquidity management. The current price behavior — a slow, calculated descent — signals strategic repositioning rather than panic liquidation.
This distinction matters. Markets driven by liquidation collapse violently and rebound sharply. Markets driven by reallocation, like the current Ether environment, tend to evolve gradually — a series of tests, pauses, and measured reactions. Recognizing this tempo helps traders align their strategies with the rhythm of institutional order flow.
Summary — The Market Still Walking the Edge
Ether’s structure can be summarized in three key technical zones:
1883.0: Demand magnet and potential exhaustion level.
2853.5–2769.0: The gap resistance band — critical reversal gate.
3376.5: Major resistance cluster and next test if reversal unfolds.
As long as Ether remains below the gap zone, momentum remains under bearish control. If it trades through and holds above, a structural shift may begin. Until then, the market keeps “walking the edge” — respecting volatility, testing support, and waiting for conviction.
When charting futures, the data provided could be delayed. Traders working with the ticker symbols discussed in this idea may prefer to use CME Group real-time data plan on TradingView: www.tradingview.com - This consideration is particularly important for shorter-term traders, whereas it may be less critical for those focused on longer-term trading strategies.
General Disclaimer:
The trade ideas presented herein are solely for illustrative purposes forming a part of a case study intended to demonstrate key principles in risk management within the context of the specific market scenarios discussed. These ideas are not to be interpreted as investment recommendations or financial advice. They do not endorse or promote any specific trading strategies, financial products, or services. The information provided is based on data believed to be reliable; however, its accuracy or completeness cannot be guaranteed. Trading in financial markets involves risks, including the potential loss of principal. Each individual should conduct their own research and consult with professional financial advisors before making any investment decisions. The author or publisher of this content bears no responsibility for any actions taken based on the information provided or for any resultant financial or other losses.
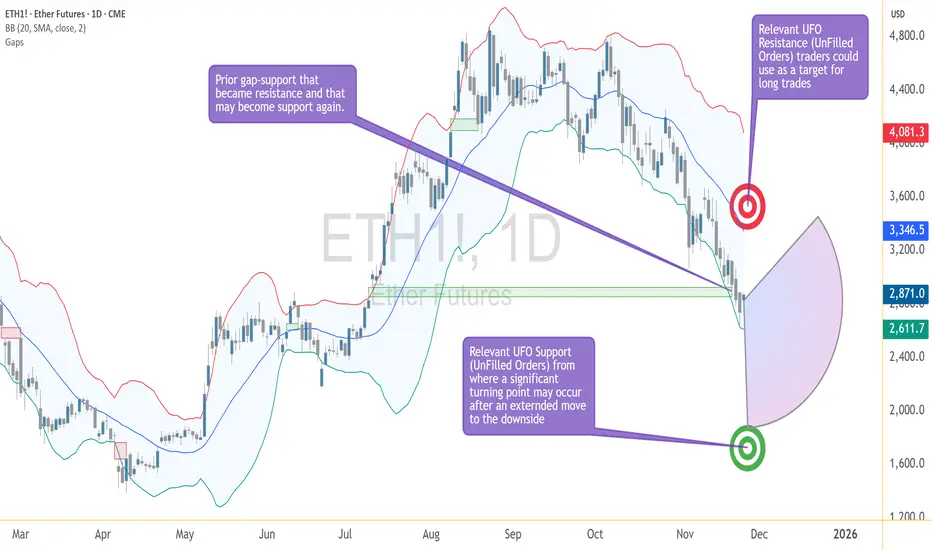
JPY collapse loading?The yen is entering a phase of maximum turbulence: deteriorating fundamentals, a deeply asymmetric options market, a sell-side community unanimously targeting 160+ on spot, and Japanese authorities trapped in a rhetoric-heavy but action-light stance. Full breakdown below.
Fundamental Analysis
The fundamental backdrop for the yen remains clearly tilted toward sustained weakness, as the previously dominant FED-cut/BOJ-hike narrative loses traction.
The Bank of Japan continues to adopt an extremely cautious posture, with an even more accommodative tilt reinforced by recent signals from the Takaichi government. At the same time, expectations for another Fed rate cut in 2025 keep diminishing, with markets increasingly pricing a December hold. This shift removes one of the few supportive angles for the yen and re-anchors monetary policy divergence in favour of the US dollar.
Japanese authorities have intensified their verbal intervention to one of the highest levels seen in recent years. However, this escalation has not altered the market’s dominant assumption: no real intervention before USD/JPY reaches 160. Official warnings about “speculative moves” have done little to curb investor appetite, as market participants openly test policymakers’ tolerance levels. The lack of coherence between the Ministry of Finance’s alarmist tone and the absence of concrete action only strengthens this perception.
Portfolio flows also work against the yen. Japanese institutional investors continue to prioritise foreign asset allocation, keeping the basic balance in a structurally negative position. This persistent capital outflow acts as a continuous fundamental headwind.
Overall, the macro pressure remains aligned against the yen, anchored by a remarkably unfavourable policy differential. The Bank of Japan shows very few signs of preparing meaningful tightening. Conversely, the Fed is increasingly perceived as maintaining restrictive policy longer than anticipated. The probability of a rate cut in December 2025 keeps fading, reinforcing the baseline scenario of the federal funds corridor staying within 375–400 bps. This environment structurally sustains the dollar’s yield advantage, making any durable yen rebound difficult to justify without a major policy shift from Tokyo.
Technical Analysis
On the technical front, the yen is breaking support levels one after another without hesitation, heading back toward the annual lows recorded in January.
If momentum accelerates further, the next major support sits around 0.00625, a level already tested unsuccessfully in July 2024. A clean break below this threshold would likely open the path toward even lower levels, given the lack of meaningful historical congestion zones below it.
Sentiment Analysis
Among FX/CFD brokers, retail traders, who typically sell into rallies, are unsurprisingly heavily short USD/JPY, and thus long yen, with approximately 70% of positions betting on a reversal.
With the CFTC COT report still unavailable due to the US government shutdown, sell-side positioning provides valuable insight. Major FX banks remain strongly aligned on a bearish JPY narrative, with consensus calling for further gains in USD/JPY toward 158.90, 160, and even 161.96.
JP Morgan states that it is “hard to be anything other than short JPY,” recommending bearish positioning through options to better capture potential acceleration. Bank of America also maintains a structurally negative view on the yen, citing an overly cautious BOJ, a government inclined toward looser policy, and persistent capital outflows. Crédit Agricole notes that intervention rhetoric is at extremely elevated levels but stresses that markets remain largely unbothered by the possibility of real action below 160.
The broad takeaway: positioning, narratives, and institutional sentiment overwhelmingly favour further yen weakness.
CME Options Analysis
The open-interest heatmap highlights a markedly unbalanced structure confirming the market’s bearish bias on the yen.
The largest concentrations lie in put options at strikes below current levels, particularly at 0.00625 and 0.0062. These clusters, amounting to several thousand contracts, signal investors are either hedging against or actively positioning for another leg of USD strength versus JPY. Meanwhile, the absence of significant call volumes above market prices confirms the lack of any meaningful option barrier that would support a yen rebound.
This configuration underscores clear asymmetry: markets view continued yen depreciation as the more probable path and appear increasingly wary of a sharp downward break.
Trade Idea
Friday’s mild pullback (21/11) offers an entry opportunity for short exposure on the 6JZ5 contract, with 0.00625 and potentially 0.0062 as targets. A daily close above 0.006575 would invalidate the scenario.
Final Thoughts
The market continues to test the patience of the Japanese Ministry of Finance, yet without credible action from either the BOJ or the government, little resistance seems capable of blocking the dollar’s advance against the yen. Positioning, options structures, and flow dynamics all heavily support continuation, where each consolidation appears more like a pause within a structural trend than the start of a reversal.
The key risk now is the prospect of a delayed but forceful reaction from Tokyo should the situation become disorderly.
---
When charting futures, the data provided could be delayed. Traders working with the ticker symbols discussed in this idea may prefer to use CME Group real-time data plan on TradingView: tradingview.com/cme/ .
This consideration is particularly important for shorter-term traders, whereas it may be less critical for those focused on longer-term trading strategies.
General Disclaimer:
The trade ideas presented herein are solely for illustrative purposes forming a part of a case study intended to demonstrate key principles in risk management within the context of the specific market scenarios discussed. These ideas are not to be interpreted as investment recommendations or financial advice. They do not endorse or promote any specific trading strategies, financial products, or services. The information provided is based on data believed to be reliable; however, its accuracy or completeness cannot be guaranteed. Trading in financial markets involves risks, including the potential loss of principal. Each individual should conduct their own research and consult with professional financial advisors before making any investment decisions. The author or publisher of this content bears no responsibility for any actions taken based on the information provided or for any resultant financial or other losses.

Analysis for What’s Coming - AI Bubble Sentiment The US markets have been described as “on a rally” for quite some time. I would not agree if it is meant to describe the overall US market, but would agree if it refers specifically to AI or tech stocks. Why?
Among the four major US indices, the Russell—representing a much broader base of US-listed companies—continues to struggle to break above its high from last year, even though the others have far surpassed it. In fact, it has since corrected by 9.5% since its all-time high just last month.
After that, the other indices are also following suit only in the past few days, breaking below this uptrend that started in April.
Micro E-mini Russell 2000 Index
Ticker: M2K
Minimum fluctuation:
0.10 index points = $0.50
Disclaimer:
• What presented here is not a recommendation, please consult your licensed broker.
• Our mission is to create lateral thinking skills for every investor and trader, knowing when to take a calculated risk with market uncertainty and a bolder risk when opportunity arises.
CME Real-time Market Data help identify trading set-ups in real-time and express my market views. If you have futures in your trading portfolio, you can check out on CME Group data plans available that suit your trading needs www.tradingview.com

Massive Put Wall at 1.30Sterling is entering a critical zone where fiscal tensions, macroeconomic fragility, and unfavorable technical signals overlap. The 6BZ5 contract is moving along the edge of a structural threshold that could shape the trajectory of the coming weeks. As the UK budget approaches and monetary divergence between the Bank of England and the Fed widens, listed options, retail sentiment, and market microstructure collectively reinforce the scenario of a market vulnerable to a downside acceleration if support breaks.
Fundamental analysis
The fundamental backdrop remains unfavorable for the pound, driven by a convergence of domestic and external pressures. In the UK, fiscal credibility has once again become a central issue: contradictory announcements on taxation, rumors of future tax increases followed by reports of a reversal, have revived doubts about the coherence of the government’s economic strategy. This uncertainty has triggered a sharp rise in gilt yields, signaling an increased risk premium on UK assets. Markets are also focused on the 26 November budget, perceived as a major catalyst. A presentation judged insufficiently rigorous could reignite concerns around a “UK risk premium” and amplify sterling weakness.
The Bank of England adds another layer of fragility: the combination of a slowing labor market, improving inflation dynamics, and deteriorating activity indicators strengthens expectations of monetary easing. Markets now assign more than a 75% probability to a rate cut in December, which mechanically weighs on the currency.
By contrast, the Fed maintains a relatively more restrictive stance, supported by the resilience of the US macroeconomic environment and the gradual return of economic publications after the shutdown. This policy divergence continues to favor the dollar and limits rebound attempts in GBP.
Technical Analysis
The technical setup shows a clearly bearish and vulnerable structure below 1.32, with price firmly trading under the 20-day moving average, which now acts as dynamic resistance and could guide price action toward a major level at 1.30.
Below that zone, the Volume Profile reveals a deep liquidity vacuum between 1.285 and 1.27, an area likely to attract prices rapidly in the event of a breakout.
Sentiment Analysis
Aggregated FX/CFD broker data shows that roughly 60–65% of retail traders are currently long, an elevated level indicating a broad attempt to “buy the dip.” Historically, such a long-heavy bias tends to be interpreted contrarian: when retail traders buy aggressively into a falling market, the probability of further downside increases.
The context complicates broader positioning analysis because the US government shutdown has interrupted COT publications, depriving markets of their usual source on institutional speculative positioning.
Nevertheless, most major FX bank analyses consider that rebounds remain fragile and that the broader bias still leans toward additional downside pressure, particularly in the run-up to the 26 November budget.
Options analysis
Activity in listed options highlights a massive cluster of puts around 1.30, now the mechanical pivot of the market. This level concentrates most of the dealers’ negative gamma: as the spot approaches it, dealers must sell GBP/USD to hedge their exposure, which naturally pulls spot toward 1.30. This zone therefore acts not as a technical magnet, but a microstructural one.
A clean break would amplify this dynamic: delta would fall sharply, forcing market makers to increase hedging, generating a self-reinforcing wave of selling pressure. In effect, 1.30 is more than a support level; it is the key threshold to monitor and a potential point of structural rupture.
Trade idea
While more aggressive traders may consider short positions already, a more disciplined approach favors waiting for a confirmed break below 1.30 before initiating a short targeting 1.2715, with the aim of quickly filling the volume gap, supported by abundant stop-loss clusters and put positions in that area. This scenario would be invalidated by a daily close above 1.32.
Final thoughts
The 6BZ5 contract sits at the intersection of macro, technical, and microstructural forces that all converge toward an elevated risk of breakdown. Dollar strength, the UK’s uncertain fiscal credibility, a Bank of England now oriented toward easing, and a retail market saturated with long positions together create a fragile environment. The 1.30 level concentrates stops, dealer gamma, and a clear liquidity vacuum, making it the central pivot point of the moment. A decisive break would open an almost unobstructed path toward 1.2715. Conversely, only a solid daily close above 1.32 would neutralize the bearish bias.
---
When charting futures, the data provided could be delayed. Traders working with the ticker symbols discussed in this idea may prefer to use CME Group real-time data plan on TradingView: tradingview.com/cme/ .
This consideration is particularly important for shorter-term traders, whereas it may be less critical for those focused on longer-term trading strategies.
General Disclaimer:
The trade ideas presented herein are solely for illustrative purposes forming a part of a case study intended to demonstrate key principles in risk management within the context of the specific market scenarios discussed. These ideas are not to be interpreted as investment recommendations or financial advice. They do not endorse or promote any specific trading strategies, financial products, or services. The information provided is based on data believed to be reliable; however, its accuracy or completeness cannot be guaranteed. Trading in financial markets involves risks, including the potential loss of principal. Each individual should conduct their own research and consult with professional financial advisors before making any investment decisions. The author or publisher of this content bears no responsibility for any actions taken based on the information provided or for any resultant financial or other losses.
