Crypto Futures Trading LowerVolatility has been a main talking point over the last few days looking at many markets across different asset classes, and that volatility has stayed present in the Crypto futures markets starting off this week. Bitcoin futures have seen a steady increase in price since the lows in April and were able to climb to a new all time high price at the beginning of the month over $127,000. Since hitting that price, the market has been driven lower through previously significant levels and is trading lower today by about 3.7%. This downtrend is not just for Bitcoin futures, but also Ether, XRP, and Solana futures as well.
Looking at the other Crypto futures outside of Bitcoin, XRP has had the most dramatic selling pressure of the 4 products and is now trading right near the level it was trading at when the futures contract was launched after selling off 7% on the day today. Ether futures are also trading lower by over 6% on the day today after reaching a new all time high price back in August. These products often see significant volatility and the momentum has seemed to have shifted to the downside, and traders will be looking for a catalyst to send prices back higher before the end of the year.
*CME Group futures are not suitable for all investors and involve the risk of loss. Copyright © 2023 CME Group Inc.
**All examples in this report are hypothetical interpretations of situations and are used for explanation purposes only. The views in this report reflect solely those of the author and not necessarily those of CME Group or its affiliated institutions. This report and the information herein should not be considered investment advice or the results of actual market experience.
Microfutures

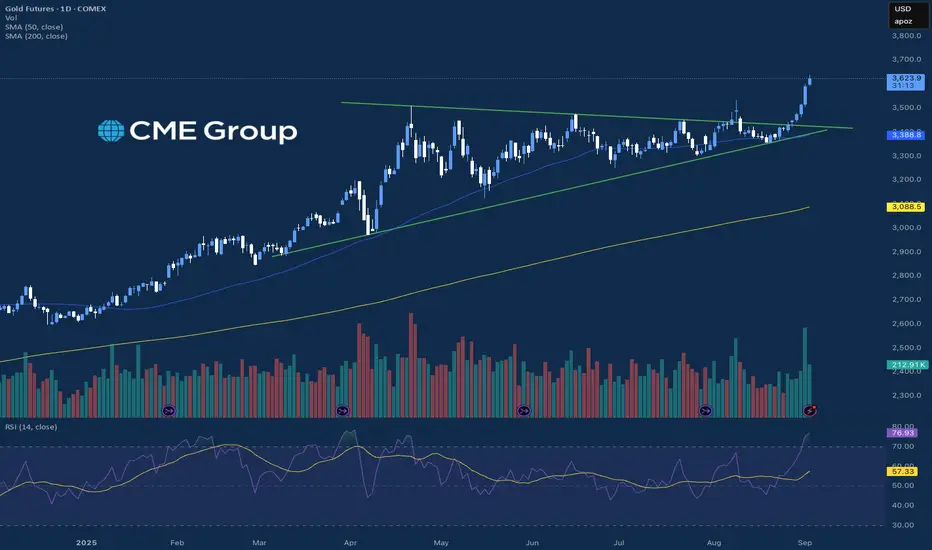
Has Gold Reached Its Fullest Potential?Has gold reached its fullest potential? It depends on the US dollar.
As we can see when dollar declines, gold went up.
i) From 2001 to 2011, when dollar was down, gold went up.
ii) From 2017 to 2020, when dollar was down, gold went up.
iii) And from 2022 to current, when dollar is down, gold is up.
With de-dollarization, this also means gold may have more upside potential.
Mirco Gold Futures and Options
Ticker: MGC
Minimum fluctuation:
0.10 per troy ounce = $1.00
Disclaimer:
• What presented here is not a recommendation, please consult your licensed broker.
• Our mission is to create lateral thinking skills for every investor and trader, knowing when to take a calculated risk with market uncertainty and a bolder risk when opportunity arises.
CME Real-time Market Data help identify trading set-ups in real-time and express my market views. If you have futures in your trading portfolio, you can check out on CME Group data plans available that suit your trading needs www.tradingview.com

Japanese Yen Sharp SelloffOver the last few months, there has been a narrative that many currencies around the world have been bouncing to the upside because of the weakness in the Dollar, and that may be changing in the short term looking at the Japanese Yen futures. Over the last 4 trading days, the contract has dropped significantly falling below the 50-day moving average and the 200-day moving average, and the 200-day moving average has acted as a “floor” in the market where buyers have stepped in since it crossed over it in February. The market also broke below a trendline that goes back to January and has drawn a lot of attention from traders across the globe.
There were a few reasons why this market may have broken to the downside, and through significant levels, and the first one has been the general strength in the Dollar over the past few days which has been boosted by rising treasury yields in the U.S. Outside of Dollar strength, there has been a political shift in Japanese leadership where it is expected that there will be more aggressive government spending which would hurt the currency market relative to the Dollar. Although the market has seen the drop significantly lower, the relative strength on a daily basis remains in neutral territory and is trading well above the low for the year, so traders will be keeping an eye for continued selling pressure if strength in the Dollar continues.
If you have futures in your trading portfolio, you can check out on CME Group data plans available that suit your trading needs tradingview.com/cme/
*CME Group futures are not suitable for all investors and involve the risk of loss. Copyright © 2023 CME Group Inc.
**All examples in this report are hypothetical interpretations of situations and are used for explanation purposes only. The views in this report reflect solely those of the author and not necessarily those of CME Group or its affiliated institutions. This report and the information herein should not be considered investment advice or the results of actual market experience.

Key support at 1.3330, bulls eye 1.3570-1.3630The British pound is trading at a turning point, with futures consolidating after rebounding from late-September lows. The Fed’s shift toward potential rate cuts contrasts with the Bank of England’s reluctance to ease, giving sterling short-term support while leaving medium-term risks intact. Technically, the market is confined within a clear corridor, while sentiment signals remain mixed: retail traders are largely short, a contrarian bullish sign, whereas institutional flows are split between asset managers and leveraged funds. Options activity adds another dimension, with heavier open interest in puts but greater premium flows into calls, creating an area of attraction around 1.3450–1.3550. Taken together, these factors suggest a market in balance, with the next decisive move likely to come from a break outside this range.
Fundamental Analysis
The current GBP/USD dynamics are largely driven by the policy divergence between the Federal Reserve and the Bank of England, against a backdrop of U.S. political uncertainty and the UK’s fiscal constraints.
On the U.S. side, the Fed has maintained a restrictive stance, but market expectations are shifting toward two rate cuts by the end of 2025, supported by cooling inflation and signs of slower activity. The looming U.S. government shutdown has added volatility, but overall it tends to weigh on the dollar in the near term.
In contrast, the Bank of England remains constrained by persistent inflation, particularly in services and food, leaving little room to consider rate cuts in the short run. Recent BoE commentary indicates that rates are likely to stay elevated for longer, even as UK growth shows signs of weakness.
In essence, the Fed appears to be moving toward a more accommodative path while the BoE maintains a hawkish bias to contain inflation. This divergence supports sterling in the short term. However, the UK still faces structural headwinds such as a large current account deficit and fiscal pressures, which could cap medium-term upside for the pound.
Technical Analysis
On the December contract, the technical structure remains dominated by a wide congestion area around 1.3440, identified as a key volume control point. As long as prices hold above this level, the bias remains moderately positive, supported by visible buying volume on recent rebounds. Immediate resistance stands at 1.3490–1.3525, which corresponds to the 100-DMA on spot and the 50% retracement of the 1.3726–1.3324 move. Beyond that, the 1.3570–1.3630 area (61.8% Fib and upper Bollinger band) marks the next critical barrier. On the downside, 1.3425 and especially 1.3330 (September 25 low) act as major supports: a break would reopen a bearish bias toward 1.3260. In summary, the immediate trend remains fragile but constructive, with direction hinging on a decisive breakout above 1.3525.
Sentiment Analysis
Sentiment on GBP/USD remains mixed across market participants. Among FX/CFD brokers, around two-thirds of retail traders are short, which sends a contrarian signal leaning bullish in the short term. However, COT data shows the opposite picture: asset managers hold a significant net short position (-44,909), reflecting structural caution toward the UK’s economic and fiscal outlook, while leveraged funds maintain a net long position (+27,662), betting more on tactical rebounds. This divergence between retail, speculative, and institutional flows creates a polarized market, prone to volatility spikes.
Options Activity
On the current expiry, option activity shows an interesting contrast. Open interest is heavier on the put side, highlighting demand for downside protection. However, in terms of premiums paid, calls clearly dominate, suggesting traders are willing to spend more to capture potential upside. The densest clusters of open interest are found around 1.3350–1.3400 for puts and 1.3450–1.3550 for calls, creating a key technical corridor. In short, the market keeps safety nets in place against a drop, but the premium flows reveal a moderate bullish bias, with expectations leaning toward further gains if spot holds above 1.3450.
Trade Idea
Direction: Long GBP futures (6BZ5) while above 1.3450
Entry Zone: 1.3460–1.3480, just above the key support cluster
Take Profit (TP1): 1.3570, aligning with 61.8% Fib retracement and option OI cluster
Take Profit (TP2): 1.3630, upper Bollinger band and stronger resistance zone
Stop Loss (SL): Close below 1.3330, which invalidates the support and reopens the 1.3260 risk
Final Thoughts
Sterling futures are at an important crossroads, caught between supportive short-term dynamics and persistent structural headwinds. On the fundamental side, the dollar’s softer tone, driven by expectations of Fed rate cuts, has provided the pound with breathing space, while the Bank of England’s reluctance to ease keeps policy divergence working in sterling’s favor. Technically, however, the market remains capped by heavy resistance around 1.3570–1.3630, a zone reinforced by Fibonacci levels, moving averages, and historical supply. Sentiment adds to the mixed picture: retail traders leaning short point to contrarian upside risk, but institutional positioning highlights lingering caution. Meanwhile, options activity reveals a market hedged against downside but increasingly willing to pay for upside exposure, anchoring prices in a corridor between 1.3450 and 1.3550.
In this environment, sterling’s path will likely be shaped by which side of this corridor breaks first. Until then, buying dips above 1.3450 with disciplined stops offers the cleaner tactical play.
---
When charting futures, the data provided could be delayed. Traders working with the ticker symbols discussed in this idea may prefer to use CME Group real-time data plan on TradingView: tradingview.com/cme/ .
This consideration is particularly important for shorter-term traders, whereas it may be less critical for those focused on longer-term trading strategies.
General Disclaimer:
The trade ideas presented herein are solely for illustrative purposes forming a part of a case study intended to demonstrate key principles in risk management within the context of the specific market scenarios discussed. These ideas are not to be interpreted as investment recommendations or financial advice. They do not endorse or promote any specific trading strategies, financial products, or services. The information provided is based on data believed to be reliable; however, its accuracy or completeness cannot be guaranteed. Trading in financial markets involves risks, including the potential loss of principal. Each individual should conduct their own research and consult with professional financial advisors before making any investment decisions. The author or publisher of this content bears no responsibility for any actions taken based on the information provided or for any resultant financial or other losses.

Euro Slow Rise HigherSince the market found a near term bottom back in January, the Euro has seen strong gains to the upside. There are many factors that have helped not only boost the Euro, but also other currencies globally, and one of which has been broad weakness in the Dollar. There are a lot of concerns looming that are still unpredictable, including potential interest rate cuts for the remainder of the year, tariff decisions, and global tensions. It is also important to understand the price compared to historic prices, and even though the price has been rising, the market has been in a downtrend for some time looking back to the early 2000s.
Fresh from the Trading Room: As path changes
Looking more at the technical levels can tell a similar story as well. The Euro traded out above the 200-day moving average back in March, and since then the market has not dipped down below that level and has also respected the 50-day moving average as a sort of "support" level where prices have rebounded back out above it after testing it to the downside. Along with that, the 1.16 level acted as resistance and has now flipped to a level the market has bounced off of and is now acting as support. There are a lot of factors that can change the trajectory of this market, but seeing prices moving slowly higher while relative strength remains in neutral territory shows a lot of strength.
If you have futures in your trading portfolio, you can check out on CME Group data plans available that suit your trading needs tradingview.com/cme/
*CME Group futures are not suitable for all investors and involve the risk of loss. Copyright © 2023 CME Group Inc.
**All examples in this report are hypothetical interpretations of situations and are used for explanation purposes only. The views in this report reflect solely those of the author and not necessarily those of CME Group or its affiliated institutions. This report and the information herein should not be considered investment advice or the results of actual market experience.

Mind the Gap! The Euro's Waiting GameShadows and Gaps: The Market’s Inside Joke
Euro FX Futures (6E, M6E) are doing that thing again… you know, when the chart leaves a Long Upper Shadow (LUS) on the weekly candle and basically whispers, “Don’t get too comfortable up here, bulls.”
Shadows this long usually mean buyers tried to party at higher levels, but sellers crashed the event and sent everyone home early. And just to make life interesting, the daily chart left an open gap below — like an unfinished side quest in a video game. Gaps are notorious for pulling price back, sooner or later, because the market hates leaving things undone.
The Setup: Simple but Sweet
Here’s how the trade idea shapes up:
Trigger: Wait for a break below 1.17865 (prior low).
Target: 1.17475 — the “gap magnet” zone.
Stop: 1.18090, based on volatility so it isn’t just a random guess.
Reward-to-Risk: Around 2:1. Clean, balanced, and not too shabby.
⚠️ Quick heads-up: right under that gap sits a support zone. Translation? Don’t overstay your welcome. Get in, fill the gap, and don’t go fishing for extra ticks where a bounce might kick you out.
Why This Combo Works
This setup is a little like peanut butter and jelly — two different flavors that just click.
Weekly chart = a big ol’ rejection shadow.
Daily chart = a gap that’s basically screaming, “Fill me!”
Put them together, and you’ve got multi-timeframe confluence — a fancy way of saying “both charts agree.” And when charts agree, traders pay attention.
Big vs. Mini: Futures Contract Fun
6E (Euro FX Futures): Big contract, €125,000. Each tick = $6.25. Great for heavy hitters.
M6E (Micro Euro FX Futures): Mini-me version, 1/10th the size. Each tick = $0.625. Perfect if you’d rather test the waters than dive headfirst.
Micros make scaling in and out a breeze, and honestly, they’re underrated for learning without risking the farm.
The Takeaway
The Euro is caught between rejection above and a magnet below. No downside break yet, but once 1.17865 goes, the path to 1.17475 could be quick.
Moral of the story? Candlestick shadows troll the highs, gaps tempt the lows, and patience is the secret sauce.
Want More Depth?
If you’d like to go deeper into the building blocks of trading, check out our From Mystery to Mastery trilogy, three cornerstone articles that complement this one:
🔗
🔗
🔗
When charting futures, the data provided could be delayed. Traders working with the ticker symbols discussed in this idea may prefer to use CME Group real-time data plan on TradingView: www.tradingview.com - This consideration is particularly important for shorter-term traders, whereas it may be less critical for those focused on longer-term trading strategies.
General Disclaimer:
The trade ideas presented herein are solely for illustrative purposes forming a part of a case study intended to demonstrate key principles in risk management within the context of the specific market scenarios discussed. These ideas are not to be interpreted as investment recommendations or financial advice. They do not endorse or promote any specific trading strategies, financial products, or services. The information provided is based on data believed to be reliable; however, its accuracy or completeness cannot be guaranteed. Trading in financial markets involves risks, including the potential loss of principal. Each individual should conduct their own research and consult with professional financial advisors before making any investment decisions. The author or publisher of this content bears no responsibility for any actions taken based on the information provided or for any resultant financial or other losses.

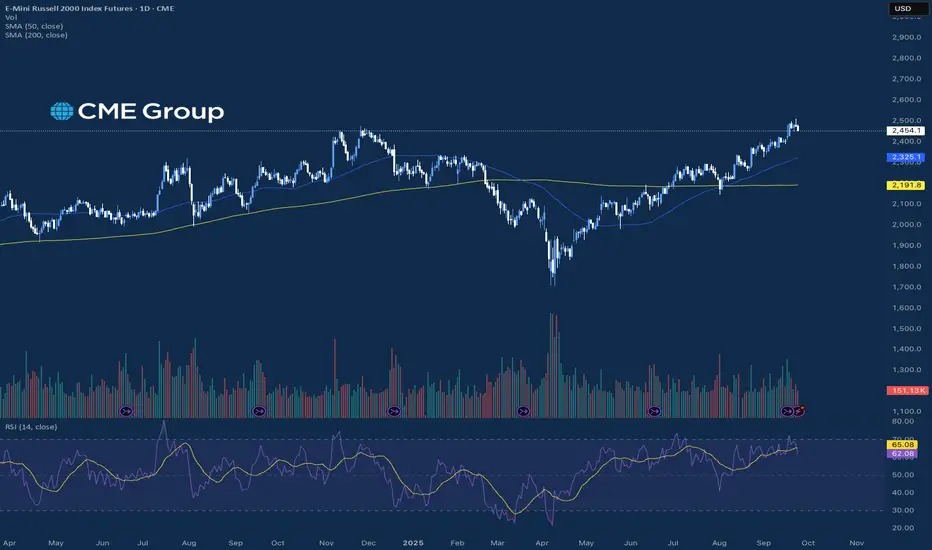
Markets Mixed Ahead of Data DayMarkets are seeing a nice mix of positive and negative moves on the day today, with the equity and precious metals markets broadly trading lower. The Russell led the equities lower trading down near 0.7% while the Gold and Silver market were lower by over 1% each on the day. Both of these markets have been making strong moves to the upside over the last few weeks, and seeing days like today coming from all time highs can be expected. New Home Sales reporting came out today and came in significantly higher than expected at 800k, which was the highest number seen since February of 2022.
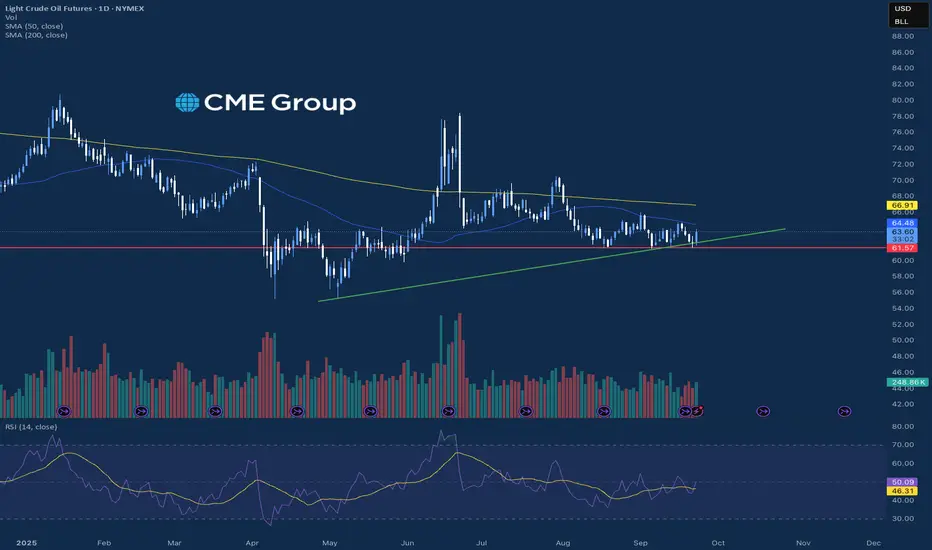
Outside of these markets, Copper saw a strong move higher trading almost 4% higher on the day due to disruptions at a major copper mine, and Crude Oil traded over 2% higher after a better than expected Crude Inventories report was released today. There is a strong slate of data being released tomorrow looking at Durable Goods and GDP, which could play a big role in the potential futures interest rate cuts for the remainder of the year from the Fed.
If you have futures in your trading portfolio, you can check out on CME Group data plans available that suit your trading needs tradingview.com/cme/
*CME Group futures are not suitable for all investors and involve the risk of loss. Copyright © 2023 CME Group Inc.
**All examples in this report are hypothetical interpretations of situations and are used for explanation purposes only. The views in this report reflect solely those of the author and not necessarily those of CME Group or its affiliated institutions. This report and the information herein should not be considered investment advice or the results of actual market experience.
Equities Cooling From All Time HighsEquity Indices are seeing selling pressure into the close today marking the first down day of the week. The selling was led by the Nasdaq which traded down near 0.6% after being the most technically “overbought” of the equity indices on a daily basis. The economic data slate today showed PMI came in slightly worse than expected, and the markets slowly traded lower throughout the session before closing. Traders also heard remarks from Fed Chair Powell where he re-emphasized some of the points from the Fed meeting last week, and also said there is no risk-free path in balancing jobs and inflation.
Outside markets saw strong movements today as well, with the precious metals continuing to move higher, looking at Gold, Silver, and Copper all moving higher and Gold and Silver recording another new all time high price. Energy markets also saw a nice move higher today as Crude Oil and Natural Gas both traded up over 2% on the day. Tomorrow, we will see economic reports on New Home Sales along with Crude Oil Inventories that may add additional volatility into the markets.
If you have futures in your trading portfolio, you can check out on CME Group data plans available that suit your trading needs tradingview.com/cme/
*CME Group futures are not suitable for all investors and involve the risk of loss. Copyright © 2023 CME Group Inc.
**All examples in this report are hypothetical interpretations of situations and are used for explanation purposes only. The views in this report reflect solely those of the author and not necessarily those of CME Group or its affiliated institutions. This report and the information herein should not be considered investment advice or the results of actual market experience.
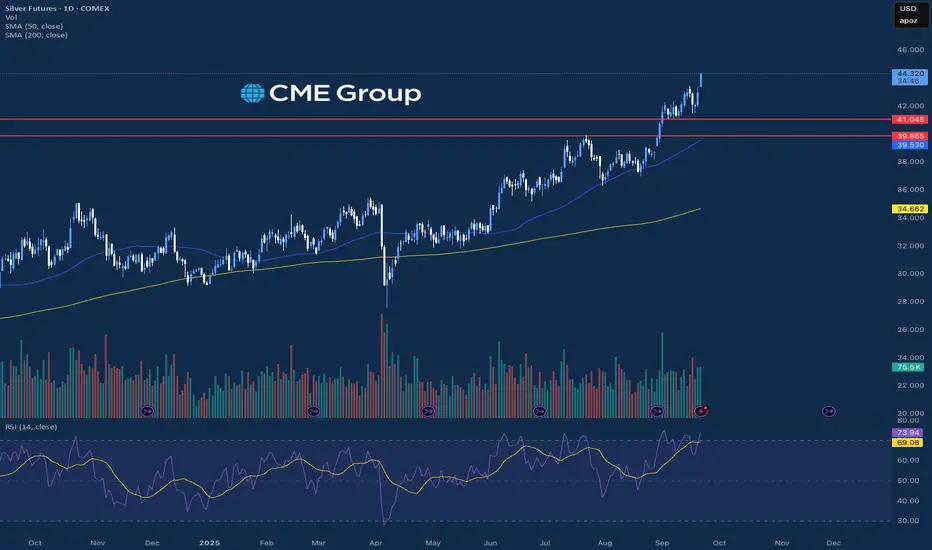
Precious Metals Lead Markets HigherThe resilience in the precious metals markets at this point can not be overstated with the sharp moves to the upside over the course of the year. After finishing the week on a strong note last week, Gold and Silver both traded higher again today and carved out a new all time high price with Silver leading the way trading up over 3%. Both of these markets have been trading in a technically “overbought” territory for most of September, and the markets have continued to go higher with the strength in the Euro relative to the Dollar.
Outside of the precious metals, the equity markets also traded marginally higher again today, and the S&P and Nasdaq were able to record a new all time high price today. There was little economic data released today, but there was news with NVIDIA about a $100 billion investment into OpenAI that helped boost the Nasdaq and other equity indices. For the rest of the week, there will be many key economic reports, especially GDP later in the week, that could add more volatility into these markets that are trading at elevated levels.
If you have futures in your trading portfolio, you can check out on CME Group data plans available that suit your trading needs tradingview.com/cme/
*CME Group futures are not suitable for all investors and involve the risk of loss. Copyright © 2023 CME Group Inc.
**All examples in this report are hypothetical interpretations of situations and are used for explanation purposes only. The views in this report reflect solely those of the author and not necessarily those of CME Group or its affiliated institutions. This report and the information herein should not be considered investment advice or the results of actual market experience.
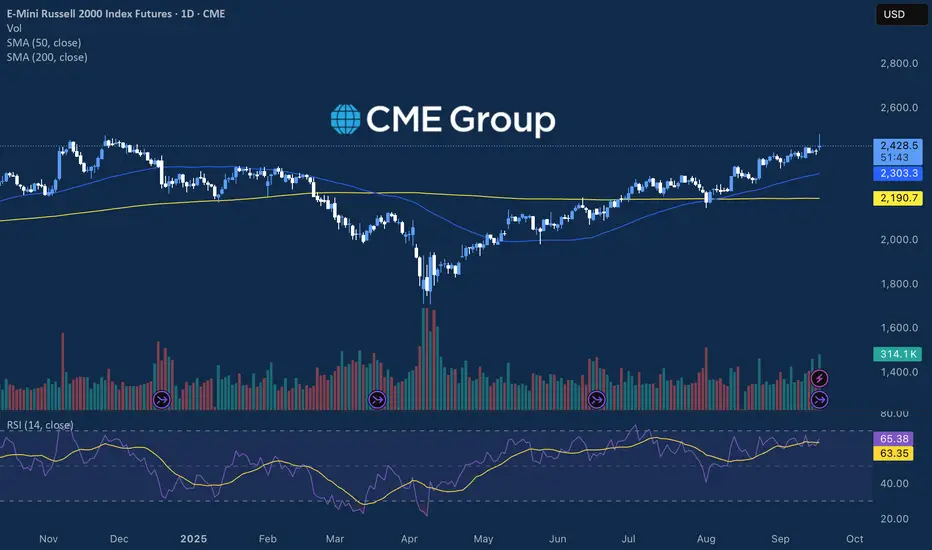
Russell Leads Equities Higher With Fed Decision Today was a well anticipated Fed meeting over the last few weeks as it has been priced in as the first interest rate cut of the year. The probabilities were accurate and traders saw a 25-basis point interest rate cut today, and the S&P and Nasdaq saw some back and forth price movement before finishing the day slightly lower near unchanged. The Russell saw a strong move to the upside as small cap equities typically outperform in a lowering interest rate environment.
Outside of the equities, Gold and Silver saw sharp moves to the downside of this decision, with Silver being down over 2% and Gold slipping near 0.75%. Both of these markets have been shooting to the upside over the last few weeks trading near or at all time highs, which could add to to volatility on the move lower today. The CME Fed Watch Tool is still pricing in 2 more 25-basis point interest rate cuts this year, with one at each meeting in October and December, and traders will be watching this figure as more data on employment and inflation are released before those meetings.
If you have futures in your trading portfolio, you can check out on CME Group data plans available that suit your trading needs tradingview.com/cme/
*CME Group futures are not suitable for all investors and involve the risk of loss. Copyright © 2023 CME Group Inc.
**All examples in this report are hypothetical interpretations of situations and are used for explanation purposes only. The views in this report reflect solely those of the author and not necessarily those of CME Group or its affiliated institutions. This report and the information herein should not be considered investment advice or the results of actual market experience.
Money on the table ahead of the FedEUR/USD is once again in the spotlight as the Federal Reserve prepares to meet this week. The backdrop is a perceived convergence between Fed and ECB rate paths, narrowing a differential that had long favored the dollar. The euro has regained lost ground after the summer, trading around strategic levels supported by a more balanced macro environment and relative eurozone resilience. A combined reading of fundamentals, technicals, sentiment, and options flows helps refine potential scenarios for the weeks ahead.
Fundamental Analysis
Two main narratives drive EUR/USD. On the U.S. side, inflation has remained stickier than expected. The August CPI rose +0.4% m/m, pushing headline inflation to 2.9% and the core to 3.1%. This persistence reflects tariff- and food-driven pressures, leaving the Fed juggling inflation control with signs of weakening in the labor market. Job creation has slowed, and unemployment claims have edged higher, complicating the policy mix.
Markets expect a 25bp rate cut in September, which would mark the start of a cautious easing cycle. Beyond that, uncertainty dominates: some see another move before year-end, others expect a pause as the Fed reassesses inflation and growth dynamics.
In Europe, the ECB has held its deposit rate steady at 2%, underscoring that disinflation is in progress while acknowledging inflation will remain slightly above target in 2025 (2.1% forecast). President Christine Lagarde described the economy as “in a good place,” lowering the likelihood of aggressive cuts. As a result, the policy spread between the Fed and ECB is shrinking, undermining the dollar’s yield advantage and lending structural support to the euro.
Technical Analysis
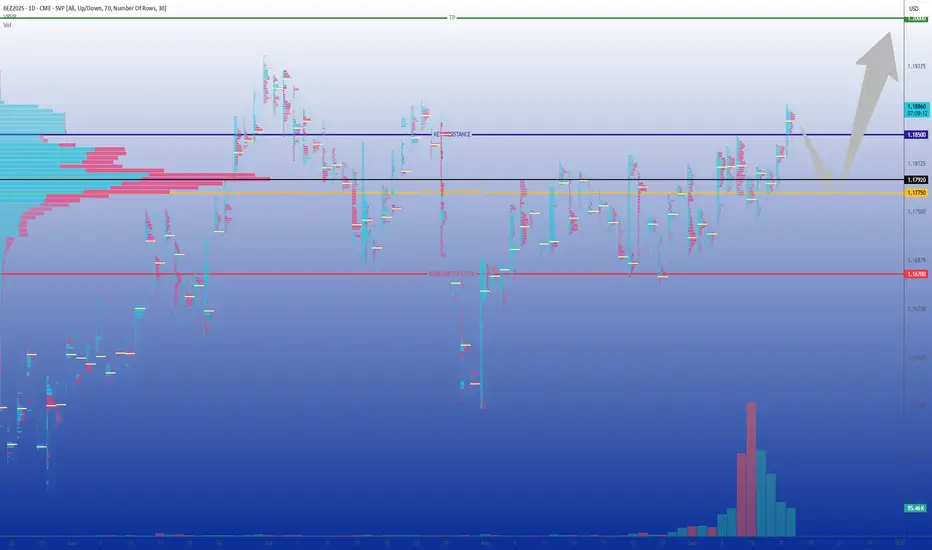
The December 2025 Euro FX futures contract (6EZ5) is currently challenging resistance at the upper boundary of a tight 1.1650–1.1850 range. The volume profile highlights a dense cluster between 1.1775 and 1.1800, forming key short-term support. As long as this zone holds, the technical bias leans higher.
A clean break above 1.1850 would likely accelerate momentum toward the psychological 1.20–1.2050 zone, already cited by technical analysts as the next upside target.
On the downside, 1.1670 is the pivot for validation. A sustained move below would undermine the bullish scenario and risk a return toward sub-1.1600 levels. For now, however, support continues to attract buyers, keeping the uptrend intact.
Sentiment Analysis
Broker positioning data shows retail traders remain heavily short EUR/USD, a contrarian indicator favoring further gains. Importantly, the rally is not built on a fragile short squeeze but on steady accumulation, which makes it more sustainable.
Commitments of Traders (COT) reports reinforce this: asset managers remain long euro, dealers are short for hedging, and leveraged funds sit closer to neutral. Institutional flows, in other words, lean supportive.
Low implied volatility further highlights the lack of market conviction in a sharp downside break. Investors appear more concerned with missing an upside move than with protecting against euro weakness, which strengthens the bullish tilt.
Options Activity
In the OTC market, risk reversals are slightly skewed in favor of euro calls, suggesting more demand for upside protection. This fits neatly with both fundamentals and positioning.
At the CME, open interest paints a similar picture:
A Put/Call ratio tilted toward calls
Heavy concentrations at 1.1800 and 1.1850 strikes, creating upward magnetism
Limited put interest between 1.1650–1.1700, only relevant if spot weakens sharply
Low implied volatility, signaling no expectation of outsized moves before the Fed meeting
Altogether, this suggests that 1.1850 is the immediate gravitational level, with room for extension toward 1.20 if momentum persists.
Trade Idea: Long 6EZ5
Directional setup:
Entry: Buy on dips toward 1.1775
Invalidation: Close below 1.1670
Take Profit: 1.1975–1.2000 (psychological milestone and measured target)
This strategy combines institutional support visible in COT reports, option flows skewed toward the upside, strong technical zones, and narrowing Fed–ECB spreads that erode the dollar’s advantage.
Final Thoughts
The Fed’s September decision is more than a routine policy update. It could mark a turning point for global FX dynamics. U.S. inflation remains uncomfortably sticky, but weakening jobs data points toward gradual easing. In contrast, the ECB is signaling stability and relative confidence. This policy convergence narrows the rate gap, historically a pillar of dollar strength, and bolsters the medium-term case for euro appreciation.
Technically, the market is consolidating above robust support levels, while sentiment indicators and option positioning both lean bullish. The December 2025 contract captures this balance: a market with strong foundations, low volatility expectations, and option flows pointing toward a breakout higher.
The key tactical question is whether the Fed provides enough dovish tone to unlock the upside. If EUR/USD breaks decisively above 1.1850, momentum toward 1.20 could unfold quickly. In the short term, caution is warranted heading into the FOMC, but unless an external shock emerges, the combined weight of fundamentals, technicals, and sentiment continues to argue for a stronger euro in the weeks ahead.
---
When charting futures, the data provided could be delayed. Traders working with the ticker symbols discussed in this idea may prefer to use CME Group real-time data plan on TradingView: tradingview.com/cme/ .
This consideration is particularly important for shorter-term traders, whereas it may be less critical for those focused on longer-term trading strategies.
General Disclaimer:
The trade ideas presented herein are solely for illustrative purposes forming a part of a case study intended to demonstrate key principles in risk management within the context of the specific market scenarios discussed. These ideas are not to be interpreted as investment recommendations or financial advice. They do not endorse or promote any specific trading strategies, financial products, or services. The information provided is based on data believed to be reliable; however, its accuracy or completeness cannot be guaranteed. Trading in financial markets involves risks, including the potential loss of principal. Each individual should conduct their own research and consult with professional financial advisors before making any investment decisions. The author or publisher of this content bears no responsibility for any actions taken based on the information provided or for any resultant financial or other losses.
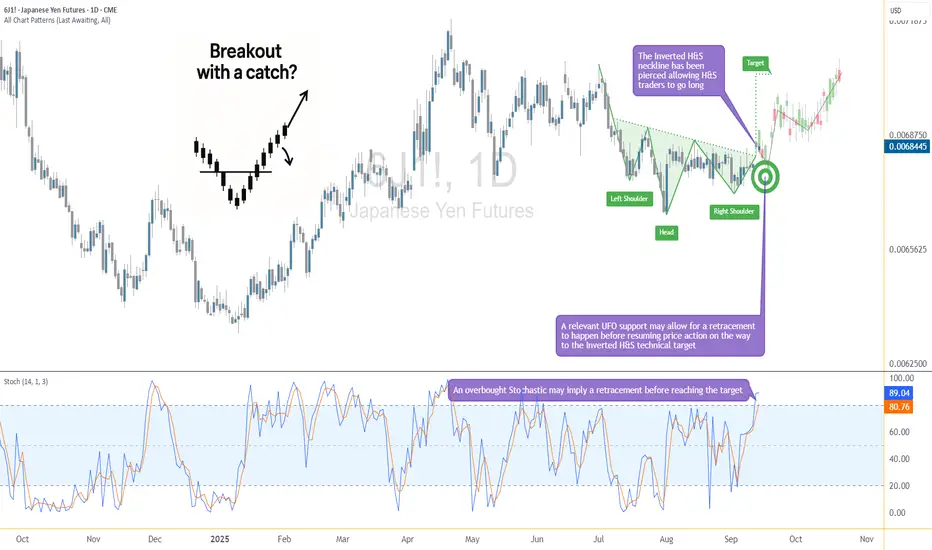
Breakout with a Catch: The Yen May Dip Before Lifting Off AgainThe Japanese Yen Futures (6J) have just pierced above a critical neckline at 0.0068220, completing an Inverted Head and Shoulders formation. This classical reversal pattern often signals a potential shift in momentum from bearish to bullish. Based on technical projections, the measured move points toward a target near 0.0070430, which lies significantly higher from current price levels.
Yet, there’s a catch. The Stochastic Oscillator has entered overbought territory, hinting that before the next upward leg develops, a retracement could occur. This makes the current setup particularly interesting, as the neckline breakout is bullish, but timing entries becomes crucial to avoid getting caught in a short-term dip.
Understanding the Inverted Head & Shoulders
The Inverted Head and Shoulders is one of the most recognized reversal patterns in technical analysis. It typically forms after a prolonged decline and suggests that bearish momentum is losing steam.
The structure consists of three parts:
Left Shoulder: the first swing low, followed by a rebound
Head: a deeper low, which marks the exhaustion of sellers
Right Shoulder: a higher low, indicating buyers are stepping in earlier
Neckline: the resistance level connecting the highs of the shoulders, acting as the trigger point
Once price pierces above the neckline, the pattern is considered complete. Traders often project the distance from the head to the neckline and extend it upward to identify a potential price objective. In this case, the neckline break projects a target near 0.0070430.
The reliability of this formation lies in its ability to signal a shift in trend sentiment. While no pattern is flawless, the inverted H&S is widely respected for its potential consistency.
The Role of Stochastic in This Setup
While the breakout above the neckline looks promising, momentum indicators suggest caution. The Stochastic Oscillator, a tool designed to measure overbought and oversold conditions, is currently flashing an overbought reading.
This does not necessarily mean that prices must reverse, but it does imply that the bullish move could pause or correct before resuming. In practical terms, traders might expect a short-term retracement as buying pressure temporarily exhausts itself.
Such pullbacks can be constructive within a broader bullish setup, especially if they occur near significant areas of support. By aligning the breakout pattern with Stochastic signals, traders can time their entries with more precision instead of chasing the market at stretched levels.
Support Zone & Safety Net
One of the strongest features of this setup is the presence of a relevant support area just below the neckline breakout level. This zone, also reinforced by a previously identified UFO support, could serve as a launching pad if prices retrace lower in the short term.
If 6J dips back toward the neckline, traders will be watching whether this level holds. A bounce from here would not only validate the breakout but also offer an attractive risk-to-reward setup. To manage downside exposure, a protective stop can be placed at 0.0067350, positioned below this key support zone.
This structure creates a layered safety net: first the neckline, then the underlying support, and finally the stop loss—offering multiple defenses against unfavorable moves before the bullish scenario invalidates.
Contract Specs & Margins (6J & MJY)
CME offers both the standard Japanese Yen Futures (6J) and the smaller-sized Micro JPY/USD Futures (MJY), giving traders flexibility depending on capital requirements and position sizing needs.
🟢 6J – Japanese Yen Futures
Contract size: ¥12,500,000
Minimum tick: 0.0000005 = $6.25
Initial margin: ≈ $3,100 (subject to CME updates)
🟢 MJY – Micro JPY/USD Futures
Contract size: ¥1,250,000 (1/10th of standard)
Minimum tick: 0.000001 = $1.25
Initial margin: ≈ $310 (subject to CME updates)
The Micro contracts replicate the price behavior of the standard Yen futures at a fraction of the size. This makes them attractive for traders who want to fine-tune risk exposure, scale in or out more precisely, or manage positions with smaller capital outlays.
Trade Plan Example
A structured trade idea can help frame the opportunity while managing risk effectively:
Direction: Long
Entry: Near 0.0068220 (neckline breakout level), or after a retracement toward support
Stop: 0.0067350 (below the support zone)
Target: 0.0070430 (measured objective from the inverted H&S)
Reward-to-Risk Calculation:
Potential reward = 0.0070430 – 0.0068220 = 0.0002210
Potential risk = 0.0068220 – 0.0067350 = 0.0000870
Approximate ratio = 2.5 : 1
This ratio is favorable, suggesting that the upside potential outweighs the defined downside exposure. Traders considering this setup may prefer to wait for a retracement toward support, which could enhance entry quality and improve the reward-to-risk profile even further.
The Importance of Risk Management
Even the most compelling technical setups require disciplined risk management. Using stop-loss orders is essential to protect capital against unexpected market swings, particularly in leveraged products like futures.
Position sizing is another key element—adjusting contract size to account size ensures that a single trade does not overexpose the portfolio. Micro contracts, such as MJY, are especially useful for traders looking to scale positions with precision.
Equally important is the principle of avoiding undefined risk. Every trade should have a clearly defined exit strategy, both for profits and losses. By knowing where to enter, where to exit, and where to cut losses, traders reduce emotional decision-making and maintain consistency.
Finally, patience plays a role. Waiting for a retracement into support rather than chasing a stretched market often improves entry quality, lowers risk, and increases the probability of success.
Conclusion
Japanese Yen Futures are showing signs of a potential trend shift as the inverted head and shoulders formation breaks above its neckline. The measured move points toward higher ground, but the overbought Stochastic warns that the path may not be in a straight line. A temporary dip into support could provide a second chance for bulls to position themselves with a favorable risk-to-reward profile.
By combining pattern recognition, momentum analysis, and precise trade planning, this setup highlights how technical structure and disciplined execution can align to create opportunity. Whether trading the standard 6J contract or the smaller MJY, the key remains the same: respect risk, trust the setup, and let the market confirm the move.
When charting futures, the data provided could be delayed. Traders working with the ticker symbols discussed in this idea may prefer to use CME Group real-time data plan on TradingView: www.tradingview.com - This consideration is particularly important for shorter-term traders, whereas it may be less critical for those focused on longer-term trading strategies.
General Disclaimer:
The trade ideas presented herein are solely for illustrative purposes forming a part of a case study intended to demonstrate key principles in risk management within the context of the specific market scenarios discussed. These ideas are not to be interpreted as investment recommendations or financial advice. They do not endorse or promote any specific trading strategies, financial products, or services. The information provided is based on data believed to be reliable; however, its accuracy or completeness cannot be guaranteed. Trading in financial markets involves risks, including the potential loss of principal. Each individual should conduct their own research and consult with professional financial advisors before making any investment decisions. The author or publisher of this content bears no responsibility for any actions taken based on the information provided or for any resultant financial or other losses.
Volatility at rock bottom: is a straddle the right move?Markets often fall into a familiar seasonal pattern. As summer advances, trading volumes thin out, implied volatility fades, and investors drift into a sense of calm. Yet history shows that this period of tranquility rarely lasts. September and October have traditionally been months of renewed turbulence, often catching complacent investors off guard.
With implied volatility currently trading at depressed levels, option premiums are effectively “on sale.” This creates an attractive window for strategies that do not rely on predicting direction but instead position for the return of volatility. Chief among them is the straddle.
What exactly is a straddle?
A straddle is one of the simplest volatility strategies in options markets. It involves buying both a call and a put option with the same strike price and expiration date. The payoff structure is straightforward:
If the underlying asset rises sharply, the call option gains.
If the underlying falls, the put option benefits.
If the market stagnates, the loss is limited to the combined premium.
This makes the straddle an efficient way of “buying volatility.” The key appeal is that it does not require choosing a direction, only anticipating that the market will eventually move.
The calm before the storm
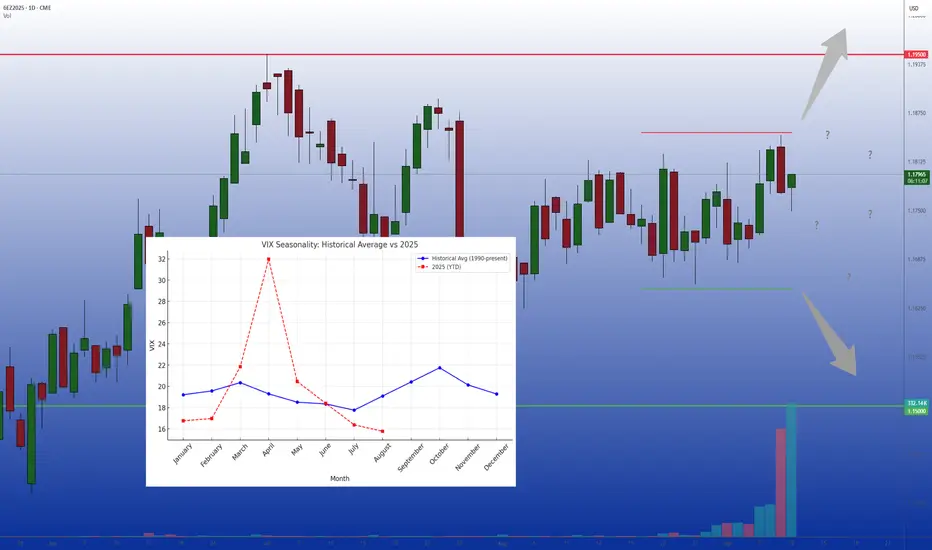
History provides a strong case for seasonality in volatility. Since 1990, the VIX has tended to bottom in June and July before rebounding in September and peaking in October.
The year 2025 has so far mirrored this cycle. After a turbulent spring, summer brought an unusually long stretch of calm. By July, implied volatility had retreated to some of the lowest comfort levels in years. But if history is any guide, such stability is more a pause than a new equilibrium.
Foreign exchange markets show a similar pattern. The CVOL G5 FX index, tracking implied volatility on Euro, Pound, Yen, Australian Dollar, and Canadian Dollar futures, often displays sharp bursts of activity around macro or geopolitical shocks, followed by prolonged lulls. The current quiet looks very much like another such lull.
Why low IV matters
Implied volatility is the primary input in option pricing. When IV is low, option premiums fall; when IV rises, those same contracts become far more expensive. This makes timing important.
An August straddle is usually cheaper than one initiated in September. Buying optional exposure now means paying a “discounted” premium while retaining the potential to benefit from a rebound in volatility during the fall.
No need for directional bets
One of the main attractions of the straddle is that it removes the need to guess direction.
For example, an investor might think: “I am unsure whether the euro will rise or fall against the dollar, but I doubt that the summer calm will last.” In such a scenario, a straddle is more appropriate than a directional trade. It captures volatility regardless of the outcome and provides insurance against unexpected moves.
FX as a natural playground
Equity markets tend to see volatility spikes alongside price declines, but in FX, volatility is far more symmetric. Currency pairs often experience sharp swings in either direction, sometimes triggered by small catalysts such as a central banker’s remark or a surprise data print.
Let’s take the Euro FX contract, December expiry. The price has remained close to 1.175 throughout the summer, but several catalysts could easily break the range in the fall: diverging central bank policies, U.S. protectionist measures, or geopolitical events. Any of these could quickly shift the balance between currencies and force institutional rebalancing.
Because FX markets often move from extended ranges to sudden breakouts, they provide fertile ground for straddle strategies. The investor is not required to predict the breakout direction, only to position for its likelihood.
Another important consideration: listed FX options, such as those traded on CME, generally offer more transparency, standardization, and often lower costs compared with over-the-counter (OTC) FX options. Exchange-traded contracts provide clearer pricing and robust clearing, which makes them particularly well-suited for volatility strategies where premium efficiency matters.
Lessons from seasonality
Volatility is cyclical. Calm phases almost always give way to periods of agitation, sometimes even panic. Over the past 35 years, September has consistently marked a turning point, as investors return from summer breaks and refocus on economic data, central bank policy, and geopolitical events.
The summer of 2025 is no exception. Option premiums are unusually cheap, reflecting a market that assumes the calm will last. But history suggests otherwise. For those who believe turbulence will return, strategies like the straddle offer a simple and cost-efficient way to prepare.
Final thoughts
Complacency is one of the market’s most dangerous traps. While quiet markets encourage investors to lower their guard, volatility rarely stays low for long. With option premiums currently discounted, the coming weeks present an attractive window to position for a return of market movement.
By emphasizing magnitude over direction and by favoring listed options for their transparency and efficiency, the straddle remains one of the most compelling ways to approach the seasonal shift.
---
When charting futures, the data provided could be delayed. Traders working with the ticker symbols discussed in this idea may prefer to use CME Group real-time data plan on TradingView: tradingview.com/cme/ .
This consideration is particularly important for shorter-term traders, whereas it may be less critical for those focused on longer-term trading strategies.
General Disclaimer:
The trade ideas presented herein are solely for illustrative purposes forming a part of a case study intended to demonstrate key principles in risk management within the context of the specific market scenarios discussed. These ideas are not to be interpreted as investment recommendations or financial advice. They do not endorse or promote any specific trading strategies, financial products, or services. The information provided is based on data believed to be reliable; however, its accuracy or completeness cannot be guaranteed. Trading in financial markets involves risks, including the potential loss of principal. Each individual should conduct their own research and consult with professional financial advisors before making any investment decisions. The author or publisher of this content bears no responsibility for any actions taken based on the information provided or for any resultant financial or other losses.
All Time Highs for Precious MetalsGold and Silver are continuing to show resilience today leading the precious metals higher to new all time high prices. Looking at the Gold market, today marks 5 consecutive days with a higher all-time high and a higher low, and Silver has had 4 consecutive days with a higher high and higher low, which is rare to see at elevated prices for these markets. There was some significant data released looking at JOLTs, which was the lowest reported number since Match of 2021 which led Gold and Silver to both see positive gains again today. Along with that, there is an expected nonfarm payrolls report and an unemployment rate coming out Friday, and the nonfarm payrolls number is expected at 74k, which is the lowest expected number since February of 2021.
Equity markets battled back and forth today and the S&P and Nasdaq were able to finish the day positive with a strong upside move into the close. With the equities trading near all time high prices, there will be a lot of attention on the economic data for the rest of the week looking at jobs and employment. The CME Fed Watch Tool also saw slight shifts over the past 2 days and now are pricing in a 25-basis point rate cut for the September and October meeting. These figures have been changing rapidly, and traders will get more clarity once we hear from Powell after the September meeting in a few weeks.
If you have futures in your trading portfolio, you can check out on CME Group data plans available that suit your trading needs tradingview.com/cme/
*CME Group futures are not suitable for all investors and involve the risk of loss. Copyright © 2023 CME Group Inc.
**All examples in this report are hypothetical interpretations of situations and are used for explanation purposes only. The views in this report reflect solely those of the author and not necessarily those of CME Group or its affiliated institutions. This report and the information herein should not be considered investment advice or the results of actual market experience.
Gold Lags Behind SilverGold lags behind silver. I’m referring to silver’s percentage gains outpacing gold, not suggesting that silver is becoming more expensive than gold. Investors and traders focus on percentage gains, whereas consumers buying jewelry make decisions based on how much it’ll actually cost them.
Last year, silver’s 60% gain outpaced gold’s 40%, and year-to-date, silver has once again outperformed gold with a 52% gain compared to gold’s 36%.
Micro Silver Futures
Ticker: SIL
Minimum fluctuation:
0.005 per troy ounce = $5.00
Disclaimer:
• What presented here is not a recommendation, please consult your licensed broker.
• Our mission is to create lateral thinking skills for every investor and trader, knowing when to take a calculated risk with market uncertainty and a bolder risk when opportunity arises.
CME Real-time Market Data help identify trading set-ups in real-time and express my market views. If you have futures in your trading portfolio, you can check out on CME Group data plans available that suit your trading needs www.tradingview.com

Core PCE to Wrap the WeekEquity markets are trending lower to finish out a week that came with a vast slate of earnings and economic data many traders have been waiting for. We saw NVIDIA earnings, GDP, and finished the week today with the Fed’s preferred inflation indicator Core PCE, which came right in line with expectations at 2.9%, which was a slight increase over last month. The Nasdaq is leading the equities lower trading down near 1.4% and the S&P and Russell saw small losses after the S&P hit a new record high this week.
Overall this month, the S&P, Nasdaq, Gold and Silver were able to carve out a new all time high price this month and came off of those levels slightly to finish the week and month out. As it stands now, the market is pricing in a 25-basis point interest rate cut near 85% for the September meeting, so traders will be more concerned about how hawkish or dovish Powell sounds after the report comes out for future rate cuts. Next week, we will get more data on manufacturing, jobs, nonfarm payrolls, and unemployment that could add additional volatility to these markets that have been trending higher as of late.
If you have futures in your trading portfolio, you can check out on CME Group data plans available that suit your trading needs tradingview.com/cme/
*CME Group futures are not suitable for all investors and involve the risk of loss. Copyright © 2023 CME Group Inc.
**All examples in this report are hypothetical interpretations of situations and are used for explanation purposes only. The views in this report reflect solely those of the author and not necessarily those of CME Group or its affiliated institutions. This report and the information herein should not be considered investment advice or the results of actual market experience.
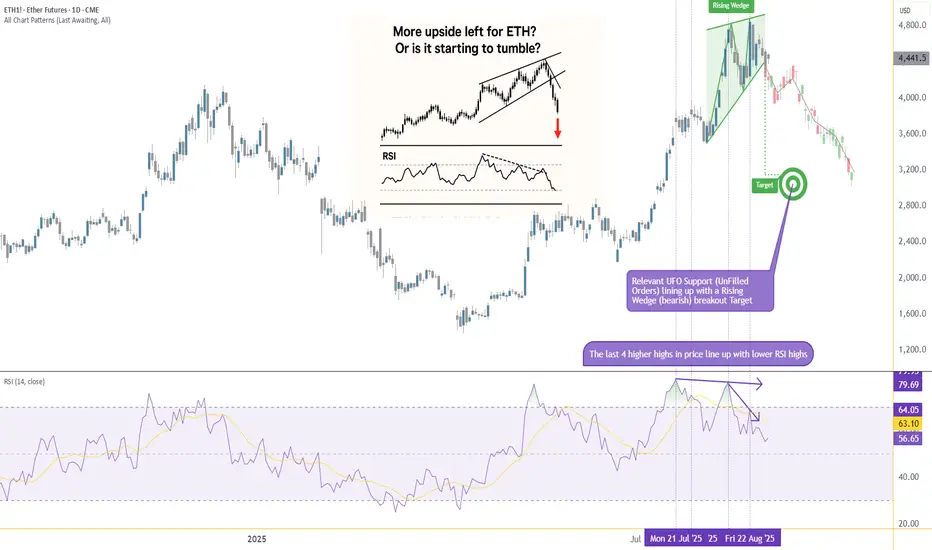
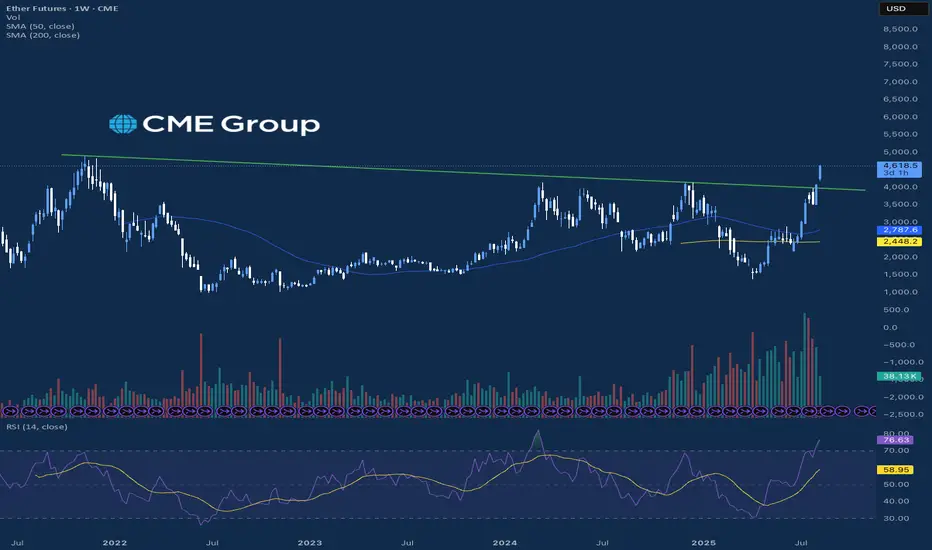
From Strength to Weakness: ETH Validates a Key Bearish PatternIntroduction (Market Context)
Ether Futures (ETH) and Micro Ether Futures (MET) have been at the center of market attention since April 2025, when prices staged a remarkable rally of more than +250%. This surge was not just a technical phenomenon—it came in the wake of major macro events such as Liberation Day and the reemergence of U.S. tariff policies under Donald Trump’s administration. Those developments sparked speculative flows into digital assets, with Ether acting as one of the prime beneficiaries of capital rotation.
Yet markets rarely move in one direction forever. After such a sharp rise, technical exhaustion often follows, and signs of that exhaustion are beginning to surface on ETH’s daily chart. Traders who enjoyed the rally now face a critical juncture: whether to protect gains or to consider new opportunities in the opposite direction. The key lies in a pattern that has appeared many times in history, often marking important reversals—the Rising Wedge.
What is a Rising Wedge?
A Rising Wedge is one of the most recognizable bearish reversal formations in technical analysis. It typically develops after a strong uptrend, where price continues to push higher but does so with diminishing momentum. On the chart, the highs and lows still point upward, but the slope of the highs is shallower than the slope of the lows, creating a narrowing upward channel.
The psychology behind the wedge is critical: buyers are still in control, but they are running out of strength with every push higher. Sellers begin to absorb demand more aggressively, and eventually, price breaks through the lower boundary of the wedge. This breakdown often accelerates as trapped buyers unwind positions.
From a measurement perspective, technicians project the maximum width of the wedge at its start, and then apply that distance downward from the point of breakdown. This projection offers a technical target for where price may gravitate in the following weeks. In the case of Ether Futures, that target points toward the 3,200 area, a level of strong technical interest and a logical area for traders to watch closely.
RSI and Bearish Divergence
Alongside the wedge, momentum indicators add further weight to the bearish case. The Relative Strength Index (RSI) is a widely used oscillator that measures momentum on a scale of 0 to 100. Values above 70 are generally interpreted as “overbought,” while values below 30 suggest “oversold.”
The most powerful signals often emerge not when RSI is at an extreme, but when it diverges from price action. A bearish divergence occurs when price sets higher highs while RSI forms lower highs. This is an indication that upward momentum is weakening even as price appears to climb.
Ether Futures have displayed this phenomenon clearly over the past few weeks. The daily chart shows four successive higher highs in price, yet RSI failed to confirm these moves, instead tracing a series of lower peaks. Notably, RSI pierced the overbought zone above 70 twice during this period, but momentum faded quickly after each attempt. This divergence is a classic early warning sign that a bullish run is running out of steam.
Forward-Looking Trade Idea
With the Rising Wedge breakdown and RSI divergence in place, a structured trade plan emerges. Futures traders can express this view through either the standard Ether Futures contract (ETH) or its smaller counterpart, the Micro Ether Futures contract (MET).
Contract Specs & Margins
Ether Futures (ETH): Notional = 50 Ether, Tick size = 0.50, Tick value = $25.00, Initial margin ≈ $68,800 (subject to CME updates).
Micro Ether Futures (MET): Notional = 0.1 Ether, Tick size = 0.50, Tick value = $0.05, Initial margin ≈ $140 (subject to CME updates).
Trade Plan (Bearish Setup)
Direction: Short
Entry: 4,360
Target: 3,200
Stop Loss: 4,702 (coinciding with a minor resistance level)
Reward-to-Risk Ratio: ≈ 3.39 : 1
The projected wedge target around 3,200 is not only a measured move from the pattern but also sits close to a previously established UFO support zone. While anecdotal, this confluence reinforces the credibility of the level as a potential magnet for price.
Risk Management
Regardless of how compelling a technical setup may appear, the most decisive factor in trading remains risk management. Defining risk in advance ensures that losses are limited if the market behaves unexpectedly. In this case, placing the stop at 4,702 not only keeps risk under control but also aligns with a minor resistance level, making the trade plan technically coherent.
Position sizing also plays a crucial role. The availability of Micro Ether Futures (MET) allows traders to participate with significantly reduced capital requirements compared to the full-sized ETH contract. This flexibility makes it easier to fine-tune exposure and manage account risk more precisely.
Equally important is the discipline of adhering to precise entries and exits. Chasing a trade or ignoring pre-defined stop levels can erode the edge provided by technical analysis. Markets often deliver multiple opportunities, but without sound risk management, traders may not survive long enough to benefit from them. Ultimately, capital preservation is the foundation on which consistent performance is built.
Closing
Ether’s spectacular rally since April 2025 is a reminder of the asset’s ability to deliver explosive moves under the right conditions. Yet history shows that parabolic advances rarely continue uninterrupted. The combination of a Rising Wedge breakdown and a confirmed RSI divergence provides strong evidence that the current uptrend is losing momentum, and the market may be entering a corrective phase.
For traders, this is less about predicting the future and more about recognizing when probabilities align in favor of a defined setup. With clear entry, target, and stop levels, the ETH and MET contracts offer a structured opportunity for those willing to take a bearish stance while managing their risk appropriately.
When charting futures, the data provided could be delayed. Traders working with the ticker symbols discussed in this idea may prefer to use CME Group real-time data plan on TradingView: www.tradingview.com - This consideration is particularly important for shorter-term traders, whereas it may be less critical for those focused on longer-term trading strategies.
General Disclaimer:
The trade ideas presented herein are solely for illustrative purposes forming a part of a case study intended to demonstrate key principles in risk management within the context of the specific market scenarios discussed. These ideas are not to be interpreted as investment recommendations or financial advice. They do not endorse or promote any specific trading strategies, financial products, or services. The information provided is based on data believed to be reliable; however, its accuracy or completeness cannot be guaranteed. Trading in financial markets involves risks, including the potential loss of principal. Each individual should conduct their own research and consult with professional financial advisors before making any investment decisions. The author or publisher of this content bears no responsibility for any actions taken based on the information provided or for any resultant financial or other losses.
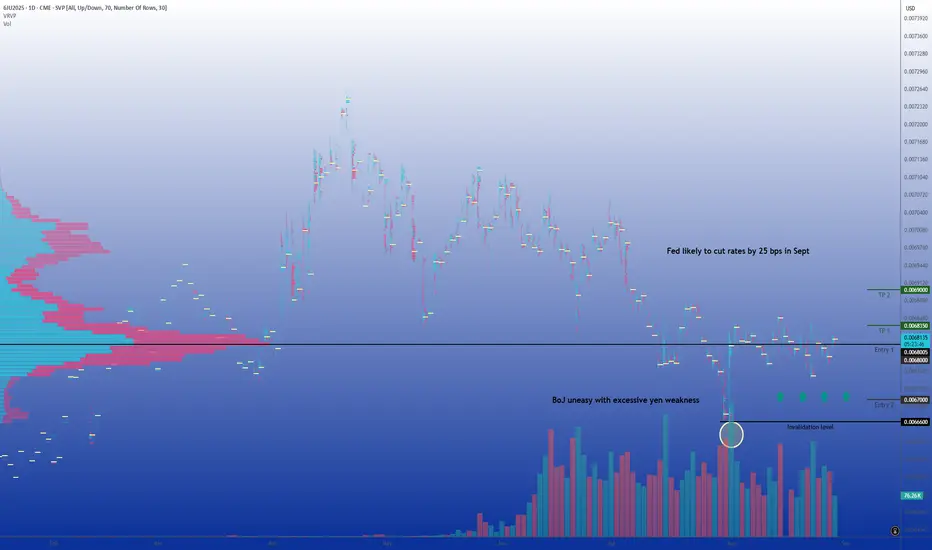
BoJ firmness and Fed pivot set stage for yen recoveryThe Japanese yen is currently trading in a strategically important zone. It remains historically weak but is closely monitored by Japanese authorities as USD/JPY hovers just below the symbolic 150 level. For swing traders, the challenge is to determine whether the currency can mount a lasting rebound, as fundamentals and sentiment have become less one-sided than in recent years.
Fundamental analysis
The yen’s path remains primarily shaped by monetary policy divergence. In the U.S., recent data point to slowing momentum: the latest jobs report revealed weaker hiring and downward revisions, while inflation signals remain mixed. Chair Jerome Powell confirmed at Jackson Hole that the central bank is preparing to lower interest rates in September, with a strong likelihood of a 25 basis point cut (probability > 85% according to CME FedWatch Tool).
Japan presents a contrasting stance. The Bank of Japan has adopted a firmer tone than in the past decade. Governor Kazuo Ueda stresses the importance of wages and employment in sustaining inflation, suggesting that another hike could occur before year-end. With Tokyo CPI still above the central bank target, the BoJ’s hawkish bias is becoming more credible. This change narrows the policy gap with the U.S.
The yen’s traditional role as a funding currency is also under pressure. Narrowing rate differentials and a less accommodative BoJ reduce the appeal of the carry trade. More importantly, the threat of intervention lingers. In 2022, Tokyo intervened when USD/JPY crossed 150. With spot near 148, a break of that threshold could once again invite official action. This risk serves as both a psychological and practical ceiling for dollar strength against the yen.
Taken together, fundamentals are no longer uniformly bearish.
Technical analysis
On the J6U5 daily chart, the broader trend remains bearish for the yen, but since early August the contract has shifted into consolidation.
The volume profile highlights a value area concentrated between 0.00678 and 0.00680, confirming this range as the market’s equilibrium. Below 0.00676, liquidity is thin, leaving the market vulnerable to a swift drop toward 0.00670 if support gives way. Conversely, a sustained break above 0.00684 would validate renewed yen strength, with an upside projection toward 0.00690.
Resistance lies clearly between 0.00683 and 0.00685, zones of congestion that make gains difficult without a trigger. This structure offers swing traders clear markers and the narrow corridor suggests that the next breakout could be meaningful.
Market sentiment
Retail positioning data shows a clear consensus against the yen, with a majority of individual traders long USD/JPY (therefore short yen). This consensus is exposed to a squeeze, particularly since most of these long USD/JPY positions are losing money, weakening traders and increasing the risk of forced unwinds.
According to the CFTC COT report, asset managers are on the opposite side, tending to be net buyers of yen.
CME and OTC options
Options data underline the gravity of 0.00680. On CME, open interest is concentrated at this strike, with additional clusters between 0.00675–0.00677 and 0.00683–0.00685. This reinforces the current corridor structure.
The spot market provides similar signals. Large expiries are clustered between 147.50 and 148.00 USD/JPY, amounting to nearly 3.3 billion dollars in contracts this week. These expiries act as magnets for spot price action and serve as a cap on near-term upside. Until they roll off, traders should expect range-bound behavior around current levels.
Trade idea
In this context, a swing strategy favoring yen strength is justified. The plan would be to buy J6U5 on dips: half the position near 0.00680 and the other half closer to 0.00670 if retested.
Invalidation comes on a daily close below 0.00666, which would negate the bullish scenario and reopen the path toward further yen weakness. On the upside, the first objective is 0.00683–0.00684, the upper bound of the current range. With a catalyst such as dovish Fed guidance, hawkish BoJ comments, or verbal intervention from Tokyo, the move could extend toward 0.00690.
The setup provides a clear risk/reward structure: limited downside defined by support, while upside benefits from the vulnerability of consensus short positions.
Final thoughts
The J6U5 contract sits at a delicate equilibrium. Fundamentals are slowly turning less unfavorable to the yen as the Fed prepares to ease, the BoJ strikes a firmer tone, and intervention risk limits dollar upside. Technically, the contract trades in a well-defined range, with 0.00680 as pivot. Sentiment shows retail consensus against the yen, while institutional positioning and options data point to potential cracks in that view.
Combining these factors, a swing-long yen strategy on dips is justified. The base case is for a rebound toward 0.00684 and possibly 0.00690 if catalysts materialize. The potential for recovery is real, though discipline is essential: the broader bearish trend will not be reversed until resistance levels are broken. For swing traders, the opportunity lies in anticipating this tactical rebound, positioning ahead of a possible market rebalancing in favor of the yen.
---
When charting futures, the data provided could be delayed. Traders working with the ticker symbols discussed in this idea may prefer to use CME Group real-time data plan on TradingView: tradingview.com/cme/ .
This consideration is particularly important for shorter-term traders, whereas it may be less critical for those focused on longer-term trading strategies.
General Disclaimer:
The trade ideas presented herein are solely for illustrative purposes forming a part of a case study intended to demonstrate key principles in risk management within the context of the specific market scenarios discussed. These ideas are not to be interpreted as investment recommendations or financial advice. They do not endorse or promote any specific trading strategies, financial products, or services. The information provided is based on data believed to be reliable; however, its accuracy or completeness cannot be guaranteed. Trading in financial markets involves risks, including the potential loss of principal. Each individual should conduct their own research and consult with professional financial advisors before making any investment decisions. The author or publisher of this content bears no responsibility for any actions taken based on the information provided or for any resultant financial or other losses.
How to Manage Recession and Inflation?Can a recession and inflation coexist? We saw that in the 30s great depression and 70s great inflation.
Today's jobs numbers is trending lower, indicating a possible recession, while (3) inflation numbers are ticking up.
When these 2 conditions occur simultaneously, it is known as stagflation.
The 70s great inflation and today’s situation is very similar; we will study them. And discuss how to manage stagflation.
Micro Silver Futures
Ticker: SIL
Minimum fluctuation:
0.005 per troy ounce = $5.00
Disclaimer:
• What presented here is not a recommendation, please consult your licensed broker.
• Our mission is to create lateral thinking skills for every investor and trader, knowing when to take a calculated risk with market uncertainty and a bolder risk when opportunity arises.
CME Real-time Market Data help identify trading set-ups in real-time and express my market views. If you have futures in your trading portfolio, you can check out on CME Group data plans available that suit your trading needs www.tradingview.com

Can Yen Futures Push Higher? Inverted H&S Breakout in Focus1. Introduction
Japanese Yen Futures (6J) and Micro Yen Futures (MJY) are showing a promising technical setup that traders are watching closely. On the daily chart, an inverted Head and Shoulders pattern has formed, suggesting a potential reversal from recent weakness. The neckline lies around 0.006850, and if prices sustain a breakout above this level, the upside projection aligns neatly with a UFO resistance zone near 0.007100.
Adding weight to this bullish case, the MACD histogram is diverging positively, with higher lows forming while price action recorded lower lows. This bullish divergence suggests underlying momentum could support the completion of the pattern and drive Yen Futures higher in the sessions ahead.
2. Understanding the Inverted Head & Shoulders Pattern
The inverted Head & Shoulders (H&S) is a widely recognized reversal formation that often signals the end of a bearish trend. It is composed of three troughs: the left shoulder, the head (the deepest low), and the right shoulder, which is typically shallower. The neckline acts as the key breakout level, and once broken, the projected price target is measured from the head to the neckline, then projected upward.
In the case of Japanese Yen Futures, the neckline sits around 0.006850. A confirmed break above this price would validate the pattern, projecting a target toward 0.007100.
3. The Role of MACD Divergence
Momentum indicators could provide early clues about the strength of a potential breakout. In this case, the MACD histogram is showing bullish divergence—price made lower lows, while the histogram made higher lows. This divergence signals that selling pressure may be weakening, even as price was still falling.
Such conditions could potentially precede significant reversals, and when they align with a clear price pattern like the inverted Head & Shoulders, the probability of follow-through may increase. Traders monitoring this confluence will be looking at the neckline breakout above 0.006850 as the technical trigger that confirms it.
4. Contract Specs: Yen Futures vs. Micro Yen Futures
Understanding contract specifications helps traders size positions correctly and manage risk efficiently.
o Japanese Yen Futures (6J)
Contract Unit: ¥12,500,000
Minimum Tick: 0.0000005 per JPY = $6.25 per contract
Initial Margin (approximate, subject to change): ~$3,100
Popular with institutional traders due to larger notional exposure.
o Micro JPY/USD Futures (MJY)
Contract Unit: ¥1,250,000 (1/10th of standard 6J contract)
Minimum Tick: 0.000001 per JPY = $1.25 per contract
Initial Margin (approximate, subject to change): ~$310
Provides accessibility for retail traders and allows more granular risk management.
Both contracts track the same underlying, but the Micro contract offers flexibility for traders with smaller accounts or those looking to fine-tune position sizes.
5. Trade Plan & Stop Loss Options
With the inverted Head & Shoulders pattern taking shape, the trade bias turns long above the neckline breakout at 0.006850. The upside objective aligns with the resistance around 0.007100, providing a clearly defined target.
Two possible stop-loss placements can be considered:
o Below the Right Shoulder
Provides a valid protection but may offer a weaker Reward-to-Risk (R:R) ratio depending on the right shoulder height.
Useful for conservative traders looking to minimize drawdowns.
o Mathematically Below the Neckline
Positioned far enough to allow for retests of the neckline while aiming for a 3:1 R:R ratio.
Provides a balance between protection and potential profitability.
This approach ensures flexibility, letting traders choose between tighter risk control or a more favorable reward profile.
6. Risk Management Considerations
No pattern or indicator guarantees success, making risk management the cornerstone of any futures strategy. A few key principles stand out:
Always use a stop loss: Prevents small losses from escalating into significant drawdowns.
Avoid undefined risk exposure: Futures are leveraged products; unprotected trades can lead to large, rapid losses.
Precision in entries and exits: Reduces emotional decision-making and improves consistency.
Position sizing matters: Adjusting the number of contracts ensures risk stays proportional to account size.
Diversification and hedging: Yen futures can be used as a hedge against equity or bond market volatility, but should not necessarily replace broader risk controls.
In this context, choosing the stop-loss level carefully and sticking to the pre-defined trade plan is more important than the pattern itself.
7. Conclusion & Forward View
Japanese Yen Futures (6J) and Micro JPY/USD Futures (MJY) are at a critical juncture. The inverted Head & Shoulders on the daily chart, supported by a bullish MACD divergence, highlights a potential reversal in progress. A breakout above the neckline at 0.006850 opens the door for an advance toward the 0.007100 UFO resistance zone.
While the setup looks constructive, it is crucial to recognize that even strong patterns can fail. This is why risk management—through proper stop-loss placement and careful position sizing—remains the most important aspect of any trading plan.
When charting futures, the data provided could be delayed. Traders working with the ticker symbols discussed in this idea may prefer to use CME Group real-time data plan on TradingView: www.tradingview.com - This consideration is particularly important for shorter-term traders, whereas it may be less critical for those focused on longer-term trading strategies.
General Disclaimer:
The trade ideas presented herein are solely for illustrative purposes forming a part of a case study intended to demonstrate key principles in risk management within the context of the specific market scenarios discussed. These ideas are not to be interpreted as investment recommendations or financial advice. They do not endorse or promote any specific trading strategies, financial products, or services. The information provided is based on data believed to be reliable; however, its accuracy or completeness cannot be guaranteed. Trading in financial markets involves risks, including the potential loss of principal. Each individual should conduct their own research and consult with professional financial advisors before making any investment decisions. The author or publisher of this content bears no responsibility for any actions taken based on the information provided or for any resultant financial or other losses.

Tariffs Effect on InflationIn April, inflation was at its lowest point. It was also the month when the 'Liberation Day' tariffs were introduced, applying a 10% baseline tariff to most countries.
But it wasn’t until August—when the July Core CPI rose to 3.1% from its April low of 2.8%— and now investors began to question whether inflation will be trending higher in the near future with now higher tariffs set in after 1st August.
10 Year Yield Futures
Ticker: 10Y
Minimum fluctuation:
0.001 Index points (1/10th basis point per annum) = $1.00
Disclaimer:
• What presented here is not a recommendation, please consult your licensed broker.
• Our mission is to create lateral thinking skills for every investor and trader, knowing when to take a calculated risk with market uncertainty and a bolder risk when opportunity arises.
CME Real-time Market Data help identify trading set-ups in real-time and express my market views. If you have futures in your trading portfolio, you can check out on CME Group data plans available that suit your trading needs www.tradingview.com

Nasdaq Hits New All Time HighThe big news of the session today was the CPI report, which rose by a less than expected amount in July. Initially, equity markets jumped off of the report and were able to close the day higher after some back and forth price action. THe Russell was the leader which traded up near 3% on the day while the S&P and Nasdaq traded to their all time high prices. While the Nasdaq was at an all time high, the Russell is looking to cross a critical level that traders have not seen since February of this year.
Outside of the equities, the significant jump in the Crypto markets continued today which was led by Ether futures and Solana futures which both traded up about 8% on the day. Ether futures have been on an incredible stretch to the upside and have now reached a level not seen since December of 2021, showing strong continued momentum. Bitcoin has also continued to slowly climb higher and will be looking to re-test its all time high price which is right near $123,615.
If you have futures in your trading portfolio, you can check out on CME Group data plans available that suit your trading needs tradingview.com/cme/
*CME Group futures are not suitable for all investors and involve the risk of loss. Copyright © 2023 CME Group Inc.
**All examples in this report are hypothetical interpretations of situations and are used for explanation purposes only. The views in this report reflect solely those of the author and not necessarily those of CME Group or its affiliated institutions. This report and the information herein should not be considered investment advice or the results of actual market experience.
Who Has Bought the Most GoldSince the inflation hit a high at 9% in 2022, China, Turkey and Poland have been the top 3 buyers of Gold, including in the first two quarters of this year.
It’s not just these countries; many other central banks have been stockpiling gold since (iii) July 2022. Then gold prices were at around US$1,800.
Are central banks still buying as much gold today?
Micro Gold Futures and Options
Ticker: MGC
Minimum fluctuation:
0.10 per troy ounce = $1.00
Disclaimer:
• What presented here is not a recommendation, please consult your licensed broker.
• Our mission is to create lateral thinking skills for every investor and trader, knowing when to take a calculated risk with market uncertainty and a bolder risk when opportunity arises.
CME Real-time Market Data help identify trading set-ups in real-time and express my market views. If you have futures in your trading portfolio, you can check out on CME Group data plans available that suit your trading needs www.tradingview.com
