Meta vs Microsoft – AI Euphoria or ExhaustionThe AI boom that lifted Big Tech to record highs may be entering its most delicate phase yet. Meta and Microsoft, two of the biggest winners of the AI wave, are now testing investors’ patience with a spending spree that’s starting to look excessive even by Silicon Valley standards.
In the last quarter alone, Meta, Microsoft, and Alphabet poured a combined $78 billion into data centers, GPUs, and AI infrastructure — an 89% increase year-over-year. The market’s reaction was telling: Meta and Microsoft both slipped after earnings, as traders began to question whether the growth in AI revenue can keep pace with the ballooning costs.
Microsoft’s $34.9 billion in capex didn’t deliver a higher growth rate for Azure, and Meta warned that next year’s spending will accelerate “significantly.” Google, by contrast, managed to calm investors with solid cloud growth and a more balanced tone — but even it now projects capex as high as $93 billion for 2025.
The common thread is clear: all three are betting the next decade on AI, but the near-term return on that investment remains murky. For Microsoft, capacity constraints still limit revenue growth. For Meta, the challenge is sharper — it’s spending on infrastructure without a clear monetization path, relying mostly on advertising optimization and early-stage hardware bets.
From a market perspective, both charts show fatigue setting in. After a year of relentless gains, momentum is flattening and volatility is creeping back in. The market still believes in AI — but it’s starting to question how much belief is already priced in.
If earnings growth doesn’t catch up with capex soon, these charts could be signaling the first cracks in the AI narrative. Whether this is just a pause or the beginning of a revaluation cycle will depend on how quickly these investments translate into tangible profit, not just GPU headlines.
Idea Summary:
NASDAQ:META and NASDAQ:MSFT are spending at record levels to stay ahead in AI, but returns are slowing. The charts hint at exhaustion — investors may be entering the first real “AI reality check.
Microsoft

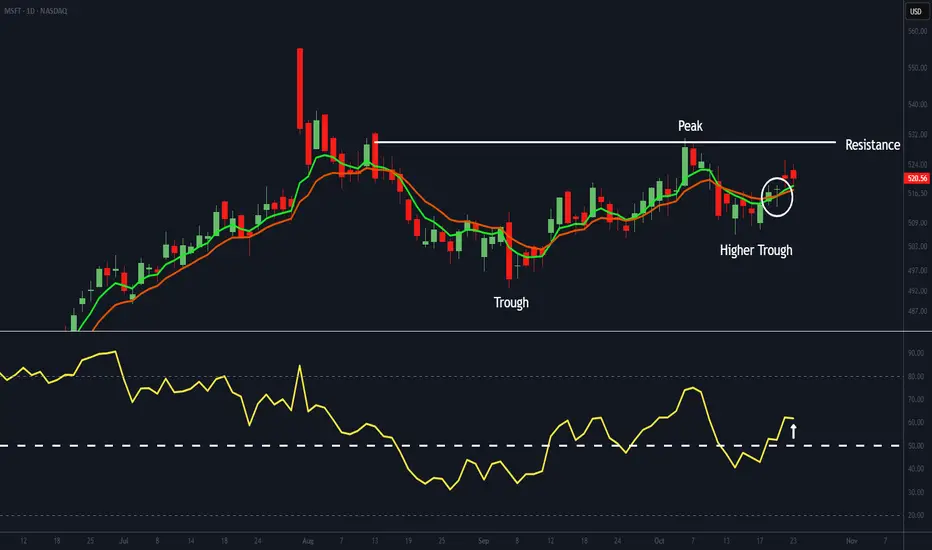
Microsoft’s Higher Trough Hints at a Bullish LegWe believe Microsoft (MSFT) has formed a higher trough - a bullish sign. Its EMAs have crossed positively, and the RSI has moved above 50, signalling improving momentum. If the RSI holds above that level, it will confirm a strengthening trend that could see MSFT challenge resistance near $530.
The company reports next Wednesday after the close, with investor attention centred on Azure and Copilot - the pillars of its AI strategy. Copilot, now embedded across Microsoft 365, Teams, and Outlook, is gaining strong enterprise adoption; for instance, Barclays recently expanded its licences from 15,000 to 100,000. The AI assistant could generate billions in recurring revenue, while Azure - which grew 39% year-on-year last quarter, its fastest pace in three years - remains the primary growth driver. Sustained progress in both areas will be crucial for maintaining investor confidence.
Although momentum has yet to reach full strength for a decisive breakout, it is clearly building. Next week’s earnings could provide the catalyst needed to push it over that threshold.
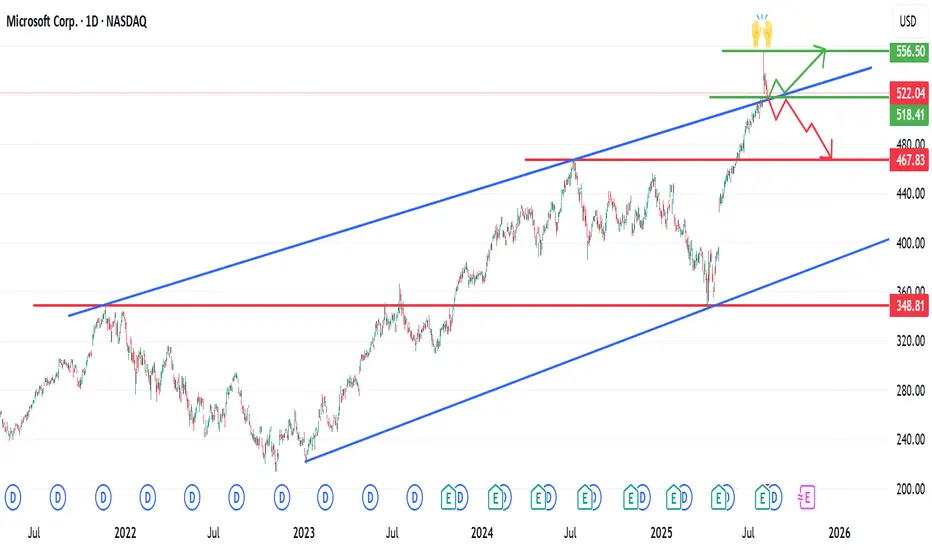
Microsoft: New Target Zone in PlaySince our last update, Microsoft shares have continued to decline, but there is still potential for an upside move. We do not yet consider the turquoise wave X to be complete. Once its high is established below the resistance at $562.17, we expect price to head lower toward the wave Y low. Our revised magenta long Target Zone is set between $477.87 and $451.84. The formation of this low should also mark the completion of magenta wave (4). Afterward, we anticipate the start of a new upward impulse within wave (5), which should push the stock above the $562.17 resistance and complete the larger blue wave (I). Alternatively, we assign a 36% probability to a scenario in which the recent high at $562.17 marked the end of beige wave alt.III . In this case, a decline below the support at $392.97 would be expected, forming the low of wave alt.IV .

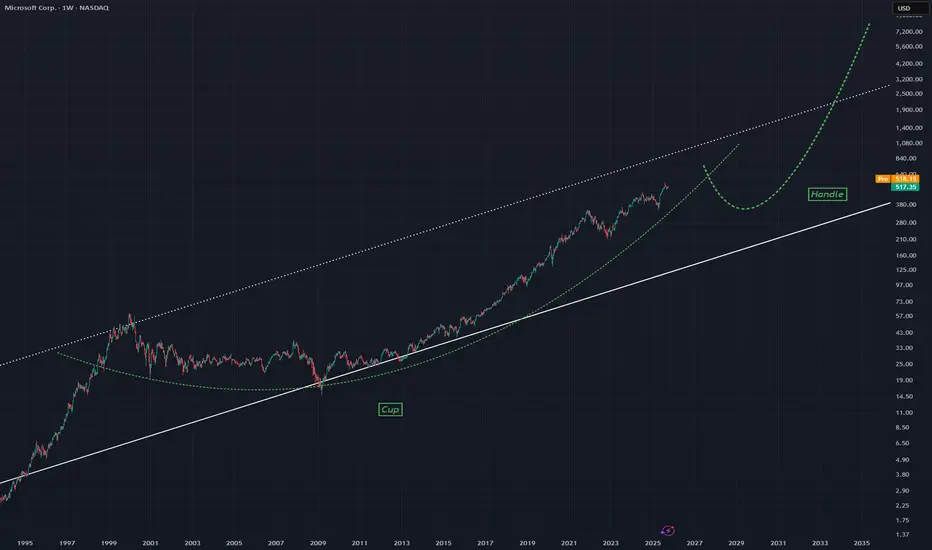
MSFT - Long Term Cup and Handle The price rising now could be considered a large cup formation with the handle still yet to be seen following a bearish move
Cup and Handle patterns are considered bullish on this timeframe.
Lower solid white trend line is a well respected trend line.
Weekly chart
Microsoft Macro BullMSFT is currently in grand wave 3/5!
PT: ~$500
Lengthening cycles & diminishing returns!
2nd Great Recession - Corrective Grand Wave 4 - 60-80% correction
Roaring 20s after - liquidity for final grand wave 5!

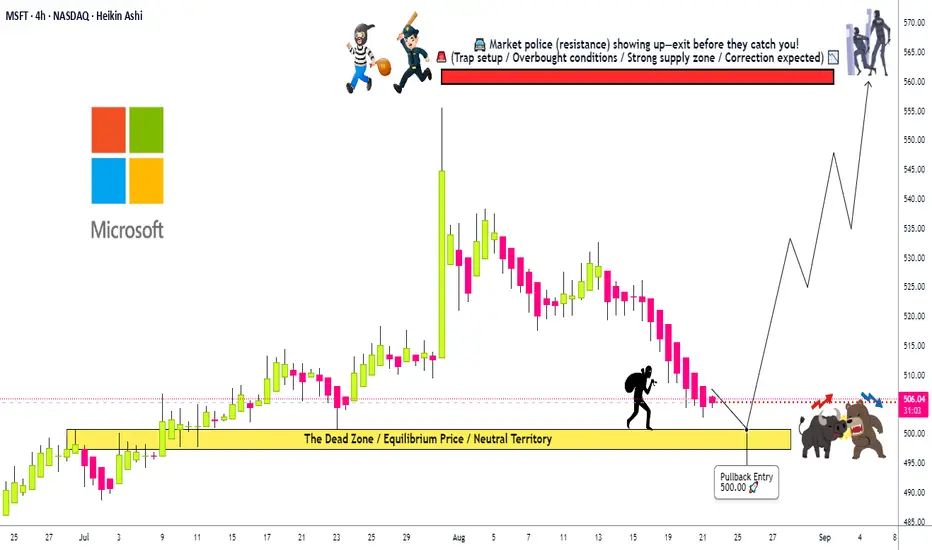
Microsoft: The Perfect Pullback Is Coming. Are You Ready?🌟 MSFT HEIST ALERT! 🌟 Steal from the Cops, Not from the Citizens! 🚔➡️🤑
Dear Ladies & Gentleman of the Thief Trading Guild, 🎩👒
Based on the 🔥Thief Trading Style Analysis🔥, here is our master plan to heist the Microsoft Corporation (MSFT) fortress. Our intel confirms a BULLISH ambush is setting up! It's time to loot! 💰💸✈️
🦹♂️ THE HEIST PLAN (SWING TRADE) 🦹♂️
Entry Point: The Perfect Pullback Loot Zone! 🎯
We're waiting for the asset to pull back to our LAYERED LIMIT ORDER TRAP! 🪤 Thief OG's use multiple entries to maximize the steal!
LAYER 1: 510.00 (First dibs!)
LAYER 2: 505.00 (Loading the bag!)
LAYER 3: 500.00 (MAIN HEIST - Perfect Pullback!)
LAYER 4: 498.00 (Bonus loot! Add more layers based on your own risk, thieves!)
Stop Loss: The Getaway Car Location! 🛑🏎️
This is Thief SL @ 485.00. This is where the trade idea is invalidated. Dear Thieves, adjust your final SL based on your own risk, strategy, and how many layers you used. Don't get caught! 👮♂️🚔
Target: The Police Barricade! 🚧🚨
Intel shows a major resistance wall (Police Barricade) at 565.00. Our mission is to escape with the stolen money BEFORE we get there! Escape Target: 560.00! Count your profits and live to trade another day! 💵🎉🤝
📢 THIEF'S BROADCAST 📢
Yo! Listen up, crew! 🗣️ If you're placing limit orders on this pullback, your stop loss should be set ONLY AFTER your order is filled! You feel me? Now, if you're smart, you'll place that stop loss where I told you 📍, but if you're a rebel, you can put it wherever you like 🤪 - just remember, you're playing with fire 🔥, and it's your risk, not mine! 👊
⚠️ TRADING ALERT : EARNINGS & NEWS ⚠️
MSFT is a big cap stock, and news/earnings can cause extreme volatility! To protect your stolen loot:
Avoid entering new layers before major news.
Consider taking some profit before earnings.
Use trailing stop-loss orders to protect running positions!
💖 Supporting our robbery plan = 💥Hitting the Boost Button💥 It fuels our getaway car and helps us find the next big heist! Let's make stealing money look easy! 🏆💪❤️🎉
I'll see you at the next heist, so stay tuned! 🤑🐱👤🤗🤩
Microsoft (MSFT) Technical Update & its channelMicrosoft (MSFT) Technical Update & its channel
Microsoft began forming a long-term ascending channel as far back as November 2021, marked by three higher highs and two higher lows, as illustrated on the chart.
The price action became particularly interesting when it broke out of this channel, reaching a new all-time high (ATH) of approximately $557.
However, the underlying fundamentals (catalysts) were insufficient to sustain momentum at that level, leading to a pullback.
The stock is now consolidating around the $522 zone — a key confluence area where the ascending trendline meets a horizontal support level.
Outlook:
If price breaks below this zone and re-enters the channel, a deeper correction could follow, with potential downside targets in the $500 – $480 range.
As always, I encourage you to review the chart, share your thoughts in the comments, and connect if you’d like to discuss further.
BTCUSDT.P 1D Time frameMarket Overview
Current Price: ~$112,380
Daily Change: Slight dip (around –0.3%)
Volatility: At multi-month lows, meaning the market is consolidating before a possible breakout.
📈 Key Levels
Immediate Resistance: $112,800 → price needs to clear this for upside continuation.
Next Resistance Zones: $114,000 → $116,000, and further up around $128,000.
Immediate Support: $111,000 → first cushion below current price.
Deeper Support: $110,000, then $107,800–108,000.
🔎 Technical Indicators
RSI (14-day): ~43 → Neutral, showing neither overbought nor oversold conditions.
MACD: Bullish crossover → suggests upward momentum is building.
Stochastic Oscillator: Near oversold → possible short-term bounce.
🧭 Outlook
Bullish Case: A sustained breakout above $114,000 could open a rally toward $128,000.
Sideways Case: Holding between $111,000 and $113,000 keeps Bitcoin in consolidation.
Bearish Case: A break below $110,000 could trigger a move toward $108,000 or even $102,000.
Overall Bias: Moderately bullish, but the market is in a tight range and waiting for a breakout.

MSTR 1D Time frameMarket Snapshot
Current Price: ~$328.50
Daily Change: -0.4% (approx)
Technical Overview
Indicators & Momentum
RSI (14-day): ~40 → Neutral, slightly below the midpoint—no major squeeze yet.
MACD: Negative (~–1.6) → Weak bearish momentum.
Stochastic Oscillator: Around 31 → Neutral to slightly oversold.
Stochastic RSI: Overbought zone → Possible short-term exhaustion.
Williams %R: ~–39 → Suggests room for both upside and downside.
ADX: ~18–26 → Indicates a weak to moderate trend—market lacks strong direction.
Moving Averages
Short-term moving averages (like 5-day and 10-day) show buy signals, while broader averages—including the 20-day, 50-day, 100-day, and 200-day—are all negative, suggesting broader downward pressure.
Support & Resistance
Based on various pivot point analyses:
Immediate Support: ~$324–325
Near-term Support Zone: ~$320
Immediate Resistance: ~$332–334
Further Resistance: ~$340–345
Broader Technical & Market Context
Downtrend in Play: The stock has declined nearly 40% from its July highs and is approaching its lowest levels since April.
Death Cross Forming: The 50-day moving average is nearing a bearish crossover below the 200-day average.
Diving Technical Ratings: Most moving averages and oscillators point to a negative bias—short-term signals are weak, and longs are retreating.
Bullish Divergence? Some chart setups hint at a potential wedge or triangle pattern with possible bullish divergence, but these are speculative and not yet confirmed.
MicroStrategy remains under pressure, with indicators pointing overwhelmingly to neutral or bearish signals. While short-term moving averages show minor support, the broader technical picture remains weak—and a breakout above ~$334 would be needed to suggest a reversal.

NVDA 2HourTime frameNVDA 2-Hour Snapshot
Current Price: $170.76 USD
Previous Close: $168.31 USD
Day Range: $166.74 – $170.97 USD
52-Week Range: $139.34 – $200.00 USD
Volume: 170,370,750
VWAP: $169.67 USD
Market Cap: $1.1 Trillion
🔎 Technical Indicators
Relative Strength Index (RSI): 39.44 — Neutral
Moving Averages:
5-period: $169.68 — Sell
10-period: $174.59 — Sell
20-period: $177.06 — Sell
50-period: $172.58 — Sell
100-period: $150.61 — Buy
200-period: $139.34 — Buy
Moving Average Convergence Divergence (MACD): -0.91 — Buy
Stochastic Oscillator: 20.33 — Neutral
Commodity Channel Index (CCI): -119.52 — Buy
Average True Range (ATR): 4.93
📈 Market Sentiment
Pivot Points:
Resistance: $175.00 USD
Support: $165.00 USD
📅 Outlook
Bullish Scenario: A breakout above $175.00 USD could signal a move toward $185.00 USD.
Bearish Scenario: A drop below $165.00 USD may lead to further downside.
Overall Bias: Neutral, with mixed signals from moving averages and momentum indicators.

AMZN 2Hour Time frameAMZN 2-Hour Snapshot
Current Price: $238.24 USD
Change: +1.02% from the previous close
Intraday High: Not available
Intraday Low: Not available
🔎 Technical Indicators
Relative Strength Index (RSI): Neutral
Moving Averages:
5-period MA: Not available
10-period MA: Not available
20-period MA: Not available
50-period MA: Not available
📈 Market Sentiment
Pivot Points:
Resistance: Not available
Support: Not available
📅 Outlook
Bullish Scenario: A breakout above the current price could lead to further gains.
Bearish Scenario: A drop below the current price may test support levels.
Overall Bias: Neutral, with mixed signals from moving averages and momentum indicators.

BTCUSDT 2Hour Time frameBTC/USDT 2-Hour Snapshot
Current Price: $112,349.00
Change: -0.29% from the previous close
Intraday High: $112,891.00
Intraday Low: $110,812.00
🔎 Technical Indicators
Relative Strength Index (RSI): Neutral
Moving Averages:
7-period MA: $112,376 (short-term support)
25-period MA: $111,484 (medium-term support)
99-period MA: $113,049 (short-term resistance)
📈 Market Sentiment
Pivot Points:
Resistance: $113,650
Support: $108,666
📅 Outlook
Bullish Scenario: A breakout above $113,650 could signal a move toward $120,000.
Bearish Scenario: A drop below $108,666 may lead to further downside.
Overall Bias: Neutral, with mixed signals from moving averages and momentum indicators.

BANKNIFTY 45Minutes Time frameBANKNIFTY 45-Minute Snapshot (Updated)
Current Price: 54,533 INR
Change: +0.77% (approx) from previous close
Day's Range: 54,200 – 54,600 INR (intraday estimate)
52-Week Range: 45,000 – 60,000 INR
🔎 Technical Indicators
RSI (14): ~65 — Slightly overbought, watch for pullbacks
MACD: Positive, bullish momentum
Moving Averages:
5-period SMA: 54,300 — Price above SMA → Buy signal
10-period SMA: 54,100 — Price above SMA → Buy signal
20-period SMA: 53,800 — Price above SMA → Buy signal
50-period SMA: 53,200 — Price above SMA → Buy signal
🔑 Key Levels
Resistance:
R1: 54,600 — Immediate resistance
R2: 55,000 — Psychological/round number resistance
Support:
S1: 54,300 — Near-term support
S2: 54,000 — Stronger support
📅 Outlook
Bullish Scenario: Price holds above 54,500 and breaks 54,600 → upward move toward 55,000.
Bearish Scenario: Price falls below 54,300 → pullback to 54,000 possible.
Overall Bias: Moderately bullish with strong upward momentum, but near-term resistance around 54,600.

NIFTY 45Minutes Time frameNifty 45-Minute Snapshot
Current Price: 24,976.70 INR
Change: +0.42% from the previous close
Recent High: 24,970.00 INR (August 28, 2025)
Recent Low: 23,500.00 INR (March 13, 2025)
🔎 Technical Indicators
RSI (14): Neutral
MACD: Bullish momentum
Moving Averages:
5-period SMA: Buy signal
10-period SMA: Buy signal
20-period SMA: Buy signal
50-period SMA: Buy signal
📈 Market Sentiment
Golden Cross: The Nifty 50 recently formed a "golden cross," where the 50-day moving average crossed above the 200-day moving average, indicating a bullish trend.
Analyst Outlook: Analysts maintain a positive outlook on Nifty 50, with a consensus rating of "Buy" and a 12-month price target suggesting potential upside.

SPX 3Hour Time frameSPX 3-Hour Snapshot
Current Price: 6,512.62 USD
Change: +0.21% from the previous close
Recent High: 6,508.23 USD (August 28, 2025)
Recent Low: 5,500.00 USD (March 13, 2025)
🔎 Technical Indicators
RSI (14): Neutral
MACD: Bullish momentum
Moving Averages:
5-period SMA: Buy signal
10-period SMA: Buy signal
20-period SMA: Buy signal
50-period SMA: Buy signal
📈 Market Sentiment
Golden Cross: The S&P 500 recently formed a "golden cross," where the 50-day moving average crossed above the 200-day moving average, indicating a bullish trend.
Business Insider
Analyst Outlook: Barclays raised its 2025 year-end S&P 500 target to 6,450, citing stronger-than-expected corporate earnings and optimism around artificial intelligence.
Reuters
📅 Outlook
Bullish Scenario: A breakout above 6,508.23 USD could lead to a push toward 6,600 USD and higher.
Bearish Scenario: A drop below 6,400 USD may test support around 6,200 USD.
Overall Bias: Moderately bullish, with positive momentum but facing near-term resistance.

HOOD 3Hour Time frameHOOD 3-Hour Snapshot
Current Price: $118.50
Change: +1.21% from the previous close
Market Cap: $82.63 billion
P/E Ratio: 46.21
EPS (TTM): $1.96
🔎 Key Levels
Resistance:
R1: $120.00 (recent high)
R2: $125.00 (next resistance zone)
Support:
S1: $115.00 (immediate support)
S2: $110.00 (next support level)
📈 Technical Indicators
RSI (14): 43.40 — Neutral
MACD: 0.69 — Bullish momentum
Moving Averages:
5-period SMA: $116.00 — Buy signal
10-period SMA: $113.00 — Buy signal
20-period SMA: $110.00 — Buy signal
50-period SMA: $105.00 — Buy signal
📌 Market Sentiment
S&P 500 Inclusion: Robinhood is set to join the S&P 500 index on September 22, 2025, replacing Caesars Entertainment. This milestone reflects the company's growth and stability in the financial technology sector.
Reuters
Recent Performance: The stock has gained approximately 496% over the past 12 months, driven by strong financial performance and increased user engagement.
Barron's
Analyst Outlook: Analysts maintain a positive outlook on HOOD, with a consensus rating of "Buy" and a 12-month price target suggesting potential upside.
TipRanks
📅 Outlook
Bullish Scenario: A breakout above $120.00 could lead to a push toward $125.00 and higher.
Bearish Scenario: A drop below $115.00 may test support around $110.00.
Overall Bias: Moderately bullish, with positive momentum but facing near-term resistance.

BABA 3Hour Time frameBABA 3-Hour Snapshot
Current Price: $147.10
Change: +4.18% from the previous close
Market Cap: $347.34 billion
P/E Ratio: 16.47
EPS (TTM): $8.84
Beta: 0.54
Dividend Yield: 0.73%
🔎 Key Levels
Resistance:
R1: $148.50 (prior high and Fibonacci cluster)
R2: $157.80 (Fibonacci 0.382 retracement)
Support:
S1: $135.00 (recent breakout level)
S2: $130.00 (next support level)
📈 Technical Indicators
RSI (14): 62.82 — Neutral
MACD: 4.08 — Bullish momentum
Moving Averages:
5-period SMA: $135.30 — Buy signal
10-period SMA: $128.98 — Buy signal
20-period SMA: $125.03 — Buy signal
50-period SMA: $119.26 — Buy signal
📌 Market Sentiment
Catalyst: Shares surged ~13% following a favorable court ruling, marking the highest close since March 2025.
Sector Performance: Positive momentum in the Chinese tech sector, with Alibaba leading gains.
Analyst Outlook: Average 12-month price target of $167.17, indicating a 13.64% upside from current levels.
StockAnalysis
📅 Outlook
Bullish Scenario: A breakout above $148.50 could lead to a push toward $157.80 and higher.
Bearish Scenario: A drop below $135.00 may test support around $130.00.
Overall Bias: Moderately bullish, with positive momentum but facing near-term resistance.

COIN 3Hour Time frame📊 COIN 3-Hour Snapshot
Current Price: $318.78
Change: +5.49% from the previous close
Intraday Range: Not specified
Market Cap: Approximately $83.3 billion
P/E Ratio: Not specified
Beta: 2.89
🔎 Key Levels
Resistance:
R1: $318.78 (recent high)
R2: $330.00 (next resistance zone)
Support:
S1: $310.00 (immediate support)
S2: $300.00 (next support level)
📈 Technical Indicators
RSI (14): Not specified
MACD: Not specified
Moving Averages:
5-period SMA: Not specified
50-period SMA: Not specified
200-period SMA: Not specified
📌 Market Sentiment
Catalysts: Positive momentum following recent gains and analyst upgrades.
Sector Performance: Cryptocurrency market showing strength, with Coinbase leading gains among peers.
Options Activity: Significant trading in call options at $318.78 strike price, indicating bullish sentiment.
📅 Outlook
Bullish Scenario: A breakout above $318.78 could lead to a push toward $330.00 and higher.
Bearish Scenario: A drop below $310.00 may test support around $300.00.
Overall Bias: Moderately bullish, with positive momentum but facing near-term resistance.

HCLTECH 3Hour Time frameHCL Technologies (HCLTECH) 3-Hour Snapshot
Current Price: ₹1,470.00
Change: +1.72% from the previous close
Intraday Range: ₹1,432.10 – ₹1,471.90
Volume: 2,495,658 shares traded
Market Cap: ₹3.97 trillion
P/E Ratio: 23.39
Beta: 1.04 (indicating moderate volatility relative to the market)
🔎 Key Levels
Resistance:
R1: ₹1,471.90 (recent high)
R2: ₹1,490.00 (next resistance zone)
Support:
S1: ₹1,432.10 (immediate support)
S2: ₹1,400.00 (next support level)
📈 Technical Indicators
RSI (14): 62.15 — Neutral to slightly bullish
MACD: Positive, indicating upward momentum
Moving Averages:
5-period SMA: ₹1,455.00 — Buy signal
50-period SMA: ₹1,440.00 — Buy signal
200-period SMA: ₹1,400.00 — Buy signal
📌 Market Sentiment
Catalysts: Positive momentum following recent gains and analyst upgrades.
Sector Performance: IT sector showing strength, with HCL Technologies leading gains among peers.
Options Activity: Significant trading in call options at ₹1,470 strike price, indicating bullish sentiment.
📅 Outlook
Bullish Scenario: A breakout above ₹1,471.90 could lead to a push toward ₹1,490.00 and higher.
Bearish Scenario: A drop below ₹1,432.10 may test support around ₹1,400.00.
Overall Bias: Moderately bullish, with positive momentum but facing near-term resistance.

RELIANCE 1D Time frame Reliance Industries (RELIANCE)
Current Price: ₹1,380.10
Change: +0.28% from the previous close
Intraday Range: ₹1,375.50 – ₹1,381.20
Volume: 9,753,126 shares traded
Market Cap: ₹18.67 trillion
P/E Ratio: 25.10
EPS (TTM): ₹60.23
Dividend Yield: 0.40%
Beta: 0.88 (indicating lower volatility relative to the market)
🔎 Key Levels
Resistance:
R1: ₹1,385.00 (recent high)
R2: ₹1,400.00 (psychological level)
R3: ₹1,420.00 (next resistance zone)
Support:
S1: ₹1,375.50 (immediate support)
S2: ₹1,360.00 (next support level)
S3: ₹1,350.00 (longer-term support)
📈 Technical Indicators
RSI (14): 58.21 — Neutral to slightly bullish
MACD: 2.15 — Positive momentum
Moving Averages:
5-day SMA: ₹1,373.00 — Buy signal
50-day SMA: ₹1,350.00 — Buy signal
200-day SMA: ₹1,300.00 — Buy signal
Stochastic Oscillator: 75.00 — Overbought, indicating potential for a pullback
📌 Market Sentiment
Catalysts: Positive momentum following recent gains and analyst upgrades.
Sector Performance: Oil & Gas sector showing strength, with Reliance leading gains among peers.
Options Activity: Significant trading in call options at ₹1,400 strike price, indicating bullish sentiment.
📅 Outlook
Bullish Scenario: A breakout above ₹1,385.00 could lead to a push toward ₹1,400.00 and higher.
Bearish Scenario: A drop below ₹1,375.50 may test support around ₹1,360.00.
Overall Bias: Moderately bullish, with positive momentum but facing near-term resistance.

AMZN 1D Time frame📊 Amazon (AMZN) Daily Snapshot
Current Price: $238.24
Change: +1.02% from the previous close
Intraday Range: $235.08 – $238.85
Volume: 27,033,778 shares traded
🔎 Key Levels
Resistance:
R1: $238.85 – $239.50 (short-term resistance zone)
R2: $242.52 (52-week high)
Support:
S1: $235.08 – $235.84 (short-term support zone)
S2: $230.00 (psychological support)
📈 Technical Indicators
RSI (14): 60.03 — Neutral to slightly bullish
MACD: 2.30 — Positive momentum
Moving Averages:
5-day SMA: $233.62 — Buy signal
50-day SMA: $226.19 — Buy signal
200-day SMA: $213.56 — Buy signal
📌 Market Sentiment
Catalysts: Positive market sentiment, with AMZN outperforming key competitors in recent sessions.
Sector Performance: Tech sector showing strength, with AMZN leading gains among peers.
📅 Outlook
Bullish Scenario: A breakout above $238.85 could lead to a push toward $242.52 (52-week high).
Bearish Scenario: A drop below $235.08 may test support around $230.00.
Overall Bias: Moderately bullish, with positive momentum but facing near-term resistance.

TSLA 1D Time frame Tesla (TSLA) Daily Snapshot
Current Price: $346.97
Change: +0.61% from the previous close
Intraday Range: Not specified
Trend: Bullish continuation
🔎 Key Levels
Resistance:
R1: $347.17 – $350.85 (short-term resistance zone)
R2: $360.56 – $362.90 (medium-term resistance zone)
Support:
S1: $324.94 – $330.14 (short-term support zone)
S2: $313.64 (trendline support)
S3: $302.62 (horizontal support)
📈 Technical Indicators
RSI (14): 57.10 — Neutral
MACD: 5.23 — Sell signal
Moving Averages:
5-day EMA: $339.84 — Buy
50-day SMA: $324.49 — Buy
200-day SMA: $330.33 — Buy
📌 Market Sentiment
Catalysts: Positive market sentiment, with TSLA outperforming key competitors in recent sessions.
Sector Performance: Tech sector showing strength, with TSLA leading gains among peers.
📅 Outlook
Bullish Scenario: A breakout above $347.17 could lead to a push toward $360.56–$362.90.
Bearish Scenario: A drop below $324.94–$330.14 may test support around $313.64.
Overall Bias: Moderately bullish, with positive momentum but facing near-term resistance.

WIPRO 1D Time frame📊 Wipro Daily Snapshot
Current Price: ₹256.50
Change: Up 2.97% from the previous close
Volume: 804,499 shares traded, significantly higher than the 50-day average of 369,496
MarketWatch
🔎 Key Levels
Resistance: ₹253.70 (short-term)
Support: ₹239.55 (short-term)
52-Week High: ₹324.55 (January 23, 2025)
52-Week Low: ₹239.55 (recent support level)
📈 Technical Indicators
RSI (14): Approximately 75 — indicates overbought conditions
MACD: Positive — suggests upward momentum
Moving Averages: Trading above 5-day (₹255.97), 50-day (₹248.47), and 200-day (₹247.12) SMAs — bullish trend
Stochastic Oscillator: Indicates overbought conditions
ADX: Approximately 17.49 — suggests a weak trend strength
Top Stock Research
📌 Market Sentiment
Catalysts: Positive market sentiment, with Wipro outperforming key competitors like HCL Technologies and Tata Consultancy Services in recent sessions
MarketWatch
Sector Performance: IT sector showing strength, with Wipro leading gains among peers
📅 Outlook
Bullish Scenario: Sustained trading above ₹253.70 could lead to a push toward ₹277.65 (long-term resistance)
Bearish Scenario: A drop below ₹239.55 may test support around ₹234.20 (mid-term support)
