Huge Moves Coming for Silver MinersNYSE:PAAS has some of the best structure I've seen in any of the miners, along with NYSE:AG and $FSM. July 2024 was the beginning of a rising, complex correction. Price could always reject off the top of the channel and pull back to $26, but any dip here is a buying opportunity. We are headed for far higher prices going forward based on this structure.
The impulsive bullish waves in 2024 are clear.
The rising corrective pattern is mega bullish for the next wave.
I believe we are already in the next wave.
If this thing breaks above $30, it will fly.
I am taking no profits until we hit $55-60.
Miners

GOLD Update🚨📊 GOLD Update
GOLD has formed a clear red resistance zone 🔴,
and price is reacting below it.
A breakout above this zone is needed
to confirm further upside.
Until then,
the trend remains capped by resistance.

Silver = to the moon??? September 03, 2025Who’s Loading Up:
A top dog at Pan American Silver Corp., a heavyweight in North American silver digs, just scooped up a hefty chunk of shares.
Deal Size: This exec grabbed 50,000 shares at $22.50 a pop on August 28, 2025, dropping $1.125 million—talk about putting skin in the game!
Company Lowdown
Pan American Silver Corp. runs 10 mines across the Americas, packing 468 million ounces of silver and 6.7 million ounces of gold. Based out of Vancouver, they’ve got cash flowing like a river, fueling big bets like La Colorada Skarn and Escobal.
Sector Vibes:
• The Silver Institute’s calling for a fifth straight supply crunch in 2025, with photovoltaics and AI tech demand hitting all-time highs.
• Tariff threats, green energy boom, and a possible Fed rate cut in September 2025 could send silver soaring.
Big Funds Jumping In
Last quarter (June–August 2025), heavy hitters like Sprott Asset Management (+8% in Pan American), BlackRock Inc. (+5% in iShares Silver Trust), and Invesco Ltd. (+6% in VanEck Silver Miners ETF) piled into silver.
Buzz on X says Saudi Central Bank’s dipping its toes into silver via iShares Silver Trust (SLV), ditching its gold-only playbook.
London Vaults Drying Up
The LBMA’s silver stash is under siege from a supply deficit. With 150 million ounces short in 2024, the Silver Institute hints reserves might shrink 5–10% yearly if demand keeps raging, setting the stage for a price explosion.
1979 Boom & 2025–2026 Wild Cards
1979 Flashback: The Hunt Brothers’ silver grab, plus inflation and oil chaos, rocketed silver from $6 to $50/oz (+700%). Gold jumped from $300 to $850/oz on similar vibes.
2025–2026 Triggers:
Inflation’s sticky above 3%, the USD’s wobbling from tariffs, and a Fed cut looms in September 2025. Watch for U.S.-China trade wars, Middle East flare-ups, or a BRICS metals exchange—any could ignite a 1979-style silver rocket if deficits worsen.
Price Targets:
Short-Term (3 months): $60.00 (+46.9%)
Mid-Term (6–12 months): $120.00 (+193.7%)
Long-Term (18–24 months): $240.00 (+487.5%)
🤔🤔🤔🤔🤔🤔🤔🤔

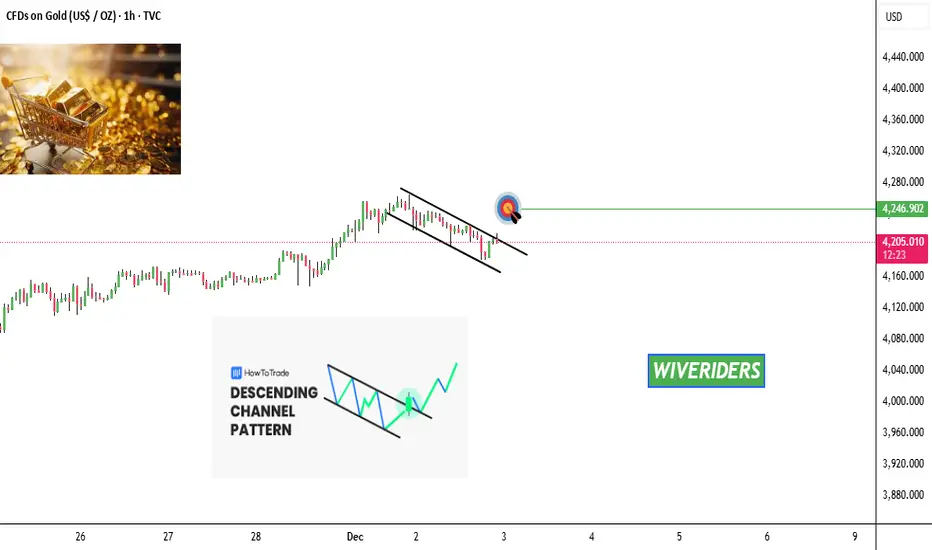
GOLD is forming a descending channel pattern 📊 GOLD Update
GOLD is forming a descending channel pattern 🔻📉 —
a structure that often leads to a strong move once price breaks out.
Right now, price is still moving inside the channel,
but if GOLD breaks above the descending trendline,
we could see momentum shift and price push toward the first target at the green line level 🟩.
Here’s the key breakdown:
Pattern: Descending Channel
Bullish signal triggers ONLY if we break out upward
A clean breakout = momentum toward the green target zone
Until breakout, sellers remain in control inside the channel
Watch for:
✔️ Strong breakout candle
✔️ Volume confirmation
✔️ Retest holding as support (optional but bullish)
If breakout happens → first target = green line level 🟩
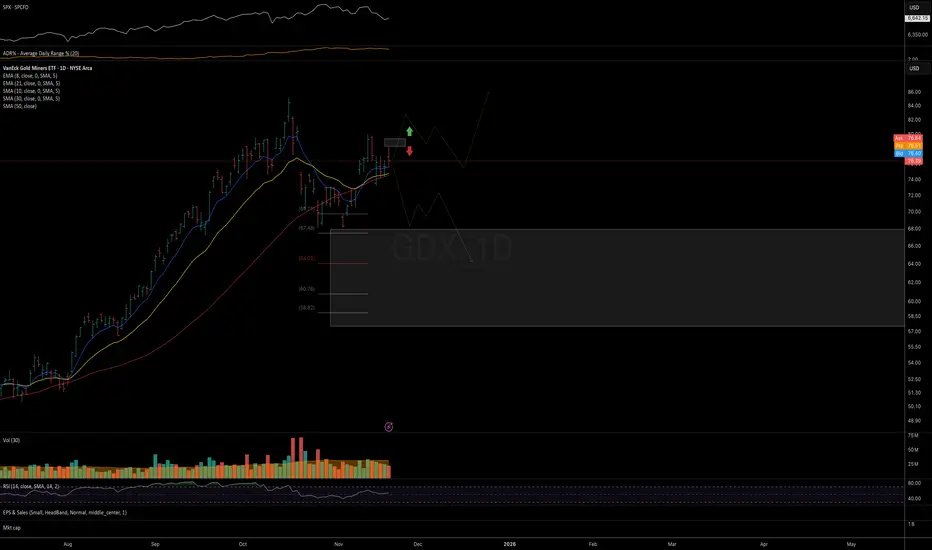
GDX: two alternative scenarios for the coming weeks. Tracking two alternative scenarios for the coming weeks.
But as long as price remains below the November highs, the preferred expectation is for one more leg down to re-test the November lows, and ideally a deeper move toward the 64 support zone.
If price manages to break out above the November highs, I would still prefer to see additional consolidation and a proper handle formation to complete the base before considering the move a more sustainable breakout.
Chart:
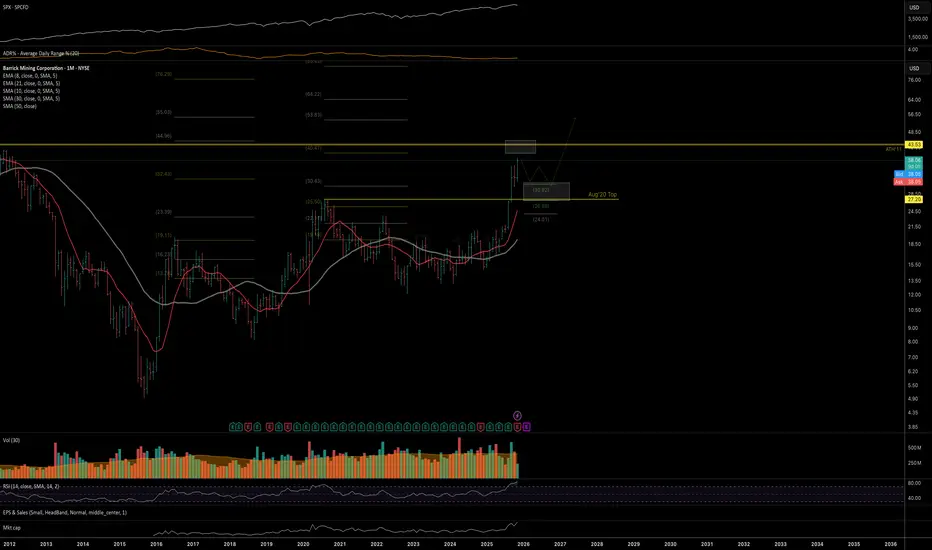
B: Macro trend-structurePrice may be approaching an important mid-term resistance in the low-40s, where a mid-term top formation is likely.
However, from the macro trend structure, any pullback into the 33–30 zone (retesting the Aug ‘20 highs) should provide a new buying opportunity, with the broader macro structure favoring a move above the 2011 ATH into 2026+.
Macro view (monthly chart):
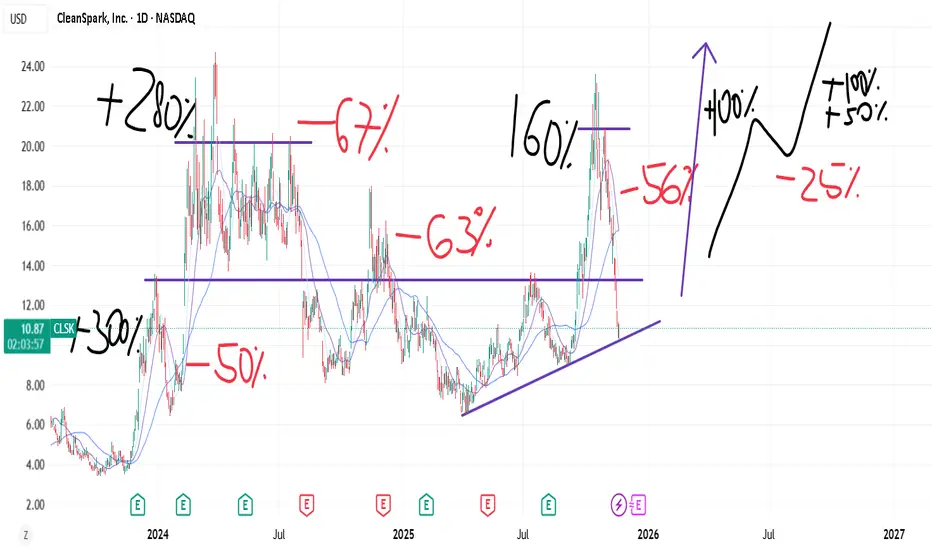
CLSK: Based on momentum principles.As long as BITSTAMP:BTCUSD delivers and AMEX:BLOK is relatively strong, and obviously NASDAQ:NVDA strong.
NASDAQ:CLSK every correction shows less damage (%) which I think is a bullish sign.
Momentum based on Dan Zanger principles. If you had a 160% rally. Even if trend was broken, I dont think you can kill a momentum this easily. Hence, at least "some" strength should follow. There are many examples, that I can show/fact proof.
The risks: I think TVC:TNX rallying is not good and TVC:DXY rally would both be a head wind.
Good: Gold topping should be defacto bottom for BTC near term? ie the driver for rotations. % chasing.
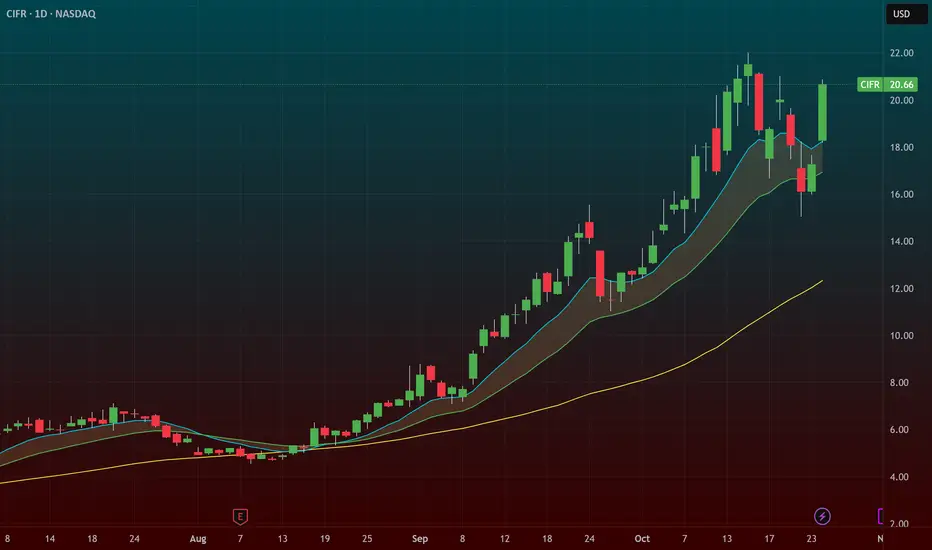
$CIFR – First 20 SMA Test + Flag Breakout SetupCipher Mining ( NASDAQ:CIFR ) is shaping up beautifully here — a flag breakout pattern forming right after a healthy pullback to the 20 SMA, something we haven’t seen during this entire run.
🔹 The Setup:
Pulled back from $22 → $15, finding strong support right at the 20 SMA.
Now back above the 9 EMA, showing buyers are stepping in early.
The chart has a tight flag pattern, ready to expand if crypto momentum holds.
🔹 Crypto Sector Context:
CRYPTOCAP:BTC and CRYPTOCAP:ETH both ripped over the weekend — classic sign of renewed risk appetite.
The entire crypto stock basket looks strong, and NASDAQ:CIFR + NASDAQ:IREN are the leaders.
This is the first real 20 SMA test of the move — often the best risk/reward entry point as dip buyers who missed the run jump in.
🔹 My Trade Plan:
1️⃣ Entry Zone: Watching for dips Monday or Tuesday to build a position near the 9 EMA.
2️⃣ If It Gaps Up: I’ll skip swing entries and just day trade it — avoid chasing strength.
3️⃣ Stop: Under the 20 SMA — clear line of invalidation.
Why I Like This Setup:
First 20 SMA retest = historically powerful spot in trending names.
Tight flag structure with crypto sector tailwinds.
Market psychology favors second-wave momentum plays like this one.
—
CLSK Attempting a significant resistance breakout!NASDAQ:CLSK has awoken at long last and has smashed through the wave 1 resistance High Volume Node straight into the Macro Triangle upper boundary i have been sharing in the weekly time frame posts. Breaking out above this and wave D at $20 will be a bullish signal with significant upside to come!
The High Volume Node resistance held as support in the big drop last week, quickly recovering back to highs showing strong demand.
The next local target is the wave D resistance $20 with continued upside in wave 3
Daily RSI is overbought but divergence yet and daily 200EMA has flicked positive.
Analysis is good unless we go back below wave 2 into the golden pocket.
Safe trading
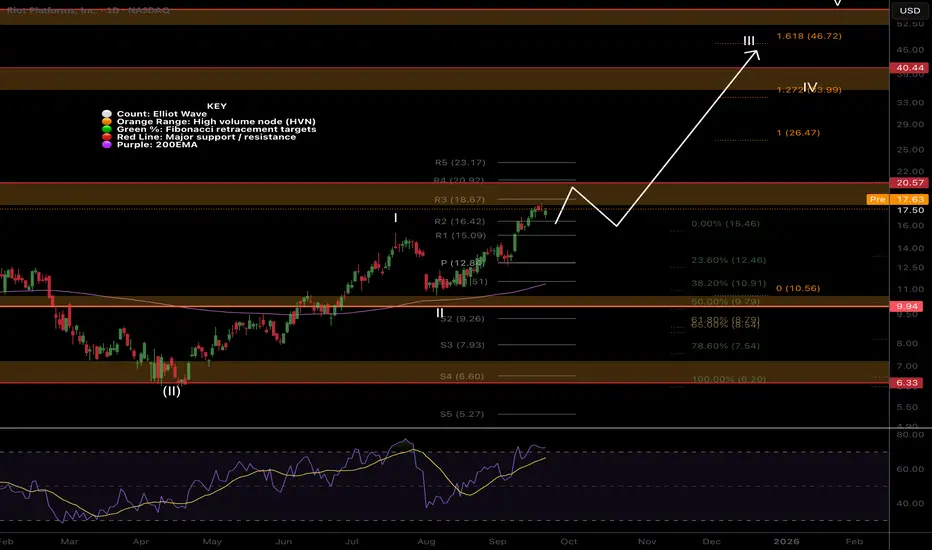
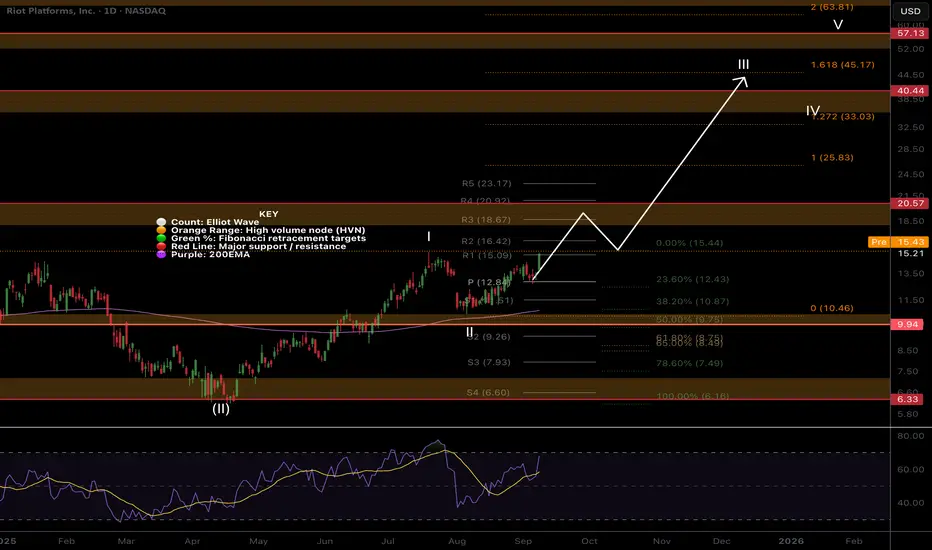
RIOT At First Target!Local Analysis / Targets / Elliot Wave
There was a lot of doubt on TradingView for this breakout but here we are! Price has now come into the High Volume Node resistance after nearly doubling. Wave III appears to be underway with a minimum expected target of $46 per Fibonacci extension tool. Breaking out of the resistance is key for now but once it happens price should move fast.
Standard Deviation Band Analysis
Standard deviation bands show price is only just overcoming its fair value so has plenty of momentum left in it. The SD+2 threshold is the next target at $30.
Safe trading
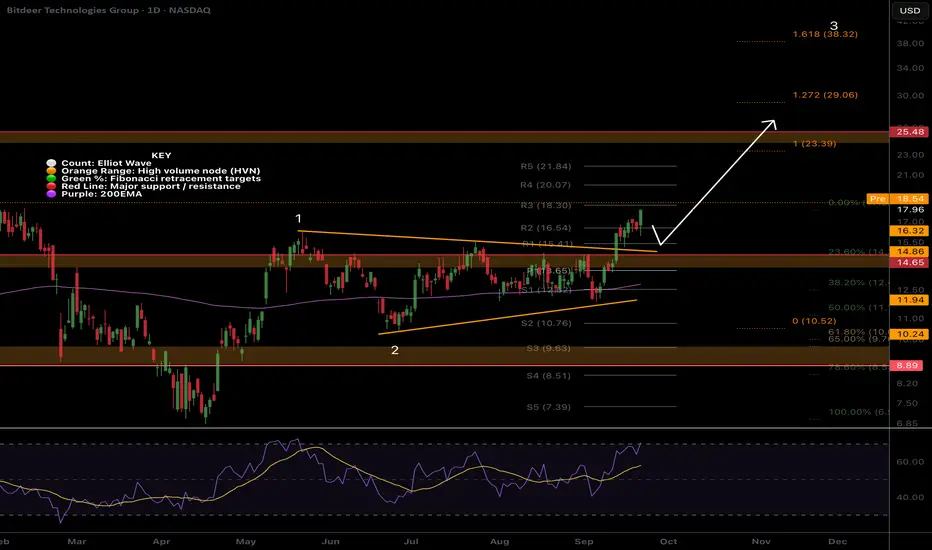
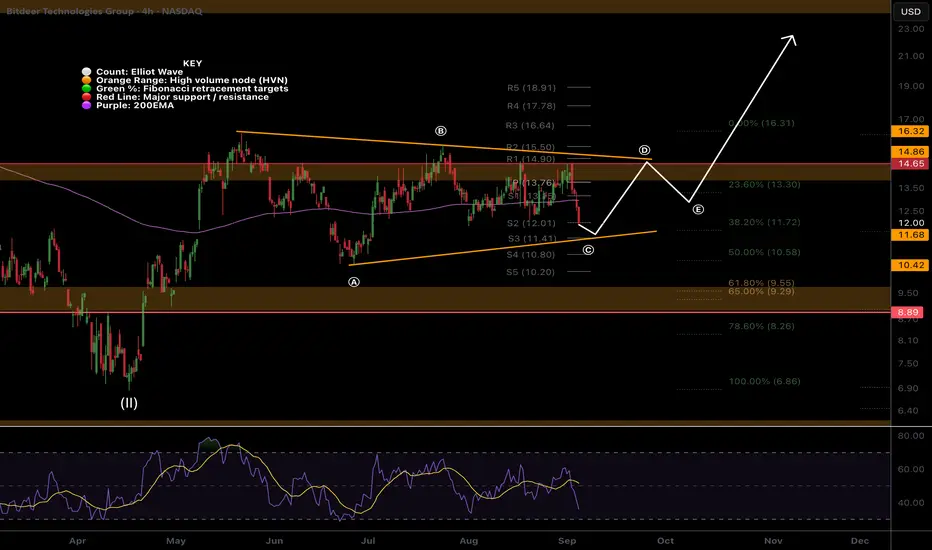
Bitdeer We got the Breakout! BTDRLocal Analysis / Targets / Elliot Wave
NASDAQ:BTDR Price is breaking out aggressively as predicted in previous analysis. We got the push above the descending resistance line. The next target is the $24 all time High Volume Node resistance but wave 3 minimum target is above $30 per the Fibonacci extension tool.
RSI is overbought but with no divergences yet and can remain this way for weeks.
Standard Deviation Band Analysis
Standard deviation bands fair value line was tested as support and price is about to breakout above the SD+3 threshold starting a new trend into price discovery with a $50 target. Traders should still be cautious of a rejection in this area.
Safe trading
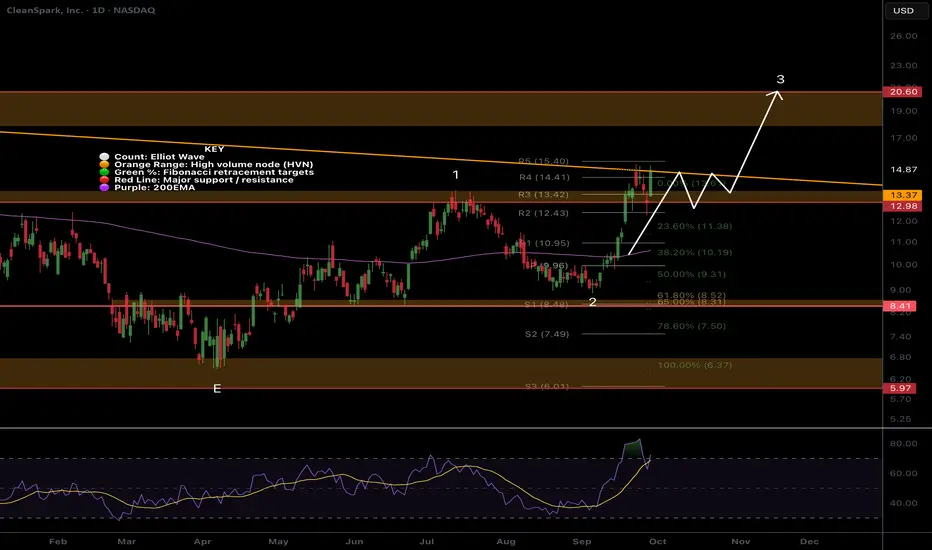
CLSK Moving Fast!Local Analysis / Targets / Elliot Wave
CLSK sentiment was awful as I explained a few weeks ago, it appeared to be in a macro triangle similar to XRP before the x10 breakout. That breakout is now underway with a huge move last week characteristic of wave 3 and reinforcing my analysis. Minimum wave 3 targets are well above $20 and price should move quickly once it over comes the triangle resistance it is now approaching at $15.
Price was front run above High Volume Node support and the golden pocket leaving limit orders behind forcing them to buy higher if they want to participate pushing the price up further.
Daily RSI is overbought but so was NASDAQ:IREN and that continued upwards for weeks, as has $WULF.
Standard Deviation Band Analysis
Standard deviation bands remain negatively sloped but I am expecting that to change and price continues upwards. That said, investors should be weary of a reversal in this area where price spends <5% of the time. Bulls are looking for a sustained move into the zone and a breakout above the SD+3 threshold offering a target of $50.
Safe trading

Equinox Gold 4H Chart Outlook Bullish ImpulseHere is my current take on AMEX:EQX Equinox Gold Corp. The 4H chart shows an unfolding bullish impulse. I hold this stock and have added to this position numerous times as shown on the chart. As the outlook suggest we could see a pull back in green wave iv at some point, which could provide another potential point to add to the allocation once it has played out. It's correlation to gold hasn't been very strong recently, but that can always change, I'm of the opinion that gold is overdue a pull back, I have linked one potential outlook on OANDA:XAUUSD , I have some other variations which I will work to post out soon. so keeping a close eye on Gold at these levels. More comments on the chart.

RIOT Continues wave 3.NASDAQ:RIOT is moving well in wave 3 after price completed wave 2 at the triple support -0.5 Fibonacci retracement, High Volume Node (HVN) and daily 20EMA.
Fibonacci extension targets for wave 3 are minimum $45.17, which falls in line with wave 4 retesting the High Volume Node resistance as support at $34.
Daily RSI will put in bearish divergence if we continue higher today so watch out for that. An initial rejection or consolidation at $18 HVN is expected.
Analysis invalidated below $10.5
Safe trading
IREN Bear Divergence on the Daily, Deeper Pullback Ahead?NASDAQ:IREN appears to be pulling back locally in wave 4, filling the gap, with eyes on testing the daily pivot as support before continuing higher.
Price is significantly away from mean and catching continued momentum but this will fade as more people take profit.
Bearish divergence persists in the daily RSI and has been confirmed with the close below the signal line. If these signals fail it shows the strength of the momentum trend.
Continued upside target is playing the pivots to $40 and initial downside taregt is the previous all time high at $18.50
Safe trading

BTDR Still in a triangle, Wave c of (C) downNASDAQ:BTDR Bitdeer was rejected harshly on the 4th test of the High Volume Node (HVN) resistance, each test weakening the Node and adding probability to a breakout.
Wave c of an ABC within a triangle wave (C) appears to be underway with price closing below both the daily pivot and 200EMA. RSI has slight bullish divergence.
Until we get a break below wave (A) or a above wave (B) the analysis is good. Will readjust and update if anything changes. A breakdown below the triangle has a wave 2 target of the golden pocket Fibonacci retracement and HVN support at $9.63 and may offer a great buying opportunity.
Breakout target is the R5 daily pivot at $21.84
Safe trading
MARA Holding Tight!NASDAQ:MARA continues to lag behind the small cap Miners. It is attempting to break through the weekly 200EMA once more after the rejection from the weekly pivot and High Volume Node (HVN) resistance I warned about.
My long term outlook remains up in Elliot wave 3 towards the R% weekly pivot at $66.
The golden pocket and HVN support of the local retracement has yet to be tested as resistance which acts like a magnet for price.
RSI remains at the EQ and price remains just below the channel EQ.
Safe trading

Silver Acceleration PhaseGold and Silver are entering acceleration mode.
Silver tends to run into hyperdrive during gold's last major leg up. Gold could push to 3,800+ here, while Silver could run up to 45+.
The miners are very happy. Most of their technicals look amazing.
PAAS and FMS in particular are my favorites currently and look like they want to moon soon.

IREN Just Won't Quit! Wave 3 Behabviour!IREN Continues its push into price discovery with strong candle spread despite the drop in Bitcoin and range in the S&P. Strong wave 3 herding behaviour!
Price appears to be overextending in wave 5 of (iii) with a target of the R5 daily pivot.
Bearish divergence persists on the overbought RSI.
Safe trading

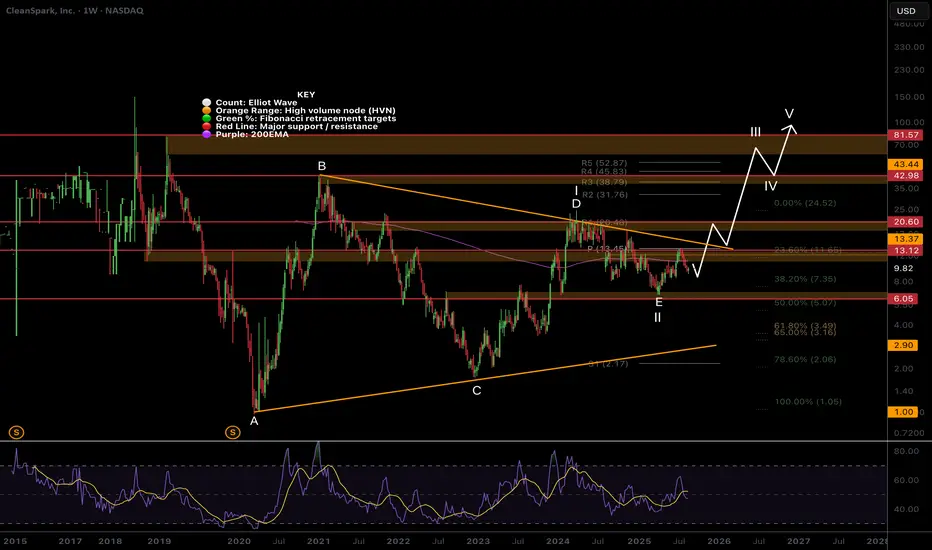
$CLSK Looks like XRP at $0.4 before the move to $3NASDAQ:CLSK is hated right now as much as XRP was when it ranged between $0.4-$0.8 for 4 years before it when ballistic.
CRYPTOCAP:XRP printed a huge macro triangle similar to what I have identified here for CLSK which looks complete at the triangle EQ, where wave E is expected to terminate! This finds confluence with the High Volume Node and 0.5 Fibonacci retracement.
Quadruple resistance lies ahead of the weekly 200EMA, major High Volume Node, weekly pivot point and descending resistance boundary, tested multiple times weakening the point. This built up pressure could provide an explosive move to price discovery.
I have left my alternative motif wave count on their as a secondary count (1-2) with similar targets.
RSI is at the channel EQ so plenty of upside left.
Analysis is invalidated below $6.05.
Safe trading
$BTDR Pressure Building?NASDAQ:BTDR still appears to be in a wave 2 triangle building pressure for a significant wave 3 up into price discovery.
Wave (II) found support a the golden pocket, shallower than the other miners! Price has tested the upper boundary of the triangle and High Volume Node multiple times at $15 and only once at the bottom threshold hinting at a breakout upwards. Each test makes the boundary weaker.
The weekly pivot point at $17 is the first area of resistance to watch followed by the all time high at $25
Analysis is invalidated below $6.44. RSI is only at the EQ so has room to grow.
Safe trading

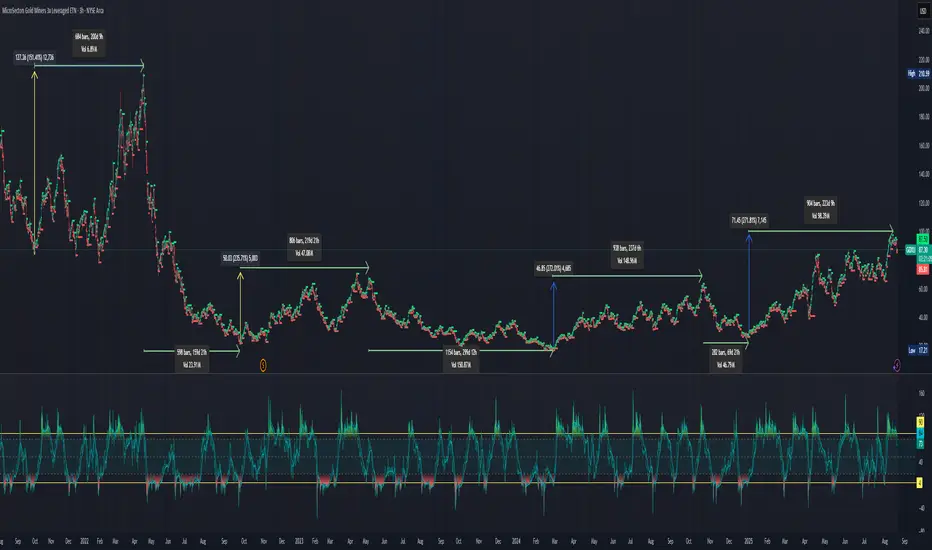
SHORT: Short term GDXU 2X pull back, is it now time to go GDXDI've laid out the major run ups and pull backs. The last 3 run ups have lasted 219 - 237 days. If the last peak was put in by GDXU it would put it at 225 days. I'm looking at this as a potential repeating pattern. Note the GDXU run ups based on a % gain from the bottom, assuming, the most recent peak was the final high in this run up. The run ups were +241%, +270%, and +279%. The run up also reasonable for the peak.
Big question, what about the draw downs. The last 2 have been -54%, -42%, and-60%. In GDXD, the inverse gold miners ETF 2X levered resulted in a gain of +90%, +58%, and +95%. The run up on the inverse side lasted 53, 20, and 22 days. GDXD is currently up +13% in the last 7 days.
Take aways, reduce/eliminate position in long GDXU and wait for a better buy in position and potential upside in the inverse gold miners etf.
Discovery Silver is now in Blue Sky Territory
The stock has broken into new all-time highs with no resistance ahead.
Momentum is strong, and the upside potential is wide open. very bullish
not financial advice
