SYNGENE - Gearing up for higher MoveThe stock after nearly 10 months of consolidation had come out of the consolidation zone and now it is attempting to take out the previous supply zone as well. As we can see in the weekly chart, the relative strength and the money flow index are positive. In the daily chart as well, you can find the relative strength, the buying pressure are all positive. However, the money flow has not picked up. Given these conditions, once the money flow also picks up, the stock is likely to go up higher after breaking out of the price rejection zone or the supply zone. A positive close above 858 level, will add to the conviction.
Money Flow Index (MFI)

MINDA CORP - Gearing up for More Upside ?After almost two months of side ways move the stock is on the verge of taking out the previous Price Rejection Zone. My checklist all ticked right
Relative Strength
Buying Pressure
Increased volume
Money Flow
Absolute Momentum
Increased Delivery volumes
There is a high probability of the stock moving into the next Higher trajectory. A positive close above 527 will add more conviction.

AFFLE - A stock to watchThe stock has been moving almost sideways for more than two years. Early this year it attempted to take out the old price rejection zone of two years at 1336 level, it failed and it was pushed down again below the 200 DMA. From there it started recovering and in the month of May the stock did make an attempt to take out this price rejection zone. It failed and again was pushed down below the 200 DMA. Now again it is making an attempt and it is crossed the rejection zone with a “Buying Climax” like Bar with a with widespread up bar on very high volume. Now the level 1390 is very significant now because once the price goes above this level it would cross the previous resistances from 2022 and also it would go above the supply shadow of the “BC” like bar which happened today. A bullish close above 1390 will take the stock higher. All other parameters like Relative strength, Money Flow, Buying Pressure and Momentum seem to support. The up move could struggle till 1510 level above which the ease of movement would be much better.

Crompton Greaves - Poised move up?After a long sideways move the stock is now attempting go on upward trajectory. Creasing relative strength and Money flow is supporting the up move. Momentum and Buying Pressure are also increasing. Recent increase in delivery volumes indicate good amount of accumulation. Today's ultra high volume is reason for caution. Once we have a positive close above 343 we can expect a 100 point up move.

GODREJ INDUSTRIES The stock has now successfully taken out the Rejection Zone with consecutive Bullish Effort to Move up Bars. Quality Buying seen with increased Delivery volumes. RS and Money Flow has be strong for some time. The stock likely to move higher now . A test of the Rejection Zone is also possible before the up move.

PRAJINDThe stock is coming out of the Supply Shadow of the "BC" bar. The Relative strength is turning positive. Buying Pressure and Money flow are already positive. Another upbar closing above the shadow preferably above today's High will ensure that the stock will move much higher.
Also on the weekly as well the stock is moving above the supply shadow of a BC bar. All key parameters remaining positive.

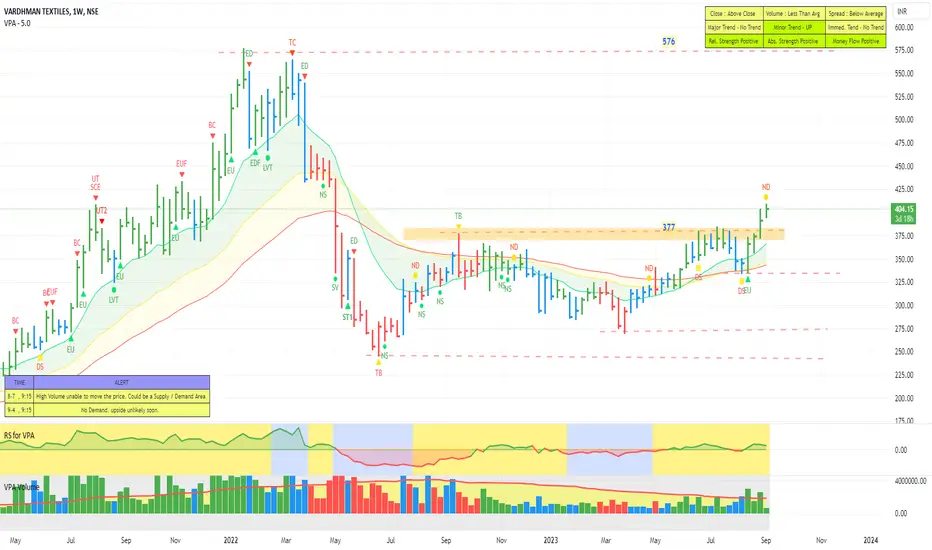
VTL - Ready to Move up The stock after a reversal is on recovery mode. Now making a Higher High and Higher Lows on Weekly and now on Daily as well. Relative Strength, Absolute Strength and Money flow all positive. The Stock looks strong to move up further and likely to test 576 levels.
VARUN BEVERAGES - A Stock to WatchThe stock retreated after facing supply. After some consolidation the stock is again negotiating the previous supply area. Volume support is also coming in. Delivery volume also increased indicating interested longer term buyers. Relative strength, Money Flow and absolute strength all in the green. A good close above 873 with volume support will put the stock back in upward trajectory. However the overall Market which is seeing some weakness may play spoil sport. Still a stock watch.

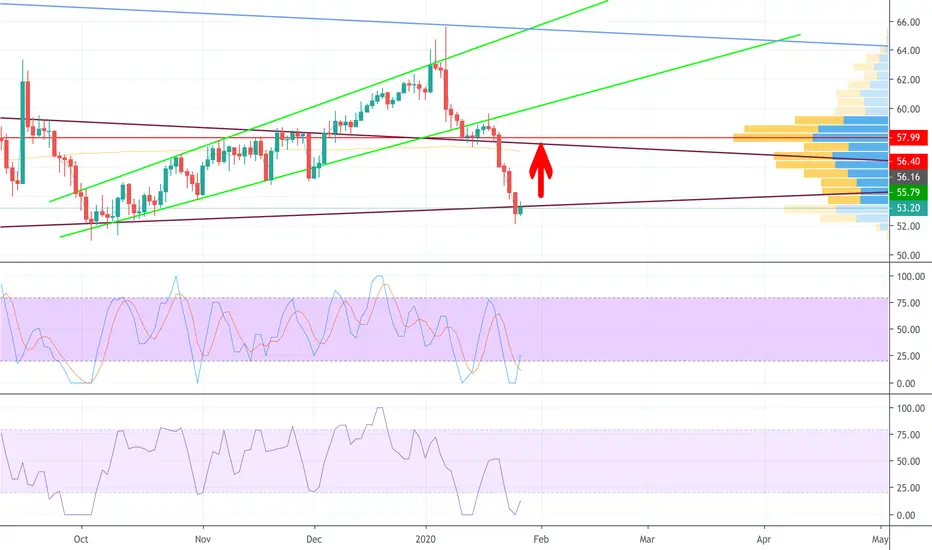
Possible move up?Hello oil traders! I see that oil crossed the bottom of my channel and now looks like it may be moving back up. I had said for a long time that I expected oil to drop down around $52 and it finally did. Now looking for oil to return to the top of that channel around $56.40. StochRSI and MoneyFlow are both moving up which is a good sign. We’ll see what happens.
$TREX Short Into Earnings After The ClosePurely speculation based on bearish divergences and past earning's selloffs about $10.00 down if missing expectations. I bought one TREX 11/15 exp $80 strike put option looking for a nice move down. Spending $148 to make several times that if I'm right. Goodluck and as always do your own due diligence.

USDCHFBE AWARE OF THIS PAIR HAD A STRONG CANDLE MOVEMENTS WAIT FRO THE PROPER REJUCTION
AND KEEP YOUR STOP LOSS TIGHT

LTC CUP AND HANDLE PT2LTC has been looking like there is a cup and handle pattern and has an objective of $180 which is 2x the current price. so if you invest $10K you will turn out with almost $20K which is pretty cool.
The handle looks like its rising which is a sign that we are almost here so buy in now!!
Anyway research this on your own time do not just jump in! dont take my advice seriously just research it! I strongly beleive that a cup and handle is here.
TARGETS: $180 $220 $350 $440
RESISTANCES: $100 $156 $180 $220 $350
SUPPORTS: $85 $75 $65 $55 $49


And now with JPYThis pair is showing a similar pattern to AUDJPY and the double top formed has some potential for shorts. Volume peaked last thursday and now price is following. Some indicators are still on the overbought region, so let's start with small position and wait to see and add more.

Admonitory signs from the skyI thought before elections that Trump winning would bring a sustained uptrend on XAUUSD as well as on XAGUSD but this doesn't seem to be the case. Isntead we made another shooting star that signals the beginning of a new period of lower prices. Plese observe the last time we had that kind of traded volume on this asset, it was the very same day we made another shooting star marking the top of this fib speed resistance fan.
As it happened last time, I wouldn't be surprised of new daily higher highs before starting with the trend, be careful with your entries.
All your comments are welcomed, thanks.

Key resistanceThis pair just reached a level not seen since april '14 and is showing several signs of topping. Please check the volume behaviour on the Acc/Dist where last bull run didn't along with volume. Also, the money flow is coming back from its overbought condition.
Aussie has been showing signs of weakness on other pairs too.

Silver accumulationSilver price action has been quite flat for a few days now but there is an interesting fact to observe: it seems clear to be some accumulation in this area creating a solid support. You can see three different volume indicators all pointing upwards. OBV has been going up way faster than price and money flow index is coming back to bull territory.
This same feature is visible in XAUUSD


There are no silver bulletsWe all know there are no silver bullets, specially when it comes to trading, but this play looks promising and there are several signs that should raise some red flags.
We entered a bear market since last top around 21 and since then we have been oscilating between lower highs and lower lows. I believe this trend will be kept until US elections and/or rate hike, which I think will be almost simultaneous.
On the technical side, we hit the 0,618 resistance and several indicators are showing a downward momentum. Today's candle (don't remember the name) is clearly signaling a reversal. Unless we make a green candle today, I think next week there will be a fall.


Oil was correctingI was thinking before that we entered a new phase of an upward trend, but it looks more like we're just making a small correction to keep the way down.
Once the price hit 0,23 fib retrace of the channel, it bounced and is now keeping its way down to... a lower low (below 39). The money flow was below 50 in the bear range and now that we hit resistance it bounced together with price.

Time to come backAfter yesterday's bad news on Bitfinex, BTCUSD seems to have found a solid floor that lies around the 0,5 angle of this big fib speed resistance fan.
Several indicators are coming back from their oversold condition, and this is a great place to go long and keep it at least for a few weeks before it hits significant resistance on 0,618 angle where you'd be already on +14%.
Thanks for your comments.
