Boeing May Be Taking OffBoeing was stuck below a key level for two years, but now it may be taking off.
The first pattern on today’s chart is the $233.84 level, the high on January 8, 2024. (That was a key session when the aerospace giant gapped lower after a 737 MAX 9 in-flight incident.)
BA probed that level last summer before sliding back to $180. It climbed above the resistance in January and bounced at it last week. Has old resistance become new support?
Second, the 50-day simple moving average (SMA) recently had a “golden cross” above the 200-day SMA. That may suggest its long-term trend has grown more positive.
Third, stochastics are turning up from an oversold condition.
Finally, the 8-day exponential moving average (EMA) has stayed above the 21-day EMA. That may reflect short-term bullishness.
TradeStation has, for decades, advanced the trading industry, providing access to stocks, options and futures. If you're born to trade, we could be for you. Learn more here about TradingView’s Broker of the Year!
Past performance, whether actual or indicated by historical tests of strategies, is no guarantee of future performance or success. There is a possibility that you may sustain a loss equal to or greater than your entire investment regardless of which asset class you trade (equities, options or futures); therefore, you should not invest or risk money that you cannot afford to lose. Online trading is not suitable for all investors. View the document titled Characteristics and Risks of Standardized Options at www.TradeStation.com . Before trading any asset class, customers must read the relevant risk disclosure statements on www.TradeStation.com . System access and trade placement and execution may be delayed or fail due to market volatility and volume, quote delays, system and software errors, Internet traffic, outages and other factors.
Securities and futures trading is offered to self-directed customers by TradeStation Securities, Inc., a broker-dealer registered with the Securities and Exchange Commission and a futures commission merchant licensed with the Commodity Futures Trading Commission). TradeStation Securities is a member of the Financial Industry Regulatory Authority, the National Futures Association, and a number of exchanges.
TradeStation Securities, Inc. and TradeStation Technologies, Inc. are each wholly owned subsidiaries of TradeStation Group, Inc., both operating, and providing products and services, under the TradeStation brand and trademark. When applying for, or purchasing, accounts, subscriptions, products and services, it is important that you know which company you will be dealing with. Visit www.TradeStation.com for further important information explaining what this means.
Moving Averages

Can Anything Stop Intel?Intel pulled back after reporting earnings, but some traders may think the chipmaker’s comeback is still underway.
The first pattern on today’s chart is the December 3 close of $43.76. INTC dropped to that level January 26, stabilized on January 27 and bounced on January 28. Has old resistance become new support?
Second is the January 15 high of $50.39. The stock has made a series of higher lows while staying below that level. The resulting ascending triangle is a potentially bullish continuation pattern.
Third, prices have remained above the 50-day simple moving average and the 8-day exponential moving average (EMA) is above the 21-day EMA. Those signals may reflect positive trends.
Next, some fundamental investors may see INTC as a value stock because it trades at lower price/sales and price/book ratios than many peers.
Finally, INTC is an active underlier in the options market. (Its average daily volume of 884,000 contracts ranks fourth in the S&P 500, according to TradeStation data.) That may help traders take positions with calls and puts.
TradeStation has, for decades, advanced the trading industry, providing access to stocks, options and futures. If you're born to trade, we could be for you. Learn more here about TradingView’s Broker of the Year!
Past performance, whether actual or indicated by historical tests of strategies, is no guarantee of future performance or success. There is a possibility that you may sustain a loss equal to or greater than your entire investment regardless of which asset class you trade (equities, options or futures); therefore, you should not invest or risk money that you cannot afford to lose. Online trading is not suitable for all investors. View the document titled Characteristics and Risks of Standardized Options at www.TradeStation.com . Before trading any asset class, customers must read the relevant risk disclosure statements on www.TradeStation.com . System access and trade placement and execution may be delayed or fail due to market volatility and volume, quote delays, system and software errors, Internet traffic, outages and other factors.
Securities and futures trading is offered to self-directed customers by TradeStation Securities, Inc., a broker-dealer registered with the Securities and Exchange Commission and a futures commission merchant licensed with the Commodity Futures Trading Commission). TradeStation Securities is a member of the Financial Industry Regulatory Authority, the National Futures Association, and a number of exchanges.
Options trading is not suitable for all investors. Your TradeStation Securities’ account application to trade options will be considered and approved or disapproved based on all relevant factors, including your trading experience. See www.TradeStation.com . Visit www.TradeStation.com for full details on the costs and fees associated with options.
Margin trading involves risks, and it is important that you fully understand those risks before trading on margin. The Margin Disclosure Statement outlines many of those risks, including that you can lose more funds than you deposit in your margin account; your brokerage firm can force the sale of securities in your account; your brokerage firm can sell your securities without contacting you; and you are not entitled to an extension of time on a margin call. Review the Margin Disclosure Statement at www.TradeStation.com .
TradeStation Securities, Inc. and TradeStation Technologies, Inc. are each wholly owned subsidiaries of TradeStation Group, Inc., both operating, and providing products and services, under the TradeStation brand and trademark. When applying for, or purchasing, accounts, subscriptions, products and services, it is important that you know which company you will be dealing with. Visit www.TradeStation.com for further important information explaining what this means.

NATGATE - 8 RECORD SESSION LOWS ?NATGATE : CURRENT PRICE : RM1.00 - RM1.02
NATGATE has been in a corrective phase and recently printed an 8-session low, which often signals selling exhaustion and opens the door for a technical rebound. (The record session topic is discussed by STEVE NISON in his book - BEYOND CANDLESTICK , PAGE 121 - 127)
A bullish piercing line appeared in Friday’s session, where buyers pushed price well into the prior bearish candle’s body. Stochastic oscillator is currently in the oversold zone, signalling a potential technical rebound.
ENTRY PRICE : RM1.00 - RM1.02
FIRST TARGET : RM1.10
SECOND TARGET : RM1.22 (near EMA 200) - The EMA 200 has capped price twice, acting as strong dynamic resistance, look at the green highlighted area.
SUPPORT : RM0.935
Notes : For reference, I’ve attached the link to my previous write-up related to this setup.

NQSDAQ 100 Futures: the odds for a bearish wave aheadanalysis per time frame:
shows signs for downside wave that just started.
shows clear trading range, with mild preference to the sellers.
shows pattern that prefers selling the bounces which shows more corrective nature within the bigger picture, bounces that does not represent a pure bullish trend up to the weekly time frame.
trading strategy: the 1D and 4H charts showing price clusters that does not require wide price movement to get firm evidence that trying the positional short strategy is wrong. personally, I do not see a reason to be stubborn about the short side. it is pure Risk/Reward ratio that prefers to try shorts during this week, to sell bounces on the 4H chart. targets to the downside off the daily chart are the recent 2 lows, followed by lower prices showing on the weekly chart through the Fibonacci drawn on the weekly chart and 200 DMA with NASDAQ:NDX and not the NQ.
pay attention to the moving averages ribbon as showing on the daily chart.
all in all, downside target is under 23800 and failure of the resistance cluster to hold as showing on the 4H chart to open the way for 26600 and higher.
good luck, in case you need to clarify a certain point, do not hesitate to contact me. I would love to help you if possible.
happy trading !

EURUSD H4 Bullish Trend – DMA 100/200, RSI ConfirmationEURUSD on the H4 timeframe is maintaining a clear bullish trend.
Price is holding above the 200 DMA, confirming a strong overall bullish bias. On Friday, price made a healthy pullback to the 100 DMA and bounced strongly to the upside, showing active buyer participation.
The DMA alignment (100 above 200) with an upward slope supports trend continuation.
RSI remains bullish and holds above the Almost 50 level, confirming positive momentum.
As long as price stays above the 100 and 200 DMA, the buy-side bias remains valid.
Pullbacks with confirmation are expected to offer buy continuation opportunities.
Buy Entry: 1.8160
Targets: First Target: 1.19500, Final Target: 1.20800
Stop Loss: Below DMA 200 (H4 close basis)
Always follow proper risk management and avoid entries without confirmation.

Bitcoin (BTC) We're are we?EMA hits previous cycle top at same time the Top came in 2021 and we just did same thing.
The correction almost hits my 1.618 C leg measurement of the A in expanded flat. In 2022 it 1.786.
The best accumulation zone in 2021 was scaling in under previous cycle top and EMA from 2017.
This past data seems very close to what we’re doing now. I doubt it will match it %100 but it’s close.

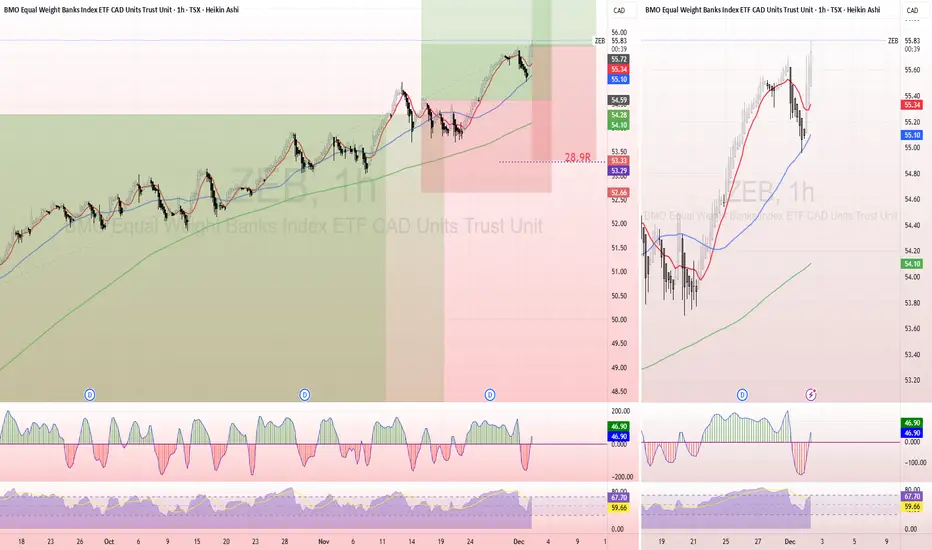
ZEB – Trend Structure Intact - 3rd Entry Following Strategy RuleRe-entered ZEB for the 3rd time as it rotated cleanly back into strength. Price respected the trend structure again- higher lows, higher highs- and reclaimed both the 20MA and 50MA on the 1h.
This entry follows my system rules exactly:
Trend confirmed (20MA > 50MA, both rising).
Pullback held structure inside the model’s “buy window.”
Heikin-Ashi flip back into momentum.
RSI + CCI reset without breaking the broader trend.
Risk stays constant by placing the stop below the structural invalidation.
This ETF doesn’t move fast, but it respects structure exceptionally well. I’m treating it as a slow, steady trend trade with compounding opportunity.
Trade Plan
Entry: Current reclaim of the trendline and MA cluster
Stop: Below the previous structural low (invalidates the setup)
Risk: Kept identical to prior entries 1% total account
If the trend continues, I’ll trail the stop behind Daily 50 MA and keep adding only when structure supports it.
Sticking to the plan > feelings.
#ZEB #TSX #Banks #ETF #TrendFollowing #HeikinAshi #RiskManagement
ETHUSD - More Downside To Come? I think so...Hello everyone, happy trading out there!
In this video, I will take you through my analysis of ETHUSD and why I believe there is more room for this crypto pair to fall.
Using the 'Core' strategy using 1h and 4h (5) period McGinley Dynamic averages, as well as VWAP (Monthly) and the Money Flow Index (MFI), I will show you why I believe ETH has more room to continue falling.
I hope this video helps bring you more clarity and understanding. Feel free to use these tools in your own way and find out what works best for you in your trading!
See you on the next video!

Keeping It Simple - Incorporating VWAP (Monthly)In this video, we will be looking at the 'Core' of the Heiken Ashi McGinley Dynamic trading strategy (it needs an official name - it's coming...!), PLUS how to incorporate the Money Flow Index (MFI) into the strategy, PLUS how to incorporate VWAP (Yearly) to help with analysis, PLUS how to incorporate the VWAP (Monthly) to get a better idea of what a given market is doing.
In the last video, using 'Bar Replay,' we went back in time to a random bar and applied the core strategy using HA candles and a (5) period McGinley Dynamic Average. We added the VWAP (Yearly) to see if it can help our analysis in determining whether or not we should be Short/Long.
***CORE STRATEGY***: We will always trade AT or NEAR the average. We will BUY if the price closes ABOVE the average and SELL if the price closes BELOW the average.
In this video, we apply the VWAP (Monthly) and find a ranging market determined by a flat-lining VWAP (Monthly). We also look at the Higher Timeframe and see that there is very clear BEARISH divergence - leading us to be a little bit skeptical on how long to hold our LONG trades.
We go on to take a LONG trade while the price is BELOW the VWAP (Monthly) using our Core strategy timing, and it winds up being a monster trade while keeping in mind that the Bearish divergence on the Higher Timeframe chart could mean that our LONG trade may have a short expiration date.
In the next video, we will look at incorporating Volume Profiles to give us more information on what a given market might do next!
See you in the next video!

Keeping It Simple - Managing/Adding to the PositionIn this video, we will be looking at the 'Core' of the Heiken Ashi McGinley Dynamic trading strategy (it needs an official name - it's coming...!), PLUS how to incorporate the Money Flow Index (MFI) into the strategy, PLUS how to incorporate VWAP (Yearly) to help with analysis. Using the core strategy, we will learn how to manage the Open Position as well as look at opportunities to ADD to the existing position.
In the last video, using 'Bar Replay,' we went back in time to a random bar and applied the core strategy using HA candles and a (5) period McGinley Dynamic Average. We added the VWAP (Yearly) to see if it can help our analysis in determining whether or not we should be Short/Long.
***CORE STRATEGY***: We will always trade AT or NEAR the average. We will BUY if the price closes ABOVE the average and SELL if the price closes BELOW the average.
In this video, we closed out the Open position for a big win, which covered for our previous losses and even moved us into profit territory. We will close out the big winner for a nice gain and even add another Short position based on the Core strategy to add to our wins.
We go on to take other trades which wound up being losers, so we're probably back to breakeven, but that's trading! We are going to stick with the Core strategy and use our supplemental tools to keep our losses small and gains big so that we can turn a profit in the market. That's how trading is done, right?!
In the next video, we will look at taking more trades using all of our tools so far and even incorporate VWAP (Monthly) to see if that can help us even more in our analysis.
See you in the next video!

Keeping It Simple - Incorporating VWAP (Yearly)In this video, we will be looking at the 'Core' of the Heiken Ashi McGinley Dynamic trading strategy (it needs an official name - it's coming...!), PLUS how to incorporate the Money Flow Index (MFI) into the strategy, PLUS how to incorporate VWAP (Yearly) to help with analysis.
In the last video, using 'Bar Replay,' we went back in time to a random bar and applied the core strategy using HA candles and a (5) period McGinley Dynamic Average. In this video, we will now add the VWAP (Yearly) to see if it can help our analysis in whether or not we should be Short/Long.
***CORE STRATEGY***: We will always trade AT or NEAR the average. We will BUY if the price closes ABOVE the average and SELL if the price closes BELOW the average.
In this video, we looked at how to identify BULLISH/BEARISH Divergence using price and the MFI, and we took another trade and got STOPPED OUT AGAIN!!! After incorporating the VWAP (Yearly), we saw that the price was trading OUTSIDE of (3) Standard Deviations on the VWAP (Yearly), making it prime time for a SHORT trade. We engaged the SHORT trade following our Core strategy, and it has so far made up for all of our losing trades so far!
So far, we are down (4) trades with an OPEN WINNER. As we add more components to the strategy, will we gain a better understanding of the true market direction and where it might be headed so that we can make up for our losses?
In the next video, we will look at managing our OPEN WINNER and how to possibly even ADD to our position for a bigger overall gain...
See you in the next video!

Keeping It Simple - Incorporating the Money Flow Index (MFI)In this video, we will be looking at the 'Core' of the Heiken Ashi McGinley Dynamic trading strategy (it needs an official name - it's coming...!) PLUS how to incorporate the Money Flow Index (MFI) into the strategy.
In the last video, using 'Bar Replay,' we went back in time to a random bar and applied ONLY the core strategy using HA candles and a (5) period McGinley Dynamic Average.
***CORE STRATEGY***: We will always trade AT or NEAR the average. We will BUY if the price closes ABOVE the average and SELL if the price closes BELOW the average.
In this video, we looked at how to identify BULLISH/BEARISH Divergence using price and the MFI, and we took another trade and got STOPPED OUT AGAIN!!!
So far, we are down (3) trades. As we add more components to the strategy, will we gain a better understanding of the true market direction and where it might be headed so that we can make up for our losses?
We will find out in the next video!
See you there!

Keeping It Simple - Trading the Core!In this video, we will be looking at the 'Core' of the Heiken Ashi McGinley Dynamic trading strategy (it needs an official name - it's coming...!)
Using 'Bar Replay,' we will go back in time to a random bar and apply JUST the core strategy using HA candles and a (5) period McGinley Dynamic Average.
We will always trade AT or NEAR the average. We will BUY if the price closes ABOVE the average and SELL if the price closes BELOW the average.
In this video, we took the trade and got STOPPED OUT!!! In the next video, we will ADD another component of the strategy to see how THAT component might have helped us make a better decision before pulling the trigger...
See you in the next video!

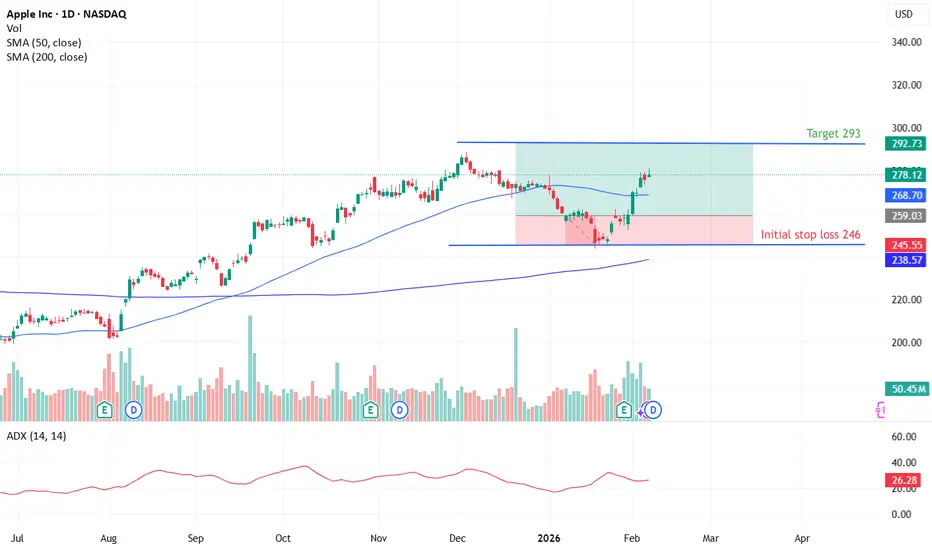
AAPL — Trend Continuation / HOLD LONGBias: Hold Long
The technical structure remains solid. Price continues to trade above both the SMA50 and SMA200, confirming an intact long-term uptrend, while ADX indicates healthy trend strength. The most recent pullback occurred on light volume, suggesting orderly consolidation rather than distribution and supporting continuation toward higher levels.
Order flow remains neutral, showing no significant institutional supply at current levels. Sentiment is mildly constructive, reinforcing the existing long posture but not materially increasing conviction beyond the technical foundation. The next key resistance is located near 288.62, with the broader upside objective near 293.86.
Risk management
Trailing stop: 269.75
Hard stop: 245.73
Primary upside target: 293 (20-40 days)
BTCUSD — Defensive Structure Below Key MAs | Bottoming ProcessBitcoin remains in a defensive technical regime after a sharp 30–50% decline from the October 2025 peak, driven by macro tightening, leveraged long liquidations, and sustained fund outflows. Although institutional spot ETF accumulation continues to provide a longer-term structural tailwind, current price structure has not yet repaired, keeping the near-term outlook cautious.
Technical Structure
Price trades below all major trend references:
SMA200: 102,542
SMA50: 87,298
EMA20: 79,868
This alignment confirms a broken long-term structure and a still-bearish medium-term trend. Momentum signals are mixed: RSI near 53 indicates neutral internal momentum, while ADX around 44 shows a strong directional trend environment that still favors continuation risk to the downside. MACD histogram prints are marginally positive but remain insufficient to confirm a structural reversal. Volume and order-flow readings show no decisive accumulation phase yet.
Key Levels
Immediate resistance: 89,496
Critical structural support: 60,000
Mining-cost support zone: ~58,740
Scenario Outlook
Bullish structural repair: A sustained daily close above 89,496 followed by reclaiming EMA20 and SMA50 — and ultimately SMA200 — would shift bias toward a renewed bullish structure.
Bearish continuation risk: Failure to hold the 60,000 support zone would reopen downside tests toward the mining-cost area (~58,740) and potentially extend the prevailing downtrend.
Summarized
Current conditions suggest a neutral / defensive stance, as no high-probability entry structure is present until either structural resistance is reclaimed or a confirmed accumulation pattern forms near major support.

Bitcoin Bull Market RestartingMy updated primary count:
- RSI peaks ideally in wave 3's (orange circles)
- 200 weekly MA provides major cycle support + pitchfork level holding, which it appears to be respecting nicely
- Comparing altcoin charts, the vast majority topped in January 2025, supporting the idea that we've been in a corrective structure for a year now.
- Leads to question of what is more probable?
Bitcoin was the only crypto to be in a bull?
or
Bitcoin was also in a bear market?

Grounds for support.I haven't looked at Bitcoin for a long time, but it has started to fall,
breaking through the weekly Ichimoku cloud, which took many weeks to form.
It is now more important to say where its reliable support zone is.
Reverse RSI gave it a red bearish flag, which is not very good, but it is normal
considering how much it had grown before that.
I note the coincidence of the EMA 200 zone and the oversold Revers RSI
at around 68,000.
But in addition, we will need to see a new bullish RSI (green candles), which will
change the structure of the process. We will be able to talk about this no earlier
than after the retest. Will it be single, double, or with sideways movement?
It is impossible to say anything about this now.
I expect Bitcoin to find support there.

MSTR at Key Support: Bounce Opportunity or Breakdown Risk?Market Structure
MSTR is trading inside a long-term descending channel, indicating that the broader trend remains bearish / corrective.
Price has recently reacted right at the lower boundary of the channel, which is a critical support zone.
The moving average is still above price, suggesting that bullish momentum has not yet been confirmed.
Bullish Scenario (Support Bounce)
• Current zone: Major support at the channel low
• If this level holds:
• Target 1: 160 – 165
• Target 2: 190 – 200 (midline of the channel)
• This move would be considered a technical bounce or corrective rally, not a full trend reversal.
Bullish Stop Loss:
❌ Daily close below 130 – 125
Bearish Scenario (Channel Breakdown)
• If price breaks and closes below the channel support:
• Target 1: 110
• Target 2: 90 – 80
• A breakdown would likely accelerate downside momentum.
Bearish Stop Loss (for shorts):
❌ Daily close back above 145 – 150
Final Thoughts
• Risk-to-reward favors a cautious long at support, but confirmation is still needed.
• MSTR remains highly correlated with Bitcoin, so BTC volatility can quickly trigger either scenario.
• Best approach:
• Wait for clear bullish confirmation, or
• Trade short-term with strict risk management.

Death Cross Reversal — Short SetupBias: Short while price remains below 131
The technical structure supports a bearish continuation the trend - following a confirmed Death Cross, signaling a sustained downside regime. Trend strength remains meaningful with ADX 26**, while momentum indicators reinforce the bearish bias — the 4h MACD histogram is negative and 1h RSI remains below neutral, indicating persistent short-term selling pressure.
Sentiment is strongly negative for the Datadog, aligning with the technical outlook and increasing the probability of near-term downside follow-through.
Execution plan
Entry: Keep an eye on the zone 110.24–111.55
Stoploss: c. 131.13
Primary target: 101.26
Conservative target: 101.06
Estimated duration (this is a swing trade!): 2–7 days
Estimated R:R: 1:3
Not financial advice - only trading idea.

QQQ (2/9 - 2/13) - Dead cat bounce?Bearish signals:
- Friday bounce after a weekly sell-off still close below the big resistance at $611.40
- EMA death cross
- RSI & MACD still in bearish territory
PT : blue lines
Resistance: red lines
Trigger to the bearish continuation is to break $599.79. If it bounces, chance to retest to the upside, meaning bottom in.

HURA - Breakout Attempt - Pullback ManagementTimeframes: Weekly / Daily / 1H
I attempted an initial breakout entry as HURA pushed through prior resistance, but the move failed to hold, and price has since rolled into a sharp pullback. I’m currently under-allocated versus intended size and managing the position through this corrective phase.
What went wrong (objectively)
Breakout candle was followed by an immediate black reversal candle on higher timeframes.
Momentum faded quickly after extension — classic false breakout / exhaustion move.
Price lost the short-term moving averages and accelerated lower.
What’s keeping me in the trade
Weekly structure remains intact — higher-timeframe trend has not broken.
Pullback is occurring into major confluence:
Rising longer-term MA
Prior breakout / demand zone
Position size is intentionally small (partial fill only), allowing room to manage volatility without emotional pressure.
Risk & trade management
Stop is not being chased lower during this volatility.
I’m letting price resolve the pullback first before reassessing:
Either stabilization and reclaim of key levels
Or a clean invalidation of the broader structure
This is a good reminder that breakouts in uranium can be violent in both directions. Position sizing matters more than precision.
Not adding here. Watching for structure and momentum confirmation before making any further decisions.
#uranium #HURA #ETF #breakout #pullbacktrend #riskmanagement #canada

Bearish Trend Continuation — Short SetupBias: Short while price remains below 30.41:
Technical structure remains decisively bearish. ADX (~41) confirms a strong directional downtrend, with price trading well below both the SMA50 (36) and SMA200 (54), reinforcing the prevailing downside structure. Short-term momentum indicators support continuation, with a negative MACD histogram and subdued RSI signaling sustained selling pressure.
Sentiment is deeply negative, influenced by recent high-impact developments including senior leadership changes, materially increasing the probability of further downside and supporting a trend-following short bias. Order flow indicating no clear institutional distribution signal.
Execution plan:
Entry: 26.51–26.80
Stop: 30.41
Target: 17.78 (primary)
Conservative target: 26.01
Estimated duration of the swing trade: 20–40 days
Market regime context is currently characterized by a broader low-volatility bullish environment, which can create tactical headwinds for short trades. Strict position sizing and disciplined stop management are therefore essential. Monitor closely for any shift in order flow toward Absorption or materially positive fundamental developments that could alter the risk profile.

Bitwise Bitcoin ETF | BITB | Long at $37.08Back in AMEX:BITB at $37.08. Crypto is wild beast of speculation, but Bitcoin COINBASE:BTCUSD is the king. I'll leave further analysis to the crypto bros...
More downside may be ahead ("crash" Bitcoin is around $40,000 right now), but even your grandma has heard of Bitcoin / Bitcorn at this point. It's not going anywhere.
Targets into 2029
$44.00 (+18.7%)
$58.00 (+56.4%)
