Moving Averages

Trend Trading And Moving Average IdeasA Short Tutorial On Moving Averages And Certain Synchronicities That Come About When Entering And Exiting The Markets


Potensi Golden Cross (The Potential of Golden Cross) - MalayPenerangan tentang potensi Golden Cross dalam Bahasa Melayu (The explaination of Golden Cross - in Malay).

Why 30% Win Rate is ALL YOU NEEDWe all know discipline is important for trading, but how important? So far, I’ve not yet met one profitable trader who lacks discipline. In fact, with proper discipline, a 30% win rate is enough to be successful in any market!

The power of Juriks MA In my script Support & Resistance script witch you can find here:
I make use of a modified clone of Jurik's moving average under the hood to form a multiple line as middle line if you bands selected in settings. What i have done here is to borrowed that code to make a strategy to show case the power of that script.
The script buys/sells and exit on color change
When the ribbon change to blue it buys
When the ribbon change to orange it sells
The script exit the trade on change to gray
Setting Properties
Initial Capital = 100 000
Base Currency = Default
Order Size = 1
Pyramiding = 3
Commission = 4 USD per Order
Slippage = 2 ticks
As you can see this script is very simple and easy to follow. The original script has alerts set up for every color change so it is possible to automate it with your favorite bot script. But be aware that you always should do your own research before applying any strategy with real money.
Good luck traders...

Bitcoin | Price Prediction by 2020..!!What is Bitcoin..!!
Bitcoin is a digital form of cash. But unlike traditional fiat currency, there is no central bank controlling it. Each unit of Bitcoin is unique and cannot be copied or destroyed, and it runs on top of a distributed network, maintained by thousands of computers around the world.
Bitcoin Features..!!
- Decentralized access allowing any party with the open-source software and internet access to send and receive Bitcoin irreversibly without third party interference or trust.
- Decentralized governance via open-source development and forking.
- Relatively slow block times in comparison to other crypto-currencies although there are solutions in development such as the Lightning Network aiming to solve the problem of scaling.
- Largest hashrate (ensuring the security and resilience of the blockchain) and largest liquidity.
- Most common currency for crypto-currency exchange pairing
- The hard coded scarcity (maximum 21 million coins) has led to comparisons to traditional physical scarce resources like gold.
- Transactions are pseduo-anonymous. Funds are sent address to address, but an owner identity can eventually attributed to an address given enough data and analysis.
- Average blocktime of 10 minutes; Total supply of 21 million BTC; Consensus via Proof of Work (SHA-256).
Bitcoin Milestones..!!
31st October 2008 - White paper released by Satoshi Nakomoto.
3rd January 2009 - Genesis block mined by Satoshi Nakomoto.
12th January 2009 - First transaction using Bitcoin; Satoshi Nakomoto sends 100 BTC to Hal Finney.
22nd May 2010 - First recorded commercial transaction using Bitcoin; aka Pizza Day.
14th January 2016 - Lightning Network white paper, a Layer-2 solution to scaling Bitcoin.
1st August 2017 - Bitcoin Cash (BCH) hard fork.
23rd August 2017 - Segregated Witness (SegWit) implemented.
What is Bitcoin halving?
An event that halves the rate at which new Bitcoins are created. It occurs once every four years.
Will the Bitcoin price change?
Historically, the price has gone up following a halving, but it ultimately depends on the supply/demand ratio.
Essentially, Bitcoin halving cuts down the supply of BTC, making the asset more scarce. If the demand is there, the price is likely to increase. There are also some historical precedents. On Nov. 28, 2012, the day of Bitcoin’s first halving, the cpryptocurrency’s price rose from $11 to $12, and continued to climb up throughout the next year, reaching $1038 on Nov. 28, 2013.
Roughly four years later, a month before the second halving, Bitcoin’s price started to follow a similar, bullish pattern. It surged from $576 on June 9 to $650 on July 9, 2016 — the day the block’s reward was reduced by half for the second time in the asset’s history. Again, BTC continued to accelerate through the next year, albeit with occasional turbulence, and traded at $2526 on 9 July 2017.
Will it be the same next time? Skeptics believe that the halving has already been priced in (remember this year’s epic, but short-lived systematic price increase?). Although, there is no scientific way to verify this.
Moreover, the industry has drastically changed over the last four years, as cryptocurrencies — and Bitcoin in particular — became an essential part of mainstream news coverage. Still, some people might be tempted to take the chance, especially given the previous patterns exhibited around Bitcoin halvings.
Consequently, if history repeats itself and the Bitcoin price starts going up in April 2020, even more traders might start buying the asset out of a fear of missing out, thus stimulating the demand, and, ultimately, the price.
Please, give us your opinion in the comments.!!
If you like the idea, please hit the Like button and subscribe to the profile in order not to miss our updates.
The information given is never financial advice. Always do your own research.

Coinbook - Moving Average Strategy - DailyBuy the code and trading idea details behind this strategy at coinbook.com
We will backtest your trading idea for free: coinbook.com
We build custom trading bots. Please reach out to implement this idea at support@coinbook.zendesk.com.

Coinbook - Simple Moving Average - 1HourBuy the code and trading idea details behind this strategy at coinbook.com
We will backtest your trading idea for free: coinbook.com
We build custom trading bots. Please reach out to implement this idea at support@coinbook.zendesk.com.

Coinbook - Simple Moving Average - 4HourBuy the code and trading idea details behind this strategy at coinbook.com
We will backtest your trading idea for free: coinbook.com
We build custom trading bots. Please reach out to implement this idea at support@coinbook.zendesk.com.

Coinbook - Simple Moving Average - DailyBuy the code and trading idea details behind this strategy at coinbook.com
We will backtest your trading idea for free: coinbook.com
We build custom trading bots. Please reach out to implement this idea at support@coinbook.zendesk.com.

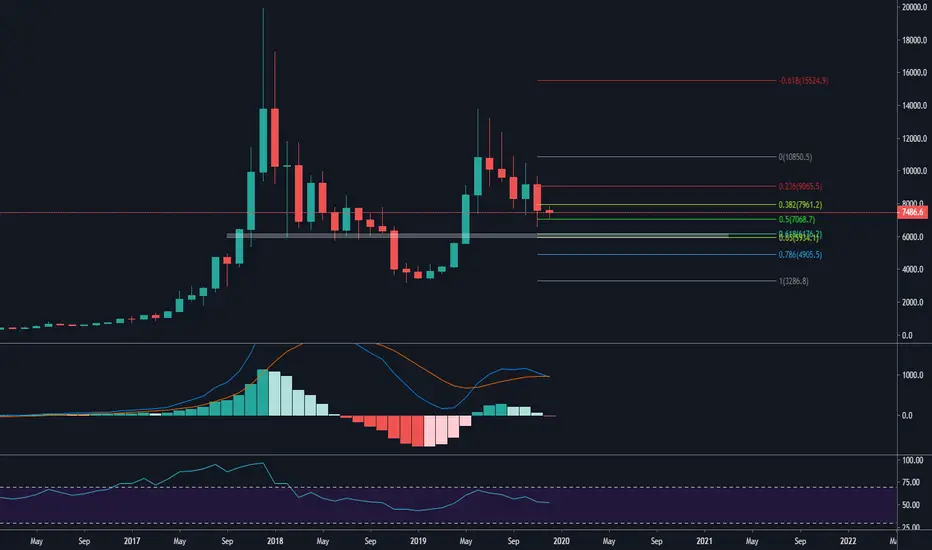
A nasty monthly chart and the Confluence zoneHello all trader, how are you doing today? I hope you're all doing great. Here we come again with the monthly chart of bitcoin which is however a little bit nastier than I thought earlier. With a different method of technical analysis, this will give us a refreshing view of what's happening in the market for now.
Looking at the monthly chart, I found that the bear is taking control of current market for now. There are some indications that could support my view on this current condition.
1. Histogram on the monthly chart is showing us a ticking down to the negative side which usually will lead the price to further touch down to the next support area.
2. Death cross has already occured on the moving average of the MACD. This shows us that the momentum of the bulls is slowly diminishing, and the shifting from bullish to bearish is happening right now.
3. The confluence zone however always be my part of analysis which usually can give me a clearer view of what could happen in the near future. I'm using the body to body connecting method to connect the 2 swing point for fibonacci retracement and I found a lot of things are getting interesting here. I found that the golden pocket zone is locating align with the previous resistance region for bitcoin. And what's more important is, since the initial break out of this resistance region, I can't find a phase 2 of break out strategy which is retesting the previous broken resistance as a support for now. And considering that this white zone is the broken resistance turn support, I am pretty sure that this zone will become a key support level that will act as a magnet for current bitcoin's move.
For medium term, there is still a potential down trend toward the 78.6 fibonacci level or even lower. And the end of 2019 will become very nasty. But, for short term, I'm still unbiased and as long as the price can't break the lower support aroung $6500 region, my previous analysis which refer to the potential wave 3 will always be valid.
HOW TO FIND CHEAP ENTRY SIGNAL FOR RISKRETURN LIKE 1:10 AND MOREHI BIG PLAYERS,
in this tutorial I want educate you my experience, how to find really cheap entry for trading.
In this example it was possible to take part on a 1:10 trade. It means for 1 USD investment you could take 10 USD return (Risk-Return-Ratio => RRR).
/////////////////////////////////////////////////////
E X A M P L E F O R A B U L L I S H T R E N D
/////////////////////////////////////////////////////
At the beginning we are looking for an oscillator, that shows us an oversold area and in the same time a bullish trend with higher and faster EMA than a slower EMA on the chart. This is possible with a slow EMA(close, 200) and a fast EMA(close, 50) and a RSI(close, 14).... => this is for example my way to find it on the Forex Screener from TradingView at fast as possible.
I developed a similar structure with more quality signals with my candle oscillator indicator. Named: CO 'I.
This indicator allows to see the candle between a range und works at well like the RSI oscillator with 30% and 70% oversold and overbought area. The most positive on this indicator, you don't only see the closing relating price - you see almost more: open, high and low.
Furthermore, I found out that if the body of a candle goes into the range between 30-70% and this is the same trenddirection in the chart, then it was to 90% the lowest/highest bar or 3+ bars nearby them.
So back to my education:
My main view starts on 4H Chart. In this example I found on EUR/JPY a bullish trendfilter with the EMA's and a oversold area on my OC 'I (the wick of the candle was touching the 30% line) - it's only necessary that a touching of the candle is true.
NEXT STEP:
After this bullish signal it is necessary to zoom in the lower timeframe. Here I choosed the 1H Chart and had to wait till the body of the OC 'I also touched the 30% line and of course wait till the candle is finished. It don't depend how much the body touch the 30% line - but it's necessary that the body is touching. In addition, a bullish divergence was built (looking to blue lines).
After the first touching I go into a lower timeframe again. The 15H-Chart was choosed for this example. Hereby the same game: waiting till the body is touching the 30% line.
NOTE: furthermore, if I going into the lower timeframe and the body is already touching - then you don't need to wait for the relase into the range and back to touching again the 30% line.
The 15MIN Chart is the last timeframe. Now we wait till the body goes up and don't touch any line. This is my signal to buy. My exit depends always how the market flow are: in this case it was a big uptrend and a adapting correction wave (this is mostly the time for divergence and this why I set a takeprofit on this high).
With this approuch it was possible to catch a 1:10 trade.
Kind regards
NXT2017

LevelsHello fellas, Happy Saturday and I hope this can be a nice weekend for all of you. Today's update is always about bitcoin and this will always be a significant update as the analysis for the next 7 days ahead. I hope this analysis still can give us a nice horoscope for the next few days, just like what I've always did! So, Enjoy!
Looking at the daily perspective of the bitcoin's price, we can see that the down trend channel that has held the price since June 26th, 2019 as the initial corrective phase of bitcoin is remain valid and still hold true. At November 25th, we can see the price bounced right after it touched the lower line of the channel which act as a strong support so far.
Right now, the price has came close to the median line of the channel which is acting as a strong support too. we might see an action at this region whether it is going to break it out or getting rejected from it. If we see a break out action, we might see the price to reach out $8800 as the shadow support before it pushes further to the upper line of the channel as the next strong resistance ahead. But, if the price get rejected at the yellow zone, we might see the price to push further low to $6600 or even $5500 region.
It's just a matter of time, we might see the price to push further to the lower region of $5500 as it's almost impossible for bitcoin to breaks the upper line of the channel which is huge for now. with current condition, A lot of uncertainty in the market, Huge adoption this year, But low levels of confidence? It is certainly the longer recession is coming.

XAUUSD Fibonacci Level and Support Resistance LevelConfluence with 1478.85 Horizontal Support Resistance Level and 50% Horizontal Fibonacci Level (1478.87)

XAUUSD 5.2 R-Multiple XAUUSD Pennant Pattern. Second Entry at 1478.85 horizontal level. Risk 3.86 to achieve 20.07 Reward for a 5.2R trade outcome.

EURSEK 2.93 R-MultipleEURSEK Reward:Risk = 2.93R
Stop Loss: 286.6 Pips
Target: 838.5 Pips
Entry at price level: 10.64975
Note: Price Level 10.64975 was retested and EURSEK continued into its intended direction.
Note: Price Level 10.60763 was broken and retested. Entry comes in at the retest of level 10.60763. Target is the next horizontal support resistance level at price 10.56657.

MACDBTCUSDDBuy the code and trading idea details behind this strategy at coinbook.com.
We build custom trading bots. Please reach out to implement this idea at support@coinbook.zendesk.com


MACDBTCUSD4Buy the code and trading idea details behind this strategy at coinbook.com.
We will backtest your trading idea for free: coinbook.com
We build custom trading bots. Please reach out to implement this idea at support@coinbook.zendesk.com.

MACDBTCUSD1Buy the code and trading idea details behind this strategy at coinbook.com
We will backtest your trading idea for free: coinbook.com
We build custom trading bots. Please reach out to implement this idea at support@coinbook.zendesk.com.

MACDBTCUSD15Buy the code and trading idea details behind this strategy at coinbook.com
We will backtest your trading idea for free: coinbook.com
We build custom trading bots. Please reach out to implement this idea at support@coinbook.zendesk.com.
