AVGO at a Critical Breakout: AI Boom or Pullback Ahead?Bullish Scenario (Breakout Above Channel)
Entry:
• Valid breakout above $405–410
• Preferably a daily close above the channel top
Targets:
1. Target 1: $430
2. Target 2: $455–460 (main target)
Stop Loss:
• $395
(If price falls back below the broken resistance)
Bearish Scenario (Rejection From Channel Top)
Entry:
• Bearish rejection at the upper channel
• Confirmation through reversal candles
Targets:
1. Target 1: $380 (midline)
2. Target 2: $350–355 (bottom of channel)
Stop Loss:
• $408–412
(Above the channel top and wick of rejection)
Moving Averages

S&P 500 (SPX) – Daily Chart AnalysisThe S&P 500 is still in a strong long-term uptrend, supported by the 50-day moving average (orange line).
After a recent pullback from the highs around 6,900, price found support near the SMA50 and bounced upward again — a bullish sign.
Bullish Scenario (More Likely)
As long as SPX holds above the SMA50, the market remains in a healthy uptrend.
Bullish signals:
• Strong reaction from SMA50
• Higher highs and higher lows still intact
• Momentum remains positive
Bullish Targets
• 6,950 (previous high, first target)
• 7,100
• 7,250 – 7,300 (major upside target)
Bearish Scenario (If SMA50 Breaks)
If the price falls below the SMA50 with strong downside candles, the trend could weaken.
Bearish Targets
• 6,450 – nearest support
• 6,200
• 5,950 (major support zone)
Bearish confirmation:
• Breakdown + failed retest
• Loss of upward momentum
• Declining volume on rallies
Stop-Loss Levels
• For long positions: below 6,600
• For short positions: above 6,950
Summary
• SPX remains bullish overall.
• Strong bounce from the SMA50 supports continuation.
• If the index holds above 6,700–6,750, new all-time highs are likely.
• Breakdown of the SMA50 would open the door for a deeper correction.

SYS — Swing Trade SetupSystem Price is showing strong bullish momentum after holding the key support zone around 146–152 PKR.
The recent volume spike and RSI moving above 60 confirm positive momentum.
Ideal buying zone: Between CMP 156.39 and 152 PKR.
Stop Loss (SL): 145 PKR (closing basis) to protect downside risk.
Targets (TP):
• 165 PKR (first target)
• 171 PKR (second target)
• 180 PKR (extended target)
Structure favors continuation as long as the price stays above SL zone. Good swing trading opportunity with clear risk-reward levels.

UJ Thought, Ideas and Trading PlanUSD Bias 60% Sell Yen Bias 25% Buy. This are overall biases not cumulative between them only is derived from observing each currency multi cross analysis, including their indices.
Daily:
Tight Channel Down or Bullish Flag, well hopefully we will get the answer this week. We have good signals either way, if we broke the upper channel band on a good wide spread candle we have our flag and we can easily target 157.8, if we break below 155.810 we can short and continue down with the channel. 155.810 hold the price above on three occasions, day after day , which makes it a good level for shorting. My view of the dollar for next week is weak, but obviously respect the market and the chart and do what it shows me not what my bias is.
4H:
The PA has been in a tight congestion for most of the week, the good things the levels are closing on both sides (support and upper channel band) so we have a high probability of break out either way, but never exclude the chance of the congestion to continue. Now, because we have different trends on different TF's it is really hard to take a single side, I will keep mind and eyes open for long and short possibilities, we are in the middle of nowhere currently so everything is possible, the good side of it is that we have well defined targets and entries.
1H:
Now I actually see how wide this channel is (I called it tight on the daily analysis), to be honest pretty ugly PA, not much to do with it, except to wait to clear up or count more on the higher TF's. On Friday the PA was mostly near the upper channel band and also just below EMA's. Monday will offer good trading opportunities.
The Plan
Long Rejection + Breakout 155.810 Target 157.134 A 4th rejection at 155.810 followed by the channel breakout or channel breakout + re-test
Short Breakout Continuation 155.810 Target 155.038
Disclaimer: This are notes of what I do for my self every week, but usually I just save them as Private notes so I can keep track on my weekly plan. I decided to start publicly sharing them in the hope that they can be somehow helpful to anyone, and maybe learn something from you in the comments.
About me: I trade Support and Resistance both breakouts and rejections, usually my entries are after Hammers and Shooting stars on above average volume. I use VPA (Volume Prize Analysis) for all my analysis and entries. I do not post my Tick Volume indicator as I use different platform for it.
My Win%:
All time 45.05%
2025 45.51%
Q3 51.39%
Good Luck in your trading.
Thank you

EJ Thoughts, Ideas and Trading PlanEuro bias 34% Buy, Yen bias 25% Buy. This are overall biases not cumulative between them only is derived from observing each currency multi cross analysis, including their indices.
Daily:
On both sides we have pairs that my bias see as a buy although not strong buys. Said that let's dig into what is happening between them.
Last week I was very bearish, my intuition and analysis was wrong or not entirely as a re-test of the last high was expected and planned. We are pretty much still at the same point. What has changed from last week is that the Evening star failed to deliver, the bulls took control from the beginning of the week, we have a new low/support at 180.000, and we are heading toward the last high 182.010 on some good bullish patterns. As earlier mentioned both the Euro and the Yen are currently strong, so it is very likely to enter in congestions, and to be honest i will be quiet pleased with that because EJ offers really good entries in while side trading.
4H:
First thing that caught my eye is this bullish channel heading toward 182.010, second thing is EMA 50 which is very active in this channel and acting as support, so far rejecting the price on 3 occasions, and lastly the confirmation of 180.000 as current support in case the price start to fall. So, we have really good boundaries, where to look for rejection what could be a confirmation and what to target, in this case 182.010 is our rejection level, EMA 50 breakout is the confirmation and 180.000 our target. And this is basically all I will be looking for this coming week.
1H:
Zooming in into 1H, I can see that 181.471 has been rejected twice, so this is definitely another level to be aware off, it could be used as a potential pull back support or short entry level once the price reach the area of resistance.
The Plan
Only 1 short entry I'm interested in
Short Rejection at resistance 182.000, Target 180.00. Scaling up strategy starting from 1 lot max increase to 2 lots
181.471 taking half lot profit, then at LH adding one lot
180.800 or when the bottom of the channel breaks same thing.
Disclaimer: This are notes of what I do for my self every week, but usually I just save them as Private notes so I can keep track on my weekly plan. I decided to start publicly sharing them in the hope that they can be somehow helpful to anyone, and maybe learn something from you in the comments.
About me: I trade Support and Resistance both breakouts and rejections, usually my entries are after Hammers and Shooting stars on above average volume. I use VPA (Volume Prize Analysis) for all my analysis and entries. I do not post my Tick Volume indicator as I use different platform for it.
My Win%:
All time 45.05%
2025 45.51%
Q3 51.39%
Good Luck in your trading.
Thank you

EU Thought, Ideas and Trading PlanEU bias 34% Buy USD bias 60% Sell This are overall biases not cumulative between them only is derived from observing each currency multi cross analysis, including their indices.
Daily:
Very similar pattern to the GU but here we are still within the H,L range, this week the bulls managed to push the price above the upper half of the range + a successful test, long legged doji. Also the chart printed a HL, which is not very important yet because is within the range. But overall we are bullish, at least until the upper band of the range, then let's see, another thing that caught my eye is the contact with the EMA, which is currently pretty flat, but would be another bullish sign if we start trading above those levels. My target for the incoming week is 1.16562.
4H
Here the chart gets really interesting, let's break it down:
1. Break of 1.15500 which was holding the price down then came back to tested and up again.
2. The pullback went down to the middle of the range (yellow doted line) and it get rejected again, and also just above this level are positioned the EMA's which are inter-crossing preparing to support a move higher, and to add more to it the rejection came in a text book Morning Star
3. The bulls failed twice to keep the price above 1.16075
So the key takeaway from all of this is, we go long as soon as it breaks and stays above 1.16075
Now the top of the range is not that far just about 50 pips, which makes it a good target to hit possibly within 8 hours of the entry. Considering the ATR is not supper high in this Pair.
1H
Not much to add here, the 4H TF already showed us all we had to see, i can't see anything more or less to support/contradict the analysis at 4H.
The Plan
Long Breakout 1.16075 Target 1.16562
Short Breakout/Long Rejection 1.15500 Target 1.15122/1.16075
More entry levels will be added in the week, but this is what I'm looking for begin with.
Disclaimer: This are notes of what I do for my self every week, but usually I just save them as Private notes so I can keep track on my weekly plan. I decided to start publicly sharing them in the hope that they can be somehow helpful to anyone, and maybe learn something from you in the comments.
About me: I trade Support and Resistance both breakouts and rejections, usually my entries are after Hammers and Shooting stars on above average volume. I use VPA (Volume Prize Analysis) for all my analysis and entries. I do not post my Tick Volume indicator as I use different platform for it.
My Win%:
All time 45.05%
2025 45.51%
Q3 51.39%
Good Luck in your trading.
Thank you

GU Thought, Ideas and Trading PlanDaily:
This is my favourite pair for next week. This is why
1. PA absolutely clean and well formed
2. Breakout of the range + test (the hammer formed on Friday)
3. HL/HH
4. Trading within the Fast and Slow moving averages
5. Clear Targets
Now what I believe are the possible outcomes from here are or straight continuation from here (need a close above the Doji), or little more of a pullback at this point max to the opening of Wednesday and then continuation. I'm limiting my target to 1.33678 and I don't care if it goes above this level, there are 150pips to catch in this move, plenty for a day trader, let's don't be greedy. Also 1.33678 is the 50% Fibonacci Level of the weekly range so it's a pretty solid level, for now.
4H
At the 4H TF, we can see why is it important to close above 1.32690, this is were the bullish momentum came to end last week and stopped the price from going higher for the rest of the week, it is very likely that we enter in small congestion here between levels with some fake outs, please be careful.
1H
Ok, at this TF what I notice first is the secondary Resistance that formed just below 1.32690, the bulls already failed twice to pass this level, looking at this PA I wouldn't be surprised at all to see a re-test of 1.31562 before any attempt to continue higher, and definitely a good short opportunity for about 30-50 pips.
The Plan:
1.Long Breakout 1.32692 Target 1.33678
2.Long Rejection 1.31562 Target I 1.32692 Target II 1.33678 This is a particularly good place of entry for those who use scaling up/down strategies. What I personally would try to do if i get the right rejection signs is to go long 1 full lot, take out half lot at 1.32692 and then if it breaks the level I will look to add more 1 more lot, adjusting also the first SL to match the second.
3. Short Breakout 1.31562 Target 1.30404 (only after tes
Disclaimer: This are notes of what I do for my self every week, but usually I just save them as Private notes so I can keep track on my weekly plan. I decided to start publicly sharing them in the hope that they can be somehow helpful to anyone, and maybe learn something from you in the comments.
About me: I trade Support and Resistance both breakouts and rejections, usually my entries are after Hammers and Shooting stars on above average volume. I use VPA (Volume Prize Analysis) for all my analysis and entries. I do not post my Tick Volume indicator as I use different platform for it.
My Win%:
All time 45.05%
2025 45.51%
Q3 51.39%
Good Luck in your trading.
Thank you

Gold Thoughts, Ideas and Trading Plan WC 01/12Daily:
The past week the Gold rise about 3.75%, started from a rejection at EMA 24 on Monday and close with a wide spread "bold" candle just about the previous high. Now, what shall we expect to happen from here? I can't rely on Tick Volume as is all distorted because of the Holiday's, so be purely judging PA, we either get a rejection here of some form or a continuation. Waiting for confirmation is critical now, although if we zoom out on the weekly TF, we have this wide spread up candle which signal pure bullish momentum and so we might follow that as a bias. Waiting for confirmation at this point is critical. And the cues will be hiding in the faster TF's.
4H
Now, watching at this TF, we can see that the price broke the bullish channel initiated the 18th of November. Which also signals stronger bullish momentum. The Moving Average also start getting a bit of distance between the different lengths, another positive sign of continuation. Last barrier left is to close above 4244.94. In that case we can expect a push all the way to the ATH, otherwise if it fails to cross this level again, then we shall see the gold dropping from here and the first target is the last demand zone at about 3920.
1H
Zooming closer at 1H it's visible how strong was the up move on Friday dominating the last 8 hours of the trading week. Of course after something like this we shall see some form of pullback/correction, but one must be careful not to jump to fast to conclusions, if a reversal is to happen from this point I would expect to see multiple rejection before actually the price changes direction. On the other hand in case of a breakout there might not be a re-test but a straight move up, very typical for what Gold has been doing in the past up moves, so I would be ready to jump (even on higher risk) at the first breakout signal.
The Plan
Long Breakout 4244.94 Target 4379
Short Rejection/Pullback if the price rose to 4379 small target not further than the last Low.
Short Rejection at the current resistance level Target 1 4109.55
Disclaimer: This are notes of what I do for my self every week, but usually I just save them as Private notes so I can keep track on my weekly plan. I decided to start publicly sharing them in the hope that they can be somehow helpful to anyone, and maybe learn something from you in the comments.
About me: I trade Support and Resistance both breakouts and rejections, usually my entries are after Hammers and Shooting stars on above average volume. I use VPA (Volume Prize Analysis) for all my analysis and entries. I do not post my Tick Volume indicator as I use different platform for it.
My Win%:
All time 45.05%
2025 45.51%
Q3 51.39%
Good Luck in your trading.
Thank you

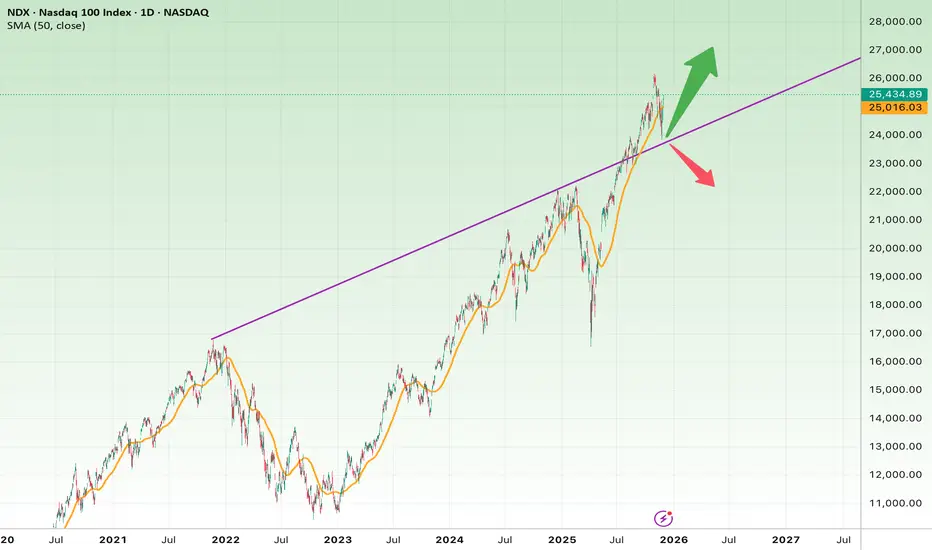
Nasdaq 100 (NDX) – Daily Chart AnalysisThe chart shows that the Nasdaq 100 has been in a strong multi-year uptrend from 2023 to 2025 and is now touching a major long-term ascending trendline (purple line).
This is one of the most critical decision zones for the index.
Bullish Scenario (More Likely at the Moment)
Price is currently holding above the long-term trendline and is also trading above the SMA50 (orange line), which still has a positive upward slope.
If the price continues to respect this trendline:
Bullish Targets
• 26,600
• 27,200
• 28,000 (major upside target)
Signals that strengthen the bullish case:
• A breakout above the previous high near 25,900–26,000
• Strong closing candles above the trendline
• Increasing bullish volume
Bearish Scenario (If the Trendline Breaks)
If the index breaks below the ascending trendline and then loses the SMA50, it could enter a broader corrective phase.
Bearish Targets
• 23,800 – first major support
• 22,500
• 20,800 – key structural support
Bearish confirmation signs:
• A strong breakdown candle below the trendline
• Failure to reclaim the SMA50
• Weak or failed retest (pullback) of the broken trendline
Logical Stop-Loss Zones
• Long positions: Below 24,600
• Short positions: Above 25,900
Quick Summary
• NDX is sitting right on a major long-term trendline.
• Bullish scenario remains stronger as long as the trendline holds.
• Breaking the trendline would likely trigger a deeper correction.
• Holding above it could push price toward 27K–28K.
TCS: SMA 200 for long positionHello traders,
The stock we are going to watch is $NSE:TCS. This stock is related to IT sector. This stock is mostly moving in an upward direction. Currently, it is taking some additional support of SMA200 in 4h time frame. This stock can shoot upwards at anytime.
If you're a option trader, consider buying the premium which is having the liquidity. Consider exiting near 4100 to protect your profits.
Thanks & regards,
Alpha Trading Station

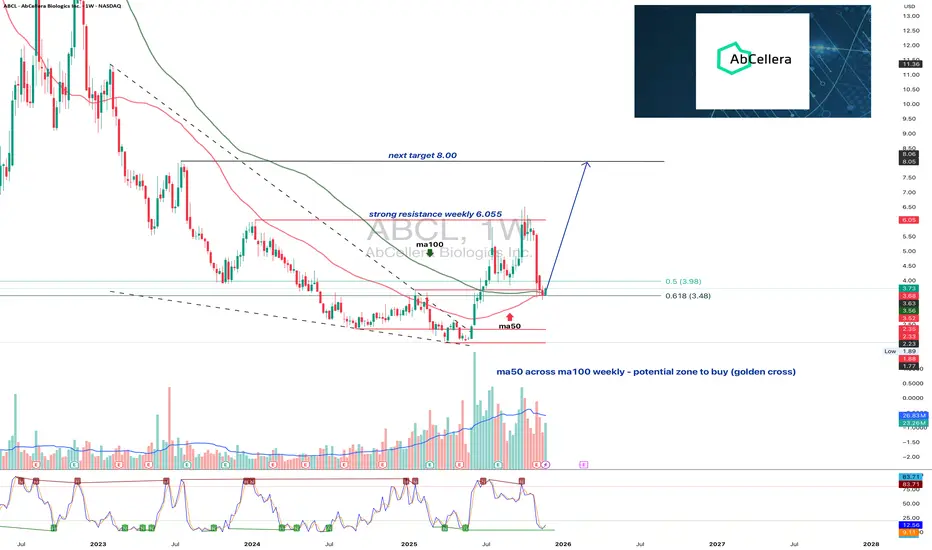
ABCL1W: turning around or just another biotech placeboABCL returns to key weekly support and prepares for the next move
ABCL has tested the strong weekly support zone between 3.48 and 3.98. This area combines Fibonacci retracement levels, a previous breakout retest and an important signal with ma50 crossing above ma100. Such a combination often forms a reliable accumulation zone. Buyers reacted immediately from this region which confirms active demand. The nearest key resistance is located near 6.05. A confident close above this level opens the path toward the next target at 8.00.
AbCellera operates in the biotechnology sector and develops advanced antibody discovery platforms for pharmaceutical partners. Revenue remains uneven due to milestone based payments. However the company maintains a strong balance sheet, significant cash reserves and a growing number of active programs. Improving sentiment in the biotech sector enhances the fundamental backdrop.
As long as price remains above the 3.48 to 3.98 area, the structure retains the signs of a forming medium term base. If this zone is lost, the market may shift into wide consolidation. The present reaction suggests that buyers are defending the level with confidence.
Support levels often speak louder than headlines. The chart usually warns long before the news arrives.
$BTC 200DMA Date With Destiny & ISM PMI RelationshipIn every prior cycle when CRYPTOCAP:BTC lost the 200DMA it retested it well into the midterm year.
Everyone still believed in the 4-year cycle even with this failed relief rally.
But all of a sudden this time is supposed to be different 🤓
My base-case is that we do finally see a proper business cycle in 2026.
I would give it a 50% probability that CRYPTOCAP:BTC does see a higher price IF that does occur.
My hesitation here is that BTC got a higher high in November 2021 with a declining ISM vs March.
Additionally, in April 2014 and February 2018 the ISM printed a slightly higher high, but BTC printed a lower high.
This is the conundrum ₿itcoin has with the ISM, and part of the Twin Peaks thesis (pinned tweet).

#ERAUSDT #1D (Bitget Futures) Descending channel on support LONGCaldera just printed a morning star on daily with good bounce back volume, bottom seems likely.
⚡️⚡️ #ERA/USDT ⚡️⚡️
Exchanges: Bitget Futures
Signal Type: Regular (Long)
Leverage: Isolated (1.3X)
Amount: 4.8%
Current Price:
0.2508
Entry Zone:
0.2503 - 0.2187
Take-Profit Targets:
1) 0.3245
2) 0.3921
3) 0.4598
Stop Targets:
1) 0.1593
Published By: @Zblaba
EURONEXT:ERA BITGET:ERAUSDT.P #1D #Caldera #RaaS #Rollups #DeFi caldera.xyz
Risk/Reward= 1:1.2 | 1:2.1 | 1:3.0
Expected Profit= +49.9% | +87.4% | +124.9%
Possible Loss= -41.7%
Estimated Gaintime= 1-2 months

#BCHBTC #1W (Binance) Big falling wedge breakoutCRYPTOCAP:BCH just regained 50MA weekly support in sats, performing better than CRYPTOCAP:BTC
Seems likely to continue bullish towards 200MA resistance, probably after a pull-back.
⚡️⚡️ #BCH/BTC ⚡️⚡️
Exchanges: Binance
Signal Type: Regular (Long)
Amount: 7.0%
Current Price:
0.004885
Entry Targets:
1) 0.004657
Take-Profit Targets:
1) 0.006329
Stop Targets:
1) 0.003987
Published By: @Zblaba
CRYPTOCAP:BCH BINANCE:BCHBTC #BitcoinCash #PoW bitcoincash.org
Risk/Reward= 1:2.5
Expected Profit= +35.9%
Possible Loss= -14.4%
Estimated Gaintime= 4-7 months

$CLSK: bouncing with $BTCNASDAQ:CLSK : CLSK is leveraged to $BTC. It has bounced strongly. 50DMA and 50% retracement area are coming up next as resistance to this bounce.

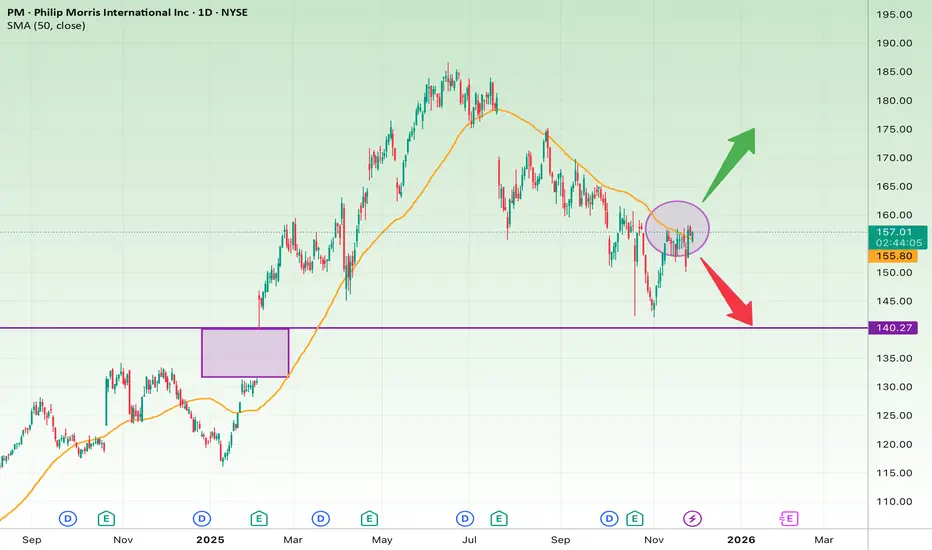
PM at a Major Decision Zone: Breakout or Drop to $140?PM is currently retesting the 155–157 resistance zone, which previously acted as a major support area and now aligns with the 50-day SMA.
This makes the zone a critical decision point.
Bullish Scenario (If breakout occurs)
If price breaks and holds above 157–160:
Bullish Targets:
• $165
• $171
• $178
Bearish Scenario (More likely unless breakout confirmed)
If price gets rejected again:
Bearish Targets:
• $150
• $145
• $140 (key structural support)
Stop Loss
• Long: below $154
• Short: above $160.50
NZDJPY to continue in the rally?NZDJPY - 24h expiry
There is no clear indication that the upward move is coming to an end.
Offers ample risk/reward to buy at the market.
15min EMA is at 89.45.
Our outlook is bullish.
Our bespoke resistance of 89 has been clearly broken.
We look to Buy at 89.45 (stop at 89.05)
Our profit targets will be 90.65 and 90.95
Resistance: 89.56 / 90.00 / 90.50
Support: 89.00 / 88.65 / 88.40
Risk Disclaimer
The trade ideas beyond this page are for informational purposes only and do not constitute investment advice or a solicitation to trade. This information is provided by Signal Centre, a third-party unaffiliated with OANDA, and is intended for general circulation only. OANDA does not guarantee the accuracy of this information and assumes no responsibilities for the information provided by the third party. The information does not take into account the specific investment objectives, financial situation, or particular needs of any particular person. You should take into account your specific investment objectives, financial situation, and particular needs before making a commitment to trade, including seeking, under a separate engagement, as you deem fit.
You accept that you assume all risks in independently viewing the contents and selecting a chosen strategy.
Where the research is distributed in Singapore to a person who is not an Accredited Investor, Expert Investor or an Institutional Investor, Oanda Asia Pacific Pte Ltd (“OAP“) accepts legal responsibility for the contents of the report to such persons only to the extent required by law. Singapore customers should contact OAP at 6579 8289 for matters arising from, or in connection with, the information/research distributed.

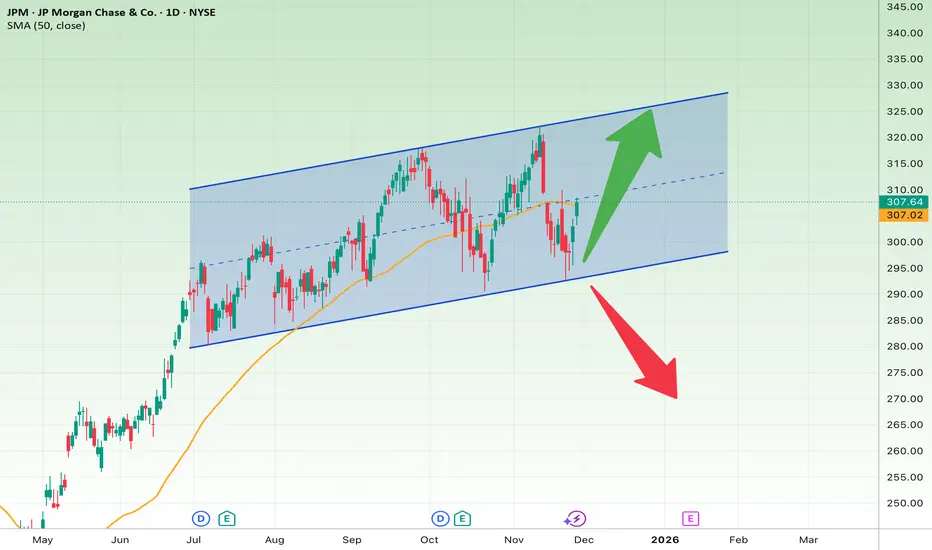
JPM at a Make-or-Break Level: Breakout to $325 or Drop to $276?JPM is moving inside a well-defined ascending channel, and the price is currently trading near the midline of the channel, slightly above the 50-day SMA.
This is a decisive zone:
either the price bounces toward the upper channel,
or it breaks below the midline and heads toward the lower boundary.
Current price: $307–308
Bullish Scenario (More likely given the structure)
As long as the price holds above the midline and the 50-day SMA, an upward push is expected.
Bullish Targets:
• Target 1: $314
• Target 2: $320
• Target 3: $324–325 (top of the channel)
Bearish Scenario
If the price drops back below $301–302, downward momentum may accelerate.
Bearish Targets:
• Target 1: $295
• Target 2: $288
• Target 3: $276 (lower channel support)
Stop Loss
• For long positions: Below $301
• For short positions: Above $314
1:6 Long on BDL BDL is currently sitting on 200EMA which is a long term support, plus near bottom of a tight range. if it breaks out of this range it can quickly move up and reach all time high. Risk is very low compared to reward (We get 1:6 compared standard minimum of 1:2)

AUD/USD: Prime setup zone emerges around .6520AUD/USD has rebounded strongly after a brief foray beneath the 200DMA last week, with the pair now sitting just beneath .6520, a level that has repeatedly acted as both support and resistance in recent months. Its location provides a decent area to build trade setups around, depending on how price action evolves in the coming days.
Given its trajectory, bullish setups are marginally favoured even though the overall signal from RSI (14) and MACD is neutral on momentum. This partly reflects we’re entering a low-liquidity period that often sees riskier assets outperform.
Should we see a sustained break and hold above .6520, longs could be established with a stop beneath the level for protection, targeting areas beyond the 50DMA such as the September downtrend, .6580 or .6625, depending on your preferred risk-reward. The 50DMA screens as not far enough away to justify the risk, making it a key level to watch should you initiate the trade. If the price struggles to break cleanly above it, consider closing the position.
If the pair can’t break and hold above .6520, shorts could be established beneath the level with a stop above, targeting the 200DMA initially.
Good luck!
DS

Gap up on GC- Big gap up on the opening
- Left behind an low volume zone
- Quite over streched the daily
- Looking for short term downside

NFLX Is Falling Into a Critical Zone — Rebound or Breakdown?Netflix is trading inside a descending channel, and the price has just touched the lower boundary, which is typically a zone of strong reaction—either a bullish reversal or a continuation breakdown.
The current price is around $104–105.
Bullish Scenario
If the lower channel holds and bullish candles form, a rebound toward the upper channel is likely.
Bullish Targets:
• Target 1: $112 (50-day SMA)
• Target 2: $118
• Target 3: $125 (top of the channel)
Bearish Scenario
If the price loses the $103–104 support, the downtrend may accelerate.
Bearish Targets:
• Target 1: $98
• Target 2: $92
• Target 3: $79 (major long-term support)
Stop Loss
• For long positions: Below $103
• For short positions: Above $112

Looking good for a short continuationPrice retested the 1H EMA 50 and rejected, that was the entry. Now I'm watching how price behaves around the 4H EMA 50. If candle closes bullish I will close my trade, if price closes below the 4H EMA 50 I'll continue the sell targeting the next order block.
