BTCUSD BearishPrice reacted on resistance and EMA
But there is big news coming on 8.30, Will see what is the impact
Moving Averages

Price Change:+0.08 + Hammer Candlestick Pattern🔨 Hammer.
That's the name of this candlestick.
I have some sad news sad very sad.i lost a business partner.Now I have no choice but to use forex trading as a source of income.
It's crazy that I mastered forex trading as soon as this partnership has ended 😢 it's crazy how God works.
Just when I thought I am finished just when I thought trading is fake.Then boom 🤯...
I have now mastered forex trading.
My partner is gone because of marriage and pursuing academia studies.
All I have is this trading skill set .
I decided not to pursue academia and decided to invest in trading education honestly I didn't think I would even understand this.
The Brain 🧠 is a unique organ built to not only protect you but help you it's your biggest investment.
This pattern has "touched " support 💪that's the key... make sure it touches support and closes above the 20EMA.
If you do this then you will master the secret to price action.
Trade safe.
Check out the Trading Secrets Series Below 👇 For a Full Break down of this trading strategy.
Disclaimer ⚠️ Trading is risky please learn about risk management and profit taking strategies .
Also feel free to use a simulation trading account before you use real money.

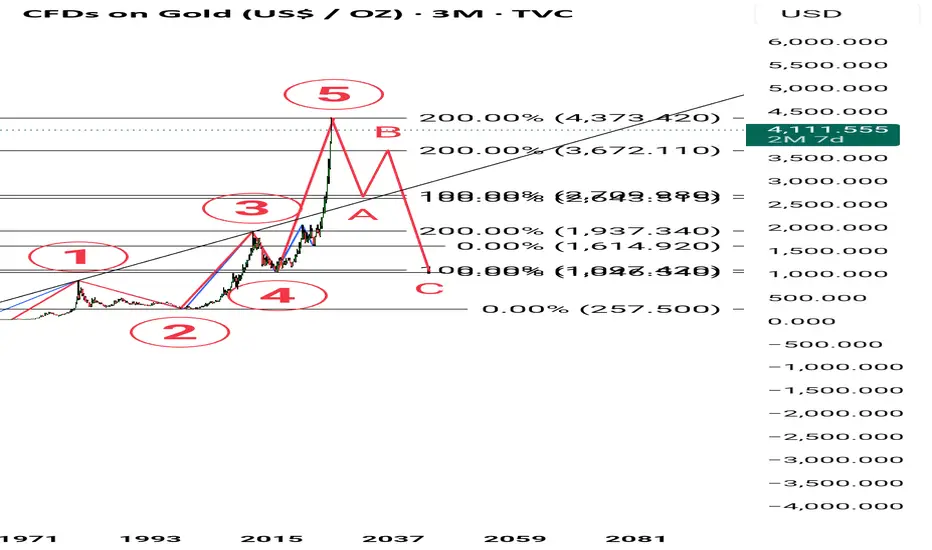
I think cycle the end This is only idea history base idea i dont know this is correct or not but this is very high rate poor person how to buy yellow metal uff heavy rate in markets this is danger for human life gold is not safe for womans snatching problums in humans life sorry for my poor language
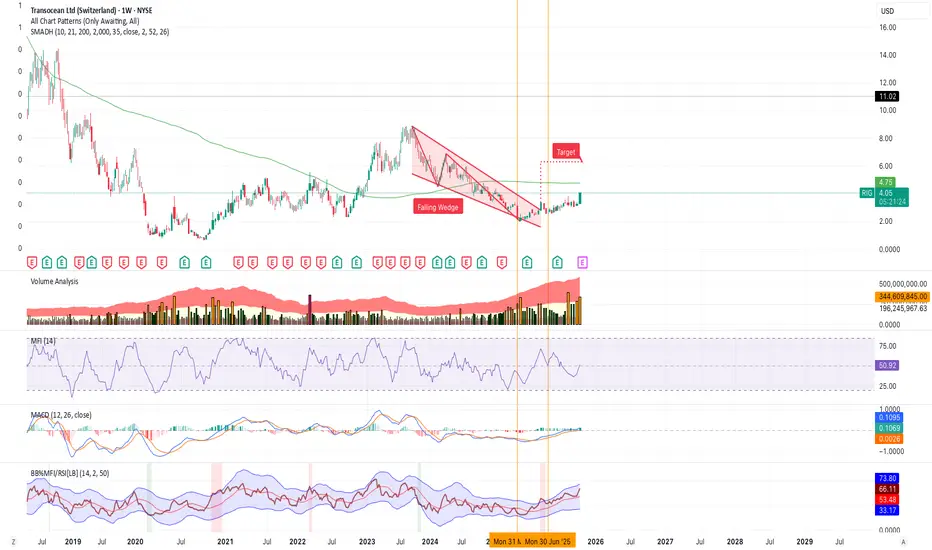
$RIG approaching 200W moving averageNYSE:RIG is approaching its 200-week smoothed moving average on unusually strong volume. I will be watching for a clear break and support on it. The last time this occurred, the stock doubled. With growing recent volume, a strong uptrend appears to be in play. This narrative could develop significantly if geopolitics continue to push oil and gas. Additionally, D. E. Shaw upped their holdings of NYSE:RIG by +1,000% last quarter (between the orange vertical lines), which I like to see.
Steel Dynamics Could Be Fighting Higher Steel Dynamics hit a record high on Tuesday after earnings beat estimates. Now, after a pullback, some traders may see potential for more upside.
The first pattern on today’s chart is the October 9 closing price of $147.78. STLD was trapped below that level for more than a week, but it ripped through resistance following quarterly results. The stock remained above it the next two sessions as it fell and bounced, which may suggest new support is emerging above an old high.
Second is the November 2024 all-time high of $155.56. The steelmaker has made an initial probe of that level. Will another test be more successful?
Third, notice how the moving averages have spread out since September. The 8-day exponential moving average (EMA) is above the 21-day EMA and the 50-day simple moving average (SMA) is above the 200-day SMA. That may suggest its short- and long-term trends are getting more bullish.
Finally, MACD has been rising.
TradeStation has, for decades, advanced the trading industry, providing access to stocks, options and futures. If you're born to trade, we could be for you. See our Overview for more.
Past performance, whether actual or indicated by historical tests of strategies, is no guarantee of future performance or success. There is a possibility that you may sustain a loss equal to or greater than your entire investment regardless of which asset class you trade (equities, options or futures); therefore, you should not invest or risk money that you cannot afford to lose. Online trading is not suitable for all investors. View the document titled Characteristics and Risks of Standardized Options at www.TradeStation.com . Before trading any asset class, customers must read the relevant risk disclosure statements on www.TradeStation.com . System access and trade placement and execution may be delayed or fail due to market volatility and volume, quote delays, system and software errors, Internet traffic, outages and other factors.
Securities and futures trading is offered to self-directed customers by TradeStation Securities, Inc., a broker-dealer registered with the Securities and Exchange Commission and a futures commission merchant licensed with the Commodity Futures Trading Commission). TradeStation Securities is a member of the Financial Industry Regulatory Authority, the National Futures Association, and a number of exchanges.
TradeStation Securities, Inc. and TradeStation Technologies, Inc. are each wholly owned subsidiaries of TradeStation Group, Inc., both operating, and providing products and services, under the TradeStation brand and trademark. When applying for, or purchasing, accounts, subscriptions, products and services, it is important that you know which company you will be dealing with. Visit www.TradeStation.com for further important information explaining what this means.

ETH 1h chartCRYPTOCAP:ETH 1H Chart
Ethereum showing a clear market structure shift.
After a liquidity grab and CHoCH, price respected the 1H FVG and confirmed a bullish BOS, signaling potential continuation to the upside.
If price maintains above the FVG zone, ETH could look for higher targets in the short term.
#ETH #Ethereum #Crypto #PriceAction

NICU - LONG - Magna Mining - Finally a FOMO releiving pullback. A well-earned pullback after a parabolic Wave 3 run, aligning perfectly with the Q3 production and Levack assay releases. The market read the updates as solid but not spectacular — a case of “good results, high expectations.” Price action tagged the 1.0 Fib extension near 2.57 CAD, right on top of the 50-day SMA, confirming early Wave 4 development inside the 2.35 – 2.65 CAD retracement zone. The 20 EMA has now rolled over to act as short-term resistance around 2.80 CAD, while the 50 SMA rises to provide confluence support beneath. This structure remains fully intact within the bullish Elliott model — a healthy mean reversion rather than trend failure. A daily close back above 2.80 CAD would suggest Wave 4 completion and signal the next advance toward the 3.14–3.30 CAD Wave 5 zone.

USDJPY LONG Market structure bullish on HTFs DW
Entry both DW
Candlestick rejection Daily and Weekly
Previous Structure point both Daily and Weekly
Around Psychological Level 149.500
H4 Candlestick rejection Y
Levels
Entry 95%
REMEMBER : Trading is a Game Of Probability
: Manage Your Risk
: Be Patient
: Every Moment Is Unique
: Rinse, Wash, Repeat!
: Christ is King.

EURUSD Short: Setup After Fake Breakout and Supply RejectionHello, traders! The market for EURUSD has been developing within a well-defined descending structure, characterized by lower highs and consistent rejection from the upper supply levels. After the earlier breakout from the falling wedge formation, the price transitioned into a broad consolidation range between the 1.1720 Supply Zone and the 1.1545 Demand Zone. This structure represents a balanced market phase, where buyers and sellers are testing control over short-term direction.
Currently, the price has once again approached the upper boundary of the range — the 1.1720 Supply Level — and faced a clear rejection. This move suggests that sellers are still defending this zone and that the market remains trapped within the broader consolidation phase.
My scenario anticipates a continuation of the decline from the Supply Zone.
The recent rejection confirms the presence of strong selling interest and indicates that the next likely move will be a rotation back toward the Demand Zone near 1.1545. Therefore, I’m watching for continued bearish momentum, with the take-profit target placed at 1.1545, in alignment with the lower boundary of the range. Manage your risk.

BNB 1H ChartCRYPTOCAP:BNB 1H Chart
Forming a Cup & Handle pattern.
Price holding above the FVG 1H zone, watching for a breakout above ~$1.1k
Next target: $1,190 (+7–8%) if momentum continues. 🚀

NBIS : Long worth TryingNebius group stocks are technically strong.
The downtrend since November 9, 2021 has been broken and the price is trading above the 50 and 200-period moving averages.
When we draw a medium-term Fibonacci level, we can take the take profit point at 0.618 and the stop-loss point at 0.382.
This gives us a Risk/Reward Ratio of 3.00.
A small position size is ideal.
Risk/Reward Ratio : 3.00
Stop-Loss : 43.46
Take-Profit : 60.00

RGTI : First Long Position AreaNASDAQ listed Rigetti Computing Inc. stock is currently trading above the 50 and 200 period moving averages.
Once it gained momentum, it later lost it but its outlook is not weak at the moment.
Right now, if the Iran-Israel war uncertainty is overcome and if there is no bad news affecting the index, the gap may close.
Risk/Reward ratio of 3.00 is a very valuable ratio to try with small position amounts.
Risk/Reward Ratio : 3.00
Stop-Loss : 9.91
Take-Profit : 18.2
Regards.

XAUUSD BULLPrice reacted on the support after a strong retracement after the big bull push
Expecting price to continue bullish between this S&R Zone

QUBT - All MAs Pointing North!QUBT - CURRENT PRICE : 21.32
Technical Analysis Summary
Trend Analysis: The 20-day SMA is sloping upward, indicating short-term bullish momentum. Both the 50-day EMA and 200-day EMA are also trending higher, confirming that the medium- and long-term trends remain positive. Price is trading above all key moving averages, reinforcing a healthy uptrend structure.
Momentum Indicator (RSI): The RSI (14) is currently around 56, which is within the bullish territory (above 50). This shows positive momentum and room for further upside before entering overbought conditions.
Volume Analysis: Recent up-moves have been accompanied by rising volume, suggesting that the buying interest is supported by strong participation from investors.
Ichimoku Cloud: The price is above the Ichimoku Cloud, confirming the bullish sentiment and strong price structure. Chikou Span is above candlesticks and cloud further strengthening bullish outlook.
ENTRY PRICE : 21.20 - 21.40
FIRST TARGET : 25.00
SECOND TARGET : 28.00
SUPPORT : 18.00

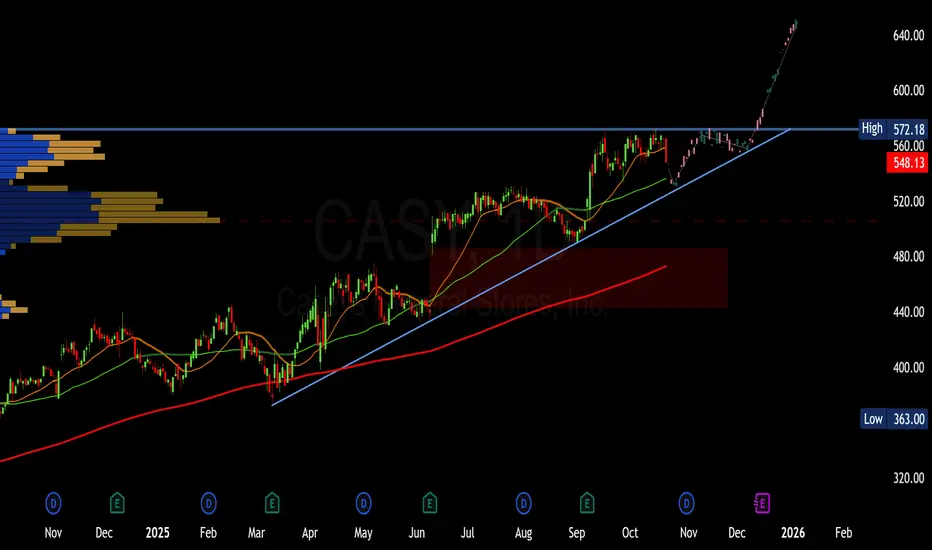
CASY Casey's potential ascending triangleNASDAQ:CASY Casey's is forming a potential ascending triangle, with higher lows (~$540–$550) and resistance at $580–$600. Bullish momentum (RSI ~65, positive MACD) suggests a breakout above $600 could target $620–$650 as Q2 earnings approach in December. A pullback to the $445–$480 gap offers a strong entry point for longs. Watch volume and earnings catalysts! Casey's General Stores, Inc. operates approximately 2,900 convenience stores in 19 states.
HIMX 1D - eyes back on the screen?Himax Technologies is shaping a strong setup: after breaking above the downtrend line, the stock is now retesting the $8.70–$9.00 support zone, aligning perfectly with previous resistance and short-term EMAs. It’s a textbook breakout + retest situation.
All moving averages (MA/EMA/SMA) are below the price, confirming that buyers are in control. The bullish targets are set at $10.41 and $12.49. As long as the $8.70 level holds, the uptrend scenario stays valid.
On the fundamental side, Himax remains a key player in display driver ICs, particularly for AR/VR and automotive applications. With the growing adoption of smart displays and head-up tech, the stock could light up again.
Tactical plan: watch $8.7–9.0 carefully. If buyers hold the line - it’s showtime. If not - let the chip cool down before the next rally.

The 3 Parts Of The Rocket Booster Strategy The the three parts are simple to remember.
Let me tell you a story.
I still remember the time I broke up with my girlfriend.
I got "Rocket Stocks" by M. Kratter.
I studied that book everyday for about 50 days!
It was not easy.But I wanted to master this skill.
I was deeply sad.
She said "Lubosi am helping you."
WTF - 😡
Well I am now stuck no cash , no hope and no love.
I studied as if this will help me.This was before the pandemic hit the peak months of lockdowns.
Am telling you it was a beast.
Two months pass by this year I start streaming.
I say a small prayer,
" God help me help your people learn how to trade."
Boom 🤯!!!
The Rocket Booster Strategy is boosted.
What is the boost?
20 Day Moving Average.
The price should be below the 20 SMA.
It was right there in our faces and I missed it.
Not only that the price should Touch the support.
Or else it's called a "Random" pattern.
The 3 Parts:
🚀Price above the 50 SMA
🚀Price above the 200 SMA
🚀Price touching support (50 SMA)
🌟 Bonus 🌟
*** Make sure price below 20 SMA
*** High Volume
*** 40 - 60 RSI indicator
That's it 😅
Trade safe.
Rocket boost this content to learn more.
P.S.
The high volume + Earnings Report provides a powerful catalyst.
Disclaimer ⚠️ Trading is risky please learn about risk management and profit taking strategies.
Also feel free to use a simulation trading account before you use real money.

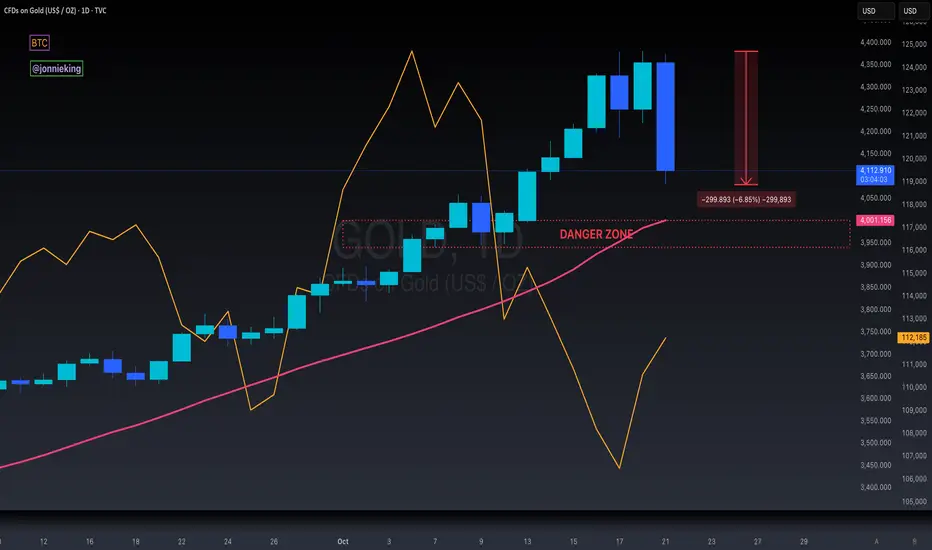
$GOLD Bearish Engulfing on Daily - Rotation to $BTC Incoming!MASSIVE BEARISH ENGULFING FORMING ON THE TVC:GOLD DAILY CHART.
Down ~7% just on the day alone.
~$2 TRILLION has been wiped out on its market cap,
the equivalent of Bitcoin’s entire MC.
We can see the rotation into CRYPTOCAP:BTC in real-time here.
If GOLD Closes below the DANGER ZONE,
it’s game-over for everyone’s favorite pet rock 🪙
Gold appears to have peaked.Gold double top on the 4 hrly + broken down through the green 50 SMA line.
Rotation into crypto next?

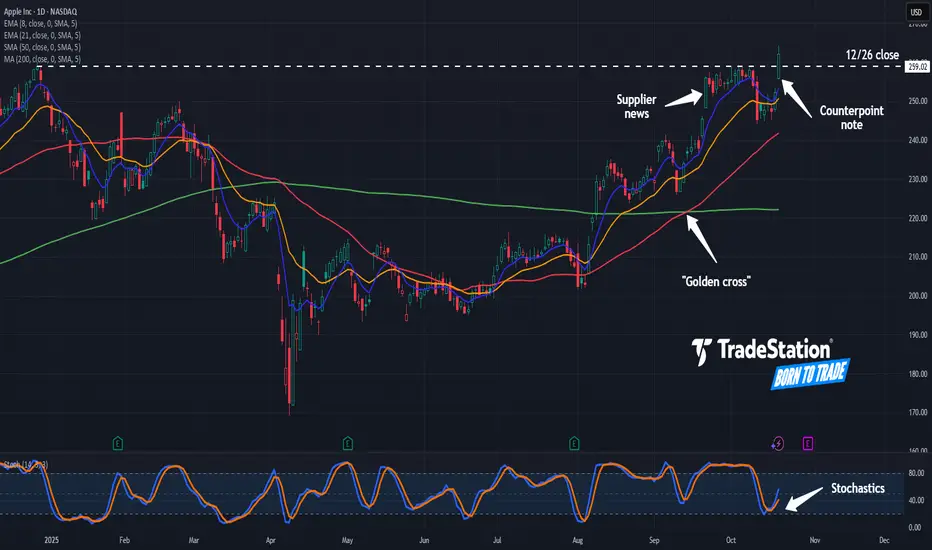
Potential Breakout in Apple Apple has been trapped as the broader Nasdaq rallies, but that might have changed yesterday.
The first pattern on today’s chart is the December 26 closing price of $259.02. AAPL paused near that level in early October but closed above it yesterday. That may be viewed as a potentially bullish breakout.
Second, the tech giant surged on September 22 after The Information reported suppliers were told to increase component production. That was the first clue of strong demand for the iPhone 17. Another report from Counterpoint Research on Monday noted strong early sales of the new handset.
Third, the 50-day simple moving average (SMA) had a bullish “golden cross” above the 200-day SMA last month. That may suggest its longer-term trend is getting more bullish.
Fourth, the 8-day exponential moving average (EMA) is above the 21-day EMA. That may reflect a bullish short-term trend.
Next, stochastics recently turned up from an oversold condition.
Finally, AAPL is a highly active underlier in the options market. (Its average daily volume of 790,000 contracts ranks fifth in the S&P 500, according to TradeStation data.) That could help traders take positions with calls and puts.
TradeStation has, for decades, advanced the trading industry, providing access to stocks, options and futures. If you're born to trade, we could be for you. See our Overview for more.
Past performance, whether actual or indicated by historical tests of strategies, is no guarantee of future performance or success. There is a possibility that you may sustain a loss equal to or greater than your entire investment regardless of which asset class you trade (equities, options or futures); therefore, you should not invest or risk money that you cannot afford to lose. Online trading is not suitable for all investors. View the document titled Characteristics and Risks of Standardized Options at www.TradeStation.com . Before trading any asset class, customers must read the relevant risk disclosure statements on www.TradeStation.com . System access and trade placement and execution may be delayed or fail due to market volatility and volume, quote delays, system and software errors, Internet traffic, outages and other factors.
Securities and futures trading is offered to self-directed customers by TradeStation Securities, Inc., a broker-dealer registered with the Securities and Exchange Commission and a futures commission merchant licensed with the Commodity Futures Trading Commission). TradeStation Securities is a member of the Financial Industry Regulatory Authority, the National Futures Association, and a number of exchanges.
Options trading is not suitable for all investors. Your TradeStation Securities’ account application to trade options will be considered and approved or disapproved based on all relevant factors, including your trading experience. See www.TradeStation.com . Visit www.TradeStation.com for full details on the costs and fees associated with options.
Margin trading involves risks, and it is important that you fully understand those risks before trading on margin. The Margin Disclosure Statement outlines many of those risks, including that you can lose more funds than you deposit in your margin account; your brokerage firm can force the sale of securities in your account; your brokerage firm can sell your securities without contacting you; and you are not entitled to an extension of time on a margin call. Review the Margin Disclosure Statement at www.TradeStation.com .
TradeStation Securities, Inc. and TradeStation Technologies, Inc. are each wholly owned subsidiaries of TradeStation Group, Inc., both operating, and providing products and services, under the TradeStation brand and trademark. When applying for, or purchasing, accounts, subscriptions, products and services, it is important that you know which company you will be dealing with. Visit www.TradeStation.com for further important information explaining what this means.
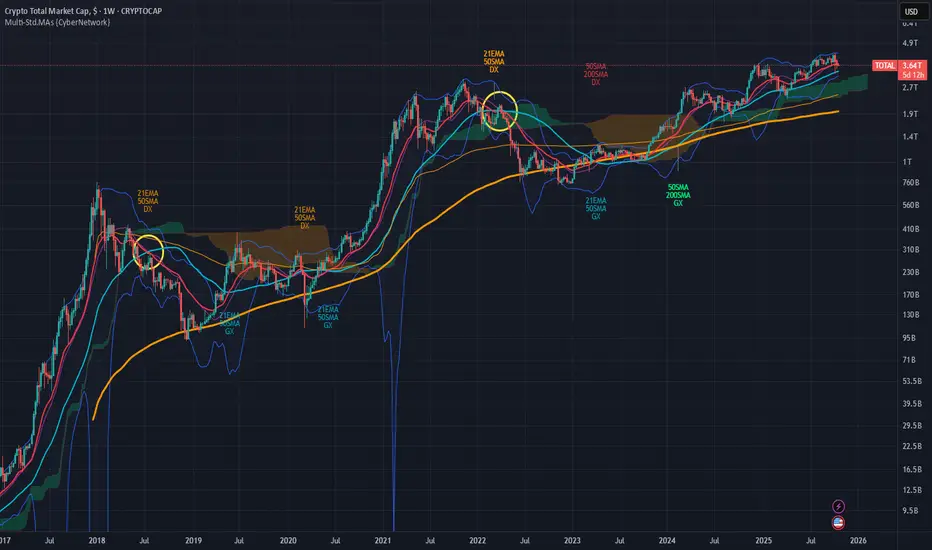
Crypto Bull Market End Indicator.Bull market ends when the RED 21 EMA crosses below the green 50 SMA line on the weekly chart of the Crypto TOTAL Market Cap.
Buying BTC and ETH (and KAS as well after this cycle) aggressively only when price has returned to around the thick orange 200 SMA line, and especially whenever it falls below.
Kaspa $KAS bullish 21 EMA breakout on the 4hrly chart.CRYPTO:KASUSD #Kaspa breaking out on the 4hrly above the dashed-white resistance line as well as the red 21 EMA.
Waiting for current candle close above the red 21 EMA for confirmation.
Continuing to DCA during the fear and uncertainty (US-Gov Shutdown, PRC +100% Tarifs, QE looming, etc.) to accumulate in anticipation of FUD eventually being resolved.
Managed to buy a lot more CRYPTO:KASUSD with CRYPTOCAP:BTC at ca. 3 cents and still DCAing atm. Got caught off guard by the +100% PRC tariff triggered mass liquidation induced dump. But only the price has changed, fundamentals kept on improving.
If 10 cents was a good buy. 3 cents and now 5 cents+ is a way better accumulation level, while the market remains fearful and bleeding red.
FusionGap Histogram has also flipped bullish on the 3hrly (an early signal to the 4hrly if price holds above 21 EMA).

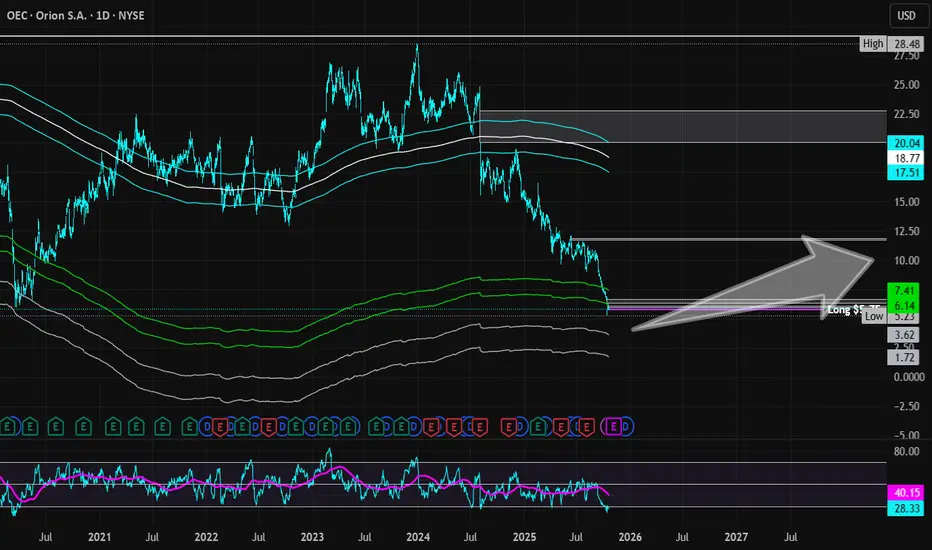
Orion S.A.| OEC | Long at $5.75Orion NYSE:OEC : Another chemicals company in the dumps, but is it justified - long-term?
Technical Analysis
Price fell through my "crash" simple moving average zone (green lines). The last time this happened the price moved down to my "major crash" zone (gray lines) and subsequently rallied to a 4x investment 1.5 years later. Not to say that same trajectory will happen, but this company (like all chemical companies) are historically cyclical. The price may continue to drop into the $3's in the near-term and complete the "major crash" touch, but a longer-term outlook is likely to generate positive returns... likely...
Growth
A bad 2025, but beyond that, projections show growth in earnings and revenue through 2027: www.tradingview.com
Fair Value and Health
Fair value: $8.30
Tangible Fair Value: $6.58
Company cut its 2025 guidance due to softer demand and shifted focus to free cash flow generation.
Debt-to-equity: 2.19x (high)
Action
While this is mostly a technical analysis play, there are so many opportunities right now with chemical companies. The tape beyond 2025 is likely to be positive and those who can stomach the near-term risks (i.e. $3's) may do well long-term. But there are better plays out there for the impatient.
Targets into 2028
$6.60 (+14.8%)
$9.00 (+56.5%)