GE Aerospace – Daily ChartMarket Structure
After a strong bullish trend, the stock experienced a V-shaped correction and rebounded back toward a key resistance zone. Price remains above the rising moving average, confirming that the primary trend is still bullish, but the current area is critical.
Short-Term Outlook
• Primary scenario:
The 316–318 zone is a major resistance. Price reaction here will define the next move.
• Key support:
300–295 zone, aligned with the moving average
• Bullish short-term targets (on breakout):
• 330
• 340
• Short-term stop loss:
Daily close below 295
• Bearish alternative:
Rejection from resistance may lead to a pullback toward 285–280
Mid / Long-Term Outlook
• Trend:
Bullish structure remains intact
• Price logic:
Recent move resembles a healthy pullback within a broader uptrend
• Long-term targets:
• First target: 350
• Extended target: 370 – 380
• Long-term invalidation:
Weekly close below 280
Fundamental Summary
• Strong exposure to aerospace and defense contracts
• Benefiting from global defense spending growth
• Long-term order backlog supports revenue stability
• Cyclical sensitivity, but solid structural growth outlook
Moving Averages

Daily GOLD ChartGold remains in a strong bullish trend, currently consolidating inside an ascending channel. This phase represents a healthy correction, not a trend reversal. Price is still trading above the moving average, confirming bullish control.
Short-Term Outlook
• Primary scenario:
Price is oscillating in the upper half of the channel. Pullbacks toward channel support are potential buy zones.
• Key support zone:
Channel support around 4,180 – 4,220
• Short-term target:
Upper channel resistance at 4,550 – 4,600
• Short-term stop loss:
Daily close below 4,120
• Bearish alternative:
Breakdown of channel may trigger a deeper correction toward 4,000 – 4,050
Mid / Long-Term Outlook
• Trend:
Strong bullish structure (Higher Highs & Higher Lows)
• Pattern logic:
The current channel acts as a bullish continuation pattern
• Long-term targets (on breakout):
• First target: 4,700
• Extended target: 4,900 – 5,000
• Long-term invalidation / stop:
Weekly close below 3,950
Fundamental Summary
• Expectations of future interest rate cuts
• Persistent geopolitical and economic uncertainty
• Ongoing central bank gold accumulation
• Periodic weakness in the US dollar
Fundamentals remain strongly supportive for gold in the medium to long term.

CADJPY - ShortI am waiting for this setup for some time (around 3 months).
Now I will need to wait for some more time. :)

Prebreakout Buildup at a 4-Year Resistance: IPCA LaboratoriesTL;DR: The High-Conviction "Pre-Breakout Buildup & Squeeze" Setup
IPCA Labs is currently edging towards the apex of a year-long pennant consolidation at a major 4-year resistance level. With both NIFTY and NIFTY Pharma indices looking bullishly poised, the odds favor bullish breakout in IPCA soon.
Step 1: The "Forest to the Trees" Filter (Tailwinds)
The Forest (Nifty 50): The broad market is structurally robust, coiling near record highs and positioned for a possible continuation breakout.
The Trees (Nifty Pharma Index): The NIFTY Pharma index also looks good, positioned for a possible bullish breakout.
Conclusion: Macro and sector tailwinds are firmly in place to support individual pharma breakouts.
Step 2: Big Picture (Stan Weinstein Stage Analysis)
The 4-Year Ceiling: The stock has been capped by a major horizontal resistance at ₹1380 since 2021.
The Buildup Phase: An initial breakout attempt in late 2024 failed to sustain, leading to a year-long pennant-shaped continuation pattern. This oscillation has allowed the stock to absorb the multi-year overhead supply.
The Stage: Having spent significant time basing and now coiling at range highs, IPCA is primed for a transition into a decisive Stage 2 Advance.
Step 3: Execution Structure (Prebreakout PA Analysis)
The Buildup: The last 12 months show a tightening "pennant" structure right at the key ₹1380 level - a classic sign of institutional absorption.
Momentum Signal: November 2025 saw a strong bullish monthly bar breaking above the 20-Month EMA and the resistance level on high volume.
The Prebreakout Squeeze: December 2025 is closing as a tight doji above the breakout level. This narrow-spread candle above the EMA/resistance is a "squeeze" that creates tension - and could resolve in an explosive move if bulls can push beyond the year-long pattern's boundary.
Step 4: Fundamental Engine (The Notebook)
Operational Turnaround: Q2 FY2026 saw robust profit growth of 23.13% YoY (₹282.57 Cr) and record quarterly revenue.
Margin Expansion: Standalone EBITDA margins surged to 25.46%, a 257 bps improvement reflecting enhanced operational efficiency.
API Surge: The API business is a major growth driver, with sales increasing 28% to ₹408 Cr in the most recent quarter.
Valuation Gap: Currently trading at a P/B of ~4.9x. While higher than some peers, its ROA of ~7.3% and ROE of ~12.8% are trending upward as operational leverage kicks in.
Financial Health: Maintains a very low debt-to-equity ratio of ~0.19 with an interest coverage ratio of 34.9x.
Possible Entries:
Aggressive: Within the current "squeeze" zone (₹1380–₹1470), as close to the 20-Month, or 20-Week EMA as possible.
Important note for this entry - check how the monthly closes (in 2 days from now). If it closes somewhat like it looks now (a tight doji), then this entry would have decent odds.
Conservative: On a decisive weekly close above the pennant's upper boundary.
Invalidation of the setup: Bearish break & close below the pennant, or below the 20-month EMA (or 20-week EMA if following on weekly)
Disclaimer: This analysis is for educational purposes only and does not constitute financial advice. Market investments are subject to risk; please consult a SEBI-registered advisor before trading.

USDCAD 50% - 61.8% Sell Fib Zone.Price is in Strong Downtrend making new lower highs and lower lows.
Price broke Weekly Support level that has turned to resistance level at (1.37435 - 1.37217).
Price is in heavy bearish momentum, a level that held "3 times" was finally broken which requires heavy bearish momentum & selling presence.
Price is in (50% - 61.8%) Fib Zone which represent a very deep pullback in price.
50 EMA crosses at the Resistance level acting as support

JPM — Bullish Channel at Decision PointTechnical Overview
• Price is moving inside a well-defined ascending channel
• Currently testing the upper channel resistance
• Trend remains bullish as long as price holds above the channel midline & SMA
Bullish Scenario
• Confirmation: Strong daily close above the channel top (~330)
• Targets:
• 345
• 360
• Stop-loss: 318 (back inside channel)
Bearish / Pullback Scenario
• Rejection from resistance may trigger a healthy correction
• Downside zones:
• 305
• 295 (lower channel support)
• Invalidation of trend: Daily close below 295
Trend Bias
• Short-term: Neutral → Bullish (breakout-dependent)
• Mid / Long-term: Bullish while inside the ascending channel
Fundamental Snapshot (Brief)
• JPM remains the strongest U.S. bank fundamentally
• Benefits from:
• High interest rates
• Strong balance sheet
• Market leadership in investment & commercial banking
• Fundamentally aligned with long-term bullish technical structure

NIFTY: Reading the 10-week Silence Under ResistanceWhat I'm seeing: Tight, 'boring' consolidation under key resistance
For the past 10 weeks, NIFTY price action has been "boring" on the surface. Week after week, price has been heading nowhere. Weekly candle ranges are tight without much action. But if we look at the structure a bit more carefully—it's actually quite interesting.
What story is this silence in the price action telling?
Let's try to read the story that NIFTY has been telling for the past few months:
The Level: The last major high of around 26.4k was put in back in Sep '24. Since then, price has remained below this key level.
The Approach: Price finally returned to this resistance in late Oct '25.
The Reaction: One might have expected a strong sell-off given the history of this level. Instead, NIFTY is meandering in a tight range (25.5k - 26.5k) for 10 weeks and counting. This is a massive clue that supply is being absorbed.
Pre-breakout structures:
This is a classic example of a "pre-breakout structure." This is the pattern I like to see most on higher timeframes.
Key Characteristics:
Defined Resistance: The 26.3k–26.4k area is a clear ceiling.
Higher Lows: We see a sequence of rising support—Aug '25, Sep '25, and early Nov '25.
The Buildup: A tight "squeeze" near resistance and above the 20-week EMA. This coiling action often precedes an explosive move.
What’s next?
The way price action is shaping up, the odds for a bullish breakout are good within the next 1–3 months. Every tight weekly candle adds to the "squeeze."
Note: Bulls must defend the 20W EMA. We may see one more "test" of this average before the breakout attempt begins in earnest.
The Tradeable Setup:
The PreBreakout Entry: Building a position within the buildup, as close to the 20W EMA as possible.
The Breakout Entry: Waiting for a push above 26.4k (trigger), ensuring the entry isn't too far extended from the level.
Invalidation Points:
Aggressive: Prior swing low from early Nov at 25.4k.
Conservative: Swing low from late Sep at 24.6k.
Broader Market Context: The "North Star" Effect
While this analysis is focused on NIFTY Index Futures, its implications are much wider. The NIFTY 50 acts as the "North Star" for the Indian stock market.
The Tide Lifts All Boats: Bullish posturing in the NIFTY—and a successful breakout if/when it happens—provides the necessary "risk-on" environment for individual stocks to break out of their own bases.
A Bullish Filter: When the index is coiling like this, it’s often the best time to build a "watchlist of strength." If the NIFTY resolves this consolidation to the upside, the stocks that have been holding up best will likely be the first to fly.
Use the NIFTY's price action as your broad-market filter. A breakout here isn't just a trade for futures players; it’s a green light for the entire Indian equity space.
Disclaimer
This post is for educational purposes only and does not constitute financial advice. Trading in the stock market involves significant risk. Please perform your own due diligence or consult with a SEBI-registered investment advisor before making any trading decisions.

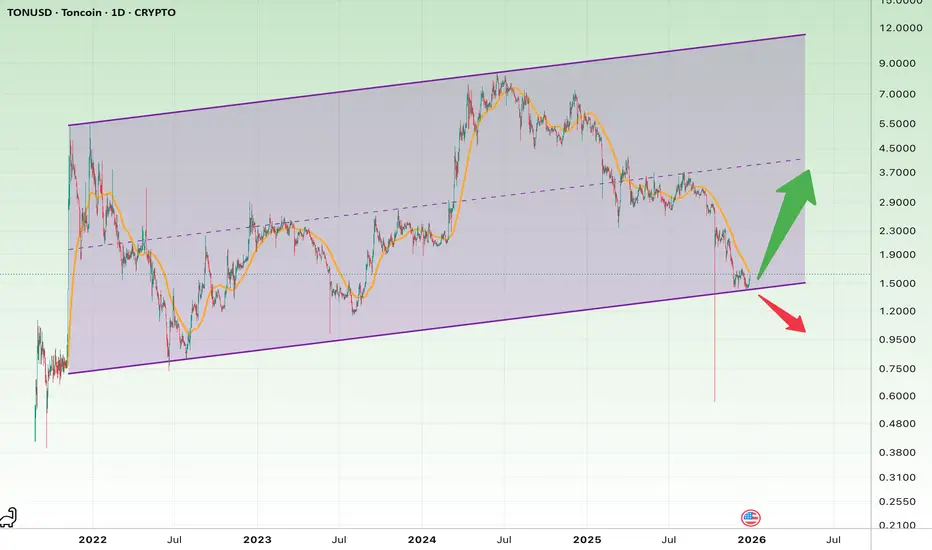
TON at a Major Long-Term SupportOverall Market Structure
• TON is trading inside a long-term ascending channel
• Price is currently sitting right at the lower boundary of this channel
• This zone represents a high-importance decision area from a technical perspective
Short-Term Scenario (Trading View)
Bullish Short-Term Scenario
• Price reaction at the lower channel support
• High probability of a technical rebound after heavy selling pressure
• Suitable for short-term swing trades
Logical entry zone:
• $1.50 – $1.65
Short-term stop-loss:
• $1.38
• A confirmed breakdown below this level invalidates the setup
Short-term targets:
• First target: $1.95
• Second target: $2.30
• Extended target (strong momentum): $2.80
📌 Risk-to-reward is attractive, but the scenario depends entirely on holding channel support.
Bearish Short-Term Scenario
• A confirmed breakdown below the channel
• Increased downside momentum and liquidation pressure
Downside targets:
• $1.20
• $0.95
• Critical support zone: $0.75
Mid- to Long-Term Scenario (Investment View)
Bullish Long-Term Outlook
• As long as price remains inside the ascending channel, the bullish market structure remains intact
• The current zone represents a strong long-term accumulation area
Long-term stop-loss:
• $1.10 (weekly close below this level = exit signal)
Long-term targets:
• Conservative target: $3.50
• Mid-cycle target: $5.00
• Full bull-market target: $7.00 – $9.00
📌 Achieving higher targets requires:
• Increasing volume
• A favorable broader crypto market
• Positive ecosystem developments
Fundamental Overview (Brief)
• TON is the native blockchain of the Telegram ecosystem
• Potential access to hundreds of millions of Telegram users is a major strategic advantage
• Key focus areas:
• In-app payments
• Telegram Mini Apps
• Web3 integration inside Telegram
• Main risks:
• Heavy dependency on Telegram’s strategic decisions
• Strong competition from L2 networks and high-performance blockchains
Fundamental takeaway:
TON has strong long-term growth potential, but remains a high-volatility asset, making risk management essential.
Final Summary
• TON is at one of its most critical technical levels
• Short-term: high-quality bounce opportunity with defined risk
• Long-term: suitable for gradual accumulation, not all-in entries
• A breakdown below channel support would invalidate the bullish thesis
BHEL Technical Outlook: Volatility Compression Signals Breakout Bharat Heavy Electricals Limited (BHEL) is currently in a high-probability consolidation phase after a strong prior uptrend, with price action compressing into a tightening range.
The weekly chart shows an ascending triangle, highlighting persistent accumulation through higher lows while supply caps the upside—typically a continuation pattern in a bullish structure.
Price remains comfortably above long-term moving averages, reinforcing medium- to long-term trend strength and downside protection.
On the daily timeframe, a Bollinger Band squeeze is visible, signalling volatility contraction and increasing odds of an impulsive move.
RSI in the mid-50s to low-60s reflects healthy momentum without overbought conditions, allowing room for expansion.
MACD downside momentum is fading, with histogram flattening—often an early sign of trend resumption.
₹270–272 acts as a strong demand zone, while ₹290–295 is the key breakout trigger.
A decisive close above ₹290 with volume could unlock an upside move toward ₹310–325, while a break below ₹270 would extend consolidation.
Bottom line:
BHEL is coiling within a bullish structure, with volatility compression setting the stage for a directional breakout. The trend remains constructive, and the next move is likely to be sharp once price escapes the current range.

KSBP Perfect setupPerfect bullish setup formed here.
Weekly closing just above MA50 on weekly timeframe, retracement till golden ratio (Fib 0.618) from recent high.
Next level can be the recent high.
This is my personal opinion, not a buy / sell call.

Prebreakout buildup at an 18-Year range resistance on KTKBANKMy approach to this setup follows a 3-step top-down filter. I use Stan Weinstein’s "Forest to the Trees" framework to check for macro tailwinds, Stage Analysis of the stock for big-picture placement, and look at price action for near-term structure - is it primed for a breakout?
Step 1: The "Forest to the Trees" Filter (Are there tailwinds?)
Before looking at the stock, we must verify that the "Forest" is healthy.
The Forest - NSE:NIFTY : The index is coiling just under record highs (~26,300). Stage Analysis-wise, it appears on the cusp of a Stage 1 to Stage 2 breakout.
The Trees - NSE:NIFTYPVTBANK : A clear relative strength leader. The index is in a confirmed Stage 2 uptrend and is consolidating tightly at its range highs.
Conclusion: The macro environment is providing a green light for long positions.
Step 2: Big Picture Placement (Weinstein Stage Analysis)
We zoom out to see the stock's multi-year lifecycle (monthly timeframe in this case gives the cleanest view)
The Multi-Decade Base: KTKBANK has been in a massive Stage 1 accumulation base since roughly 2006 - never pushing above its 195-200 resistance till 2023
The 2023 Attempt: The stock rallied into the 18-year range highs but was rejected. Crucially, it lacked the "buildup" necessary to overcome nearly two decades of overhead supply.
Current State: After coiling at resistance for all of 2024 and 2025, the stock finally looks ready to break out of this roughly 2-decade long range transition into a Stage 2 Advance.
Step 3: Near-Term Structure & Signal
Finally, we analyze the price action to see if conditions are ripe for a breakout sooner rather than later.
The Buildup: We have a high-quality 2-year tight flag right under the ₹195-200 ceiling. This "buildup" indicates that institutional buying is absorbing the remaining supply.
The Correction End: The double bottom formed in March and September 2025 signaled that sellers are probably exhausted.
The Momentum Signal: November 2025 delivered a major bullish candle, breaking above the 20-Month EMA and the key ₹195 level on the highest monthly volume of the year. This is an important signal!
And then...a pause: December has remained tight, holding above the 20M EMA and the key 195 level. This kind of a quiet pause after a green month is usually bullish.
The Fundamental "Rerating" Thesis
I believe technicals usually lead the fundamentals in most cases. Here, we see a massive Value Gap:
Deep Discount: The bank's Book Value is ~₹333, yet it still trades at a lowly 0.65x P/B.
Asset Quality: This is a clean bank now. Net NPAs have fallen to 1.35%, and the bank maintains a very strong CAR of ~20.8%.
Target: A conservative rerate to a 1.0x Price-to-Book puts the target naturally at ₹330+.
The Gist: A market entering a Stage 2 uptrend, a leading sector, and an 18-year breakout with a perfect prebreakout buildup. This is a prime candidate for a multi-month advance.
Timeframe: Monthly. Patience is required!

gravestone after a strong uptrend gravestone in past week, as long as its below past week high, a shortsell candidate with that stop into consideration.

ALUMINIUM trend may push it towards ATH the script is trading less than 10% away from ATH .
7 Days healthy consolidation already took place
the stock is trading with healthy volumes .
hindalco too trading healthy

TQQQ Regime ThrottleOverview
Rule-based risk expression for QQQ/TQQQ with explicit action prompts. The panel translates a 100/200-day SMA regime on QQQ into what to actually hold and how big to size, so you’re not guessing in real time.
TL;DR
This Idea pairs a simple 100/200-day SMA regime on QQQ with a volatility gate and a TrendScore so the panel explicitly tells you how to express risk: Express: TQQQ (use leverage and stay in TQQQ while this hint persists, subject to trims), Express: QQQ (stay unlevered), or Express: Cash (flat). It also suggests a sleeve size for TQQQ when enabled.
What’s different vs a plain MA system
Express hint : turns the regime into an action—TQQQ vs QQQ vs Cash. “Express: TQQQ” means be long TQQQ until the hint changes per rules (or your trims hit). Volatility gate : AnnVol and ATR% thresholds must be met to enable TQQQ; if not, you remain in QQQ or Cash even if GREEN. TrendScore → size : converts trend quality into a suggested sleeve %, capped to your risk budget. Dynamic guardrails : optional buffer around the 200D and extra confirmations at higher vol to curb whipsaws.
How colors are determined
GREEN = Close > 100D and 100D > 200D. YELLOW = Close > 200D and 100D ≤ 200D. RED = Close < 200D.
How to read the panel
RISK: GREEN/YELLOW/RED per the MA regime on QQQ daily (signal updates on daily closes). Confirm | Band : daily closes required to change color; the small ±% buffer applied to the 200D when vol rises (set to zero to mimic a plain 200D test). AnnVol | ATR% : realized vol and ATR as % of price used by the gate. TrendScore (0–1) : higher = stronger, cleaner trend. Express: what to hold— TQQQ if regime is risk-on and vol is tame; QQQ if regime is risk-on but vol is hot or trend is marginal; Cash if risk-off. “Express: TQQQ” = stay in TQQQ until the hint changes or your trims fire. Suggested sleeve : size guidance for TQQQ when enabled (TrendScore × vol scaling, then capped).
Playbook (discipline)
Decide at the daily close ; execute at the next open . If GREEN + Express: TQQQ → allocate up to Suggested sleeve (respect your cap). If GREEN + Express: QQQ → stay unlevered until vol cools or TrendScore improves. If YELLOW → light risk (half base sleeve; panel still gates leverage). If RED → flat/cash. Trim rule: if sleeve value > target × 1.25, rebalance back to target.
Inputs you can tune
MA lengths (100/200) and confirmations. Vol lookback, ATR length, Max AnnVol, Max ATR% (stricter = less TQQQ). Base sleeves for GREEN/YELLOW and an overall cap. Dynamic band/confirm multipliers (raise to reduce flip-flops). Signal source: QQQ by default; can follow your chart symbol.
Notes
Signal is computed on QQQ daily via security() and only locks at the daily close. The panel is an indicator , not an order system—use it to standardize decisions and sizing. Leveraged ETFs amplify gains and losses; backtest and size prudently.
Disclaimer
Educational only. Not investment advice.

NVIDIA – When the Same Setup Appears Twice!NVDA - CURRENT PRICE : 188.61
NVDA – Technical BUY Call 📈
Price previously rallied steadily after breaking a minor downtrend line (refer orange circle).
Similar technical setup is forming again, suggesting a potential repeat of the prior upswing.
In both occurrences, price stayed above EMA50 , confirming the broader bullish trend remains intact.
RSI remains in bullish territory (>50) and is not overbought, indicating healthy momentum with further upside potential.
No major distribution signal observed, pullback appears corrective rather than trend-reversing.
Notes : According to Moomoo, broker house targets range from USD 200 (lowest) to USD 352 (highest), with an average target of USD 260.
ENTRY PRICE : 186.00 - 188.61
FIRST TARGET : 206.00
SECOND TARGET : 224.00
SUPPORT : 170.00

DOGE at a Critical CrossroadDogecoin has been moving within a mid-term ascending trend, clearly marked by the purple trendline on the chart. However, price has now decisively broken below this trendline and is consolidating under it, which is a major technical warning signal.
Key technical implications:
• The structure of higher lows has been invalidated
• Price is trading below short-term moving averages
• Bearish momentum has increased following the trendline break
The black dashed line around 0.048 – 0.05 USD represents a very strong historical support zone, where price has previously reacted aggressively.
Short-Term Outlook
Bias: Bearish / corrective
In the short term, the price action looks more like a breakdown followed by continuation, rather than a healthy consolidation.
• Nearest resistance: 0.14 – 0.15 USD
• As long as price remains below this zone, selling pressure is expected to dominate
Probable scenario:
Continuation to the downside with temporary relief bounces.
Short-term targets:
• First target: around 0.105 USD
• Second target (if selling pressure increases): 0.085 USD
Short-term stop-loss:
• Daily close above 0.155 USD
(This would indicate a reclaim of the broken trendline)
Mid- to Long-Term Outlook
Bias: Deep correction within a larger macro structure
If DOGE fails to hold the 0.085–0.10 USD region, the chart opens a clear path toward the major support zone at 0.048 – 0.05 USD.
This area aligns with long-term historical lows and major liquidity pools, making it a potential accumulation zone rather than a chase-buy area.
Long-term upside targets (after a confirmed rebound):
• First target: 0.10 USD
• Second target: 0.16 USD
• Third target (strong meme-coin cycle): 0.22 – 0.25 USD
Long-term stop-loss:
• Daily and weekly close below 0.045 USD
(This would fully invalidate the long-term structure)
Technical Summary in One View
• Break of ascending trendline = major warning
• Short-term momentum remains bearish
• Long-term focus is on the 0.05 USD decision zone
Fundamental Overview (Brief)
From a fundamental perspective, Dogecoin remains:
• Inflationary, with no fixed supply cap
• Highly dependent on market sentiment, meme-coin cycles, and social/media influence
• Strongly affected by overall crypto market conditions and figures like Elon Musk
Strengths:
• Very strong and loyal community
• High liquidity
• Explosive upside potential during bull markets
Weaknesses:
• Limited real-world utility compared to major Layer-1 projects
• Tends to underperform sharply in prolonged bear markets
Final Verdict
DOGE is not in a low-risk buy zone right now.
Patience is key—either wait for a clear bullish confirmation, or monitor deeper supports such as 0.05 USD for higher-probability long-term entries.
If you want, I can also convert this analysis into:
• A precise trading plan (long/short)
• Or a professional YouTube script tailored for your channel

GBPJPY H4 - Potential Short Setup FormingGBPJPY has reached a completed upside expansion objective (XOP) on the H4 chart, where bullish continuation has stalled. Following the objective completion, price action has begun to shift from acceleration to reaction.
Directional behavior has weakened: price has broken below the 3×3 Displaced Moving Average and failed to reclaim it, forming a Double RePo pattern. This confirms downside directional pressure rather than a temporary pause.
Several DiNapoli Confluence Zones are located below the current price and will be closely monitored as potential areas of future market interaction. These levels are not entry signals but zones where further structure and confirmation may develop. However, those willing to take a short-term short trade can consider these zones as their exit points.

Healthy Pullback or Trend Reversal?Bullish Scenario (Primary)
• Strong uptrend structure
• Sharp impulse move followed by bullish consolidation (triangle)
• Pullback is constructive, not trend-breaking
• Price holding above 50-day SMA
📍 Entry Zone:
• $225 – $230
🛑 Stop Loss:
• $212
• Daily close below invalidates bullish setup
🎯 Targets:
• Target 1: $245
• Target 2: $255
• Extension: $270
Bearish / Risk Scenario
• Breakdown below $212 → deeper correction
• Next support zone: $200 – $195
• Prefer staying sidelined if breakdown occurs
Short Fundamental View
• AbbVie has a robust pharmaceutical portfolio
• Successful transition away from Humira dependency
• Strong free cash flow + attractive dividend
• Defensive stock with solid long-term outlook
• Fundamentally supportive of medium-term bullish continuation

ADBE // Inverse head and shoulders formationThe chart shows an inverse head and shoulders pattern, but the formation condition is to look for closing prices above the yellow line. If this condition is met, the first target is 380.43 which corresponds to the Fibonacci 1.414 level of the breakout. If we see closing prices above this level, the main target is 419,09.

INTA NASDAQ:INTA
INTA has made a formation of RECTANGLE with RSI supporting ABOVE 60 along with MACD cross.
Once price closes above $47.55 we can expect price upto $59. We can trail stop loss at $41.3.
which is showing risk to reward is 1:2.
Analysis is made to best of my knowledge, if you are taking trade please make your own analysis . Thank you

READY TECH HOLDINGS LTDREADY TECH HOLDINGS LTD made double with divergence along MACD cross over and RSI UPTICK. We can go long with first target of $2.77 and Final target of $3.5 in short tern view.
We can seen minor support level at $2.9.
PLease make your own analysis before taking any trade. ASX:RDY

Coty | COTY | Long at $3.00NYSE:COTY , one of the world's largest beauty companies, is known for its extensive portfolio of fragrances, cosmetics, skincare, and body care brands, such as:
Adidas
Bourjois
Bozzano
Bruno Banani
Burberry
Calvin Klein
Cenoura & Bronze
Chloé
CoverGirl
David Beckham
Davidoff
Escada
Etro
Gabriela Sabatini
Gucci
Hugo Boss
Infiniment Coty Paris
Jawhara
Jil Sander
Joop!
Jovan
Kylie Cosmetics
Kylie Skin
Lancaster
Leger by Lena Gercke
Manhattan
Marc Jacobs
Marni
Max Factor
Mexx
Miss Sporty
Monange
Nautica
Orveda
Paixao
Philosophy
Rimmel
Risqué
Sally Hansen
Swarovski
Tiffany & Co.
Vera Wang
Technical Analysis
Price double bounced off the top level of my selected historical "crash" simple moving average band. While the price may dip further to touch the lower end of this band (low $2 zone), this band is typically where share accumulation begins before a price reversal. The price may trade sideways for some time or jettison up, but my long-term outlook will simply require patience. Growth projections are modest and hinge on the company's successful execution of strategic restructuring and turnaround plans, delivery on new product launches and growth initiatives, and leadership stability / clear catalysts. Thus, at $3.00, NYSE:COTY is in a personal buy zone and not recommended for the risk averse.
Targets into 2028
$3.50 (+16.7%)
$4.70 (+56.7%)

Put Sale on TSLLIm closing this Put Sale today, seems like I wont get PUT shares. Using cash for another trade.
