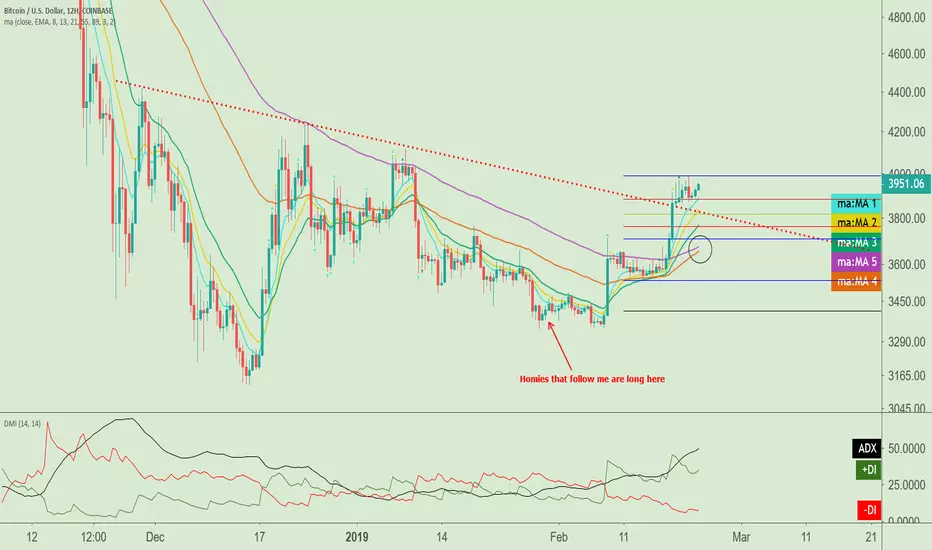
Movingaveragecrossover

Pending Fibo EMA crossover should bring next lift in $BTCI am staying long, the opportunity looks great.
Internal momentum still favoring the bulls.. finding trend could hurt right now.
Thoughts?
Bitcoin Daily Update (day 251)I believe that it is possible to beat the market through a consistent and unemotional approach. This is primarily achieved through preparing instead of reacting. Click here to learn more about how I use the indicators below and Click here to get my complete trading strategy! Please be advised that I swing trade and will often hold onto a position for > 1 month. What you do with your $ is your business, what I do with my $ is my business.
My recent Bitcoin Bubble Comparison - 3 Day Chart led to the following calls: < $5,750 by 11/15/2018 & my prediction for the bottom is $2,718 by 1/20/19 | My Bitcoin Bubble Comparison - Monthly Chart closely mirrored my price and time targets | Calling for $35 ETH before the end of 2018.
Previous analysis /position: “The price of Bitcoin' is currently at a very crucial crossroads. Can it find support above $6,350 and go on to create a higher high? I remain confident that won’t happen, mainly due to the volume.” / Short ETH:USD from $208.45 and short BTC from $6,354
Patterns: Back below bear trend line and looks like it will retest phase 2 of the hyperwave
Horizontal support and resistance: R: $6,371 (trendline retest) | S: $6,339 (bottom of the body from today’s candle)
BTCUSDSHORTS: At support with reversal dojis after the red 9
Funding Rates: Predicted to be 0.0379% in 7 hours, longs paying shorts (0.01% now)
Short term trend (3 day MA): Price below MA, with MA crossing medium and long MAs = full entry signaled
Medium term trend (8 day MA): Still above long MA, watch for it to follow with a bearish cross to provide confirmation
Long term trend ( 34 day MA): Should act as strong resistance
Overall trend: Bearish with full entry signaled
Volume: Selling volume from today and yesterday exceed buying volume on breakout
FIB’s: Using Oct 15th candle) 0.382 = $6,559 | 0.5 = $6,483 | 0.618 = $6,405
Candlestick analysis: Bottom of today’s body is currently support. Watch for price to violate that at any time to confirm continuation of move
Ichimoku Cloud: 4h cloud has thinned out but is also showing resistance at the trend line
TD’ Sequential: Today closed a red 2 below a red 1 and the current candle is a red 3.
Visible Range: Looking back to last November the high volume node is 2X all other nodes and sits at $6,154 - $6,789.
Price action: 24h: -1.57% | 2w: -0.74% | 1m: -3.54%
Bollinger Bands: Bottom band is in line with phase 2 trendline
Trendline: Back below bear trend and testing it for resistance. Expecting phase 2 hyperwave to get retested
Daily Trend: Bearish
Fractals: Up: $6,564 | Down: $6,207
RSI: Back in bearish territory below 50
Stochastic: Daily sell signal did a great job
Summary: Bitcoin' is back below the bear trend line after breaking out on low volume and selling off on higher volume. BTCUSDSHORTS are at support and coming off a recent red 9. Funding rates are getting very expensive for longs on Bitmex, projected in 8 hours is 0.0387% while the most common in 0.01%. Consensio signaled a full entry with today's close based on my guidelines of price < all MA's and 3 crossing 8 and 30. Today was also a daily red 2 below a red 1. The green trendline is how I am drawing my phase 2 line and I think the action outlined above puts it in serious danger of breaking down. The 1 hour chart is approaching the long MA which is angled down sharply while price retests trendline for resistance.
I have scaled into large short positions on BTC’. Funnily enough this is the first time in 2018 that I can remember ETH’ being in a strong position technically that BTC’. ETH’ is still above it’s medium term MA and has not seen the short may making any bearish crossovers as of yet. I do not take this to mean that ETH’ will have stronger support over the coming days and I strongly expect it will continue to fall harder and faster than BTC’ (if we do breakdown). I think this is simply due to over exuberance in alts during the last week. As BTC’ was rallying the alts were rallying harder.
I actually take this as another sign that this isn’t the bottom. When alts found their last bottom it was when BTC’ was rallying hard and people were FOMOing out of alts and into BTC’. Alts continued to crash for weeks (months?) while BTC was making all time highs.
Therefore I have scaled into a small ETH’ short with intentions to add when the MA crossovers signal entries.

EURUSD Short opportunityConfirmed divergence for MACD and RSI - showing a reversal
MA (100) and MA (50) are crossing = signal for sale
target is 1.5400 as a strong support level

BTC 30/50 Day Moving Average Cross TradeBetting on a continuation of this pattern I have observed. At the 30/50 Day MA cross price seems to be consistently at around 38.2 % (0.382 fib level) of the projected down-swing.
I have a time frame target of 6/Sept/2018. The current mean time period between downswings is sitting at 75 days. I have calculated this using the previous 7 downswings (significant because this was when BTC broke out above it's prior 2013 high of $1100)
I decided to get a jump on the cross and enter a few days ago because price action is looking very bearflaggy.
Entry: $6600, Stop: $7100 (comfortably above the 50 Day MA) and Target: $5000. R/R: 3.2

Xrp/Usd LongJust formed a double bottom on the 15m time frame. This is a trend continuation trade in which this is just shy of a 50% retracement from its recent High on Positive Crypto News. Looking for a retest of the most recent high. Stops are below the Double bottom which is also prior Resistance which is now acting as Support.

Get Your Orders Set, The Next Move Will Be A Big One!Previous analysis /position: No trade zone from $400 - $512. If it breaks $512 then I expect it to rally to $680. Setting a stop entry at $516 would be a high probably long. If it breaks down below $400 then I would expect a move to $275 - $300. Set stop entry to short $394.
Patterns: Triangle
Horizontal support and resistance: Strong R: $500 Weak S: $467 Strong S: $400
Long Short Ratio: 70% Long 30% Short
Funding Rates: 0% shorts 0.01% longs according to datamish
12 & 26 EMA’s (calculate % difference): 12:+1.49% 26: +1.77% Posturing for a bullish cross.
50 & 128 MA’s: 50: -0.84% 128: -14.07% | 50 acting as strong resistance. If that is broken a retest of the 128 seems likely.
FIB’s: 0.236 = $368.90 0.382 = $571.35
Candlestick analysis: Weekly inverted hammer/dragonfly
Ichimoku Cloud: Weekly cloud is flat at $721 where the 0.5 FIB is. A breakout of the triangle would re enter the cloud. The top of it is currently in line with the 0.382 FIB (see above). 4h cloud has been acting as support, as has the 1h.
TD’ Sequential: Green 2 on the weekly. If it breaks $515 before Sunday that would provide an entry. Green 2 closed above a green 1 on the daily. If the 3 breaks $485 on high volume that would seem like a good entry in combination with the triangle break.
Visible Range: Largest volume profile in the last 24 hours is $470 | $466 over the last 5 days and 1 month | $451 over the past 6 months | $300 over the past year with $451 being the runner up. A breakdown of $435 - $451 would be very significant.
Bollinger Bands: Above MA on daily, below on weekly. Daily is getting tight and the volume is coming down, confirming my belief that the next move will be a big one.
Trendline: Hyperwave line has ten points of contact (that I count). If it breaks down with conviction it would be a high probability short.
Daily Trend: Chop
Fractals: UP = $515 DOWN = $439
On Balance Volume: In the same triangle on the daily. Sneaky bearish div' on the weekly.
Chaikin Money Flow: Looks good on the weekly. Testing 0.05 on the daily.
Buy/Sell Sentiment on Trading View:
RSI: 50 on the daily. 45 on the weekly. No div’s to speak of.
Stoch: Weekly looks like it should give a buy signal soon. Daily just re crossed at 40.
Conclusion: Have had an order set since the 20th to short the breakdown and I’m ready to do the same if we break to the upside. Stop order is set to buy as $517. If I am at my computer and we break $488 with conviction then I will start entering earlier. I also have an order to short $394. Each order is for 50% of my desired position because I very rarely like entering all at once. I will be watching closely for a breakdown of $439 on high volume and that would cause me to enter earlier. Profit target would be $650 for a long and $300 for a short.

Bitcoin Cash [BCC] looking to continue to the short sideBCC Still Continues To Seem Bearish.
1) Moving Averages are about to cross Bullish and price action is underneath the MA trend lines.
2) Formed a Head & Shoulders pattern and the pattern confirmed. Expected Target for this is $684.
3) A long term trend line was drawn from the start of Nov 2017 until today. This trend line lies right above the Short Target from the H&S. Price could bounce off of this (approximately $789 ) as support or either bounce from the H&S target. I listed the difference from Target 1 and Target 2 which is about a 12.5% difference in price.
4) We are currently forming a downward channel if zoomed in to our current price region.
What do you think?
Add me on Twitter and let me know! @KennyDegu

AUD/USD Long
MA Cross
Higher High Forming
Broke Trendline
The opportunity to re-enter this trade will come soon :) I will let you know !


Easy coin to trade, how to, DOGE - use 2 moving average
- set the MA regarding your sensibility
- wait for crossing
PS: I added fib. time, it is seems to work (but june 2017 pump is missing....)

LONG GBPUSD Outlook and Projection Top Down Analysis1 minute ago
This is my first post and I will like everyone reading it to maintain an open mind as I will be analysing the GBPUSD 0.03% chart based on current price action. Later I will discuss my trading strategy (and a bit about my 11years trading background) which should be easy to follow and do not hesitate to ask questions in case you felt I left certain explanation or you are particularly lost.
The Sterling has been performing better than it's US Dollar 0.01% counterparty as of 9th August 2017 from October 2016 and it will be worthy to note some significant development to shape my decision making in the next coming weeks.
As of today 9th August 2017 I will discuss a top down analysis approach starting with a weekly chart.
There are are couple of fundamentals data coming out of US and UK,this data such as :
CPI 0.18% in the 2 region
Retail Sales
University of Michigan Consumer Confidence data
All these data in the fundamentals can have some impact in the move we can see in the GBPUSD 0.03% going to next week.
1.From my Technical Perspective,there has been a Weekly 12EMA crossover the 36EMA to the upside. I read this as a potential signal of trend change in the making and I will add some other indicative reasons to this to maintain a bias in the move I will be expecting over the coming week. Bear in mind I will always maintain Long,Short or Neutral Zone indication as price develops.
2.Before that Weekly Crossover to buttress or add to confluence of indications that I will be considering will be the Market failure.Market failure is an indication that price has failed to make a new lower low and this higher low is formed at 1.19873. If we trade below 1.19873 that new trend that is potentially forming has been reset and new reference will be the Real low.
3.A new High @1.3048 formed after the Initial High @ 1.2775/95 has confirmed the beginning of new trend. A new higher low will be followup @1.2639
4.A 2nd Higher High was formed recently @ 1.3268 to further consolidate my current long bias.At this high we hit our longer term down/resistance trendline @ the 8th point.This zone is a Huge Significant zone that can send the price of GBPUSD 0.03% Technically to a new lower low below 1.16496 potential to a new bearish target. And that is why the UK Manufacturing Production Data that is expected tomorrow can be of a directional biased in the currrent price action of GBPUSD 0.03% .The last data came out @ -0.2% and the previous 4 also came out missing expectation at negative numbers. Having 2 quarters of negative data released which tomorrow one is anticipated positive can send GBPUSD 0.03% rate down potentially a 6 months of negative fundamental data is classified as recession.Although technically price are looking strong at the back negative Dollar we are seeing currently in the market.
5.A new higher low is the expectation and thus I will be building my Longs around Support Zone:
1.29328- 3 Week Low
1.2945- Weekly 12 EMA as Support bounce
1.2989- 2 Week Low
FOR DAY TRADING STRATEGY(Next 2-4days) Long Setup if the day close as a potential Doji
The strategy will be I will split whatever 2% of my account capital is into 3 and take 3 different position at 3 different prices above.
STOP LOSS will be managed around 1.2785
Targets will be looked for around d zones of 1.3050/100 Initially.
SHORT SETUP Scenario
BUT for a weekly Short Continuation should in case the data came in Negative for Sterling on a huge level tomorrow.
Any close below Monday Low 1.2952 can resume the further Shorts coming into the Sterling against the Dollar to target a huge Support Trendline and 200EMA @ 1.2967 area towards Brexit low @ 1.2795 zone.
As of the current moment when am publishing this outlook the GBPUSD 0.03% is looking a bit positive of about 0.1% and 14 pips daily range positive and for as long as we are above 1.2965 Monthly and 1.2988 Weekly Support area the bias is looking positive into some important fundamental d
