GER SELLLow probability high risk sells. Risk reasonably. Price is coming from an Imbalance after sweeping liq so sells is low probability for now.
Multiple Time Frame Analysis

EURJPY 2nd entry setup.Following overall bearish bias on this pair. Break and retest of structure.
Manage risk well if interested

Ethereum classic - An elder resident of God’s waiting roomAn opening statement: The idea is not restricted to Ethereum Classic (ETC), many legacy tokens are showing the same sequence of events as highlighted in the chart above. The recent update to the OTHERS total idea identifies a few.
Story so far
The Crypto gambling mania of older tokens continues to entice many. Market participants were told financial armageddon is around the corner, prepare now. A corner that turned out to be a roundabout, an endless road to nowhere with changing views. “ETF is coming Ww!” “Trump will approve new Crypto fund blah blah”, the inbox is filled with such messaging. The project fundamentals are now irrelevant, it seems, as folks hope and pray for a greater fool to come along and release them from the stress of holding dead weight. But what if the crypto fool supply is drying up? Then what?
The technical warning
The above 8 chart of Ethereum classic is typical of many legacy tokens. Like stone skipping. That is, you throw this little flat stone across the pond and at first it’s amazing, it’s like, boing! boing! boing! You feel like a physics genius. However what’s actually happening, properly, scientifically, is the stone’s cheating gravity for a bit. It hits the water at just the right angle, makes this tiny lift like a miniature water trampoline. But every time it hits, it loses a bit of energy. Bit of speed, bit of spin, bit of dignity. Eventually it’s like, ‘Nah, I’m done,’ and just plops in. That’s it. It’s run out of the stuff that keeps it skipping. It’s the same as me after two beers trying to dance, starts strong lots of energy, then gravity wins. Straight down. Splash..
Sentiment
No shortage of long ideas on the platform.
. To be a contrarian is to look the other direction when everyone else says the same thing. Not easy, but imperative.
Like many legacy charts, the Bitcoin pairs exhibit broken market structures. ETC.btc chart, broken market structure
Conclusions
There’s no polite way to say this, Ethereum Classic, like many of its legacy peers is running on fumes. Every bounce looks impressive until you zoom out and realise it’s just another stone skip on the surface of a dying pond. Each lower high is a polite reminder that gravity still works.
The chart doesn’t lie:
Momentum’s gone.
Liquidity’s gone.
Belief is on life support.
Price continues to cling to the same horizontal band it’s bounced off for half a decade, the so-called “water line where surface tension and angular momentum meet.”* Below it? Silence.
You’ll always find someone calling this “undervalued,” or “ready for a comeback.” But let’s be honest, that’s nostalgia speaking. What used to be innovation is now a museum exhibit, a relic from the days when everyone thought “blockchain” was going to save the world.
Sure, maybe there’s a pop left in it, one final gasp, a skip before the splash. But when it happens, don’t mistake physics for faith.
Eventually, every stone sinks.
Ww
============================================================
Disclaimer
This isn’t financial advice, obviously.
If you’re buying Ethereum Classic because someone on the internet said it might bounce, that’s not investing, that’s performance art. I don’t hold ETC, I don’t want to, and if it suddenly moon-shots I’ll still sleep fine.
Do your own research, manage your own risk, and please for your own sanity stop expecting miracles from assets that peaked during the Obama administration.
If it goes up, brilliant.
If it goes down, well… gravity wins again.

XAU/USD 03 December 2025 Intraday AnalysisH4 Analysis:
-> Swing: Bullish.
-> Internal: Bullish.
Analysis and bias remains the same as analysis dated 20 October 2025.
Price has printed as per previous intraday expectation by printing a bearish CHoCH which indicates, but not confirms, bullish pullback phase initiation.
Price is currently trading within an established internal range, however, I will continue to monitor price with regards to depth of pullback.
Intraday expectation:
Price to continue bearish, react at either discount of 50% internal EQ, or H4 supply zone before targeting weak internal high priced at 4,380.990.
Note:
The Federal Reserve’s sustained dovish stance, coupled with ongoing geopolitical uncertainties, is likely to prolong heightened volatility in the gold market. Given this elevated risk environment, traders should exercise caution and recalibrate risk management strategies to navigate potential price fluctuations effectively.
Additionally, gold pricing remains sensitive to broader macroeconomic developments, including policy decisions under President Trump. Shifts in geopolitical strategy and economic directives could further amplify uncertainty, contributing to market repricing dynamics.
H4 Chart:
M15 Analysis:
-> Swing: Bullish.
-> Internal: Bullish.
Analysis and bias remains the same as yesterday's analysis dated 02 December 2025.
Price has printed as per analysis dated 14 November 2025 where I mentioned price to trade down to either discount of 50% internal EQ, or M15 demand zone before targeting weak internal high, priced at 4,245.195.
Price subsequently printed a bearish CHoCH, however, as mentioned yesterday, I would closely monitor price with respect to depth of pullback.
Price did not pull back with any significance, therefore, I will apply discretion and not classify an iBOS. I have marked this with red dotted and dashed lines.
Price has since printed another bearish CHoCH.
We are currently trading within an established internal range, however, as per yesterday, I will continue to monitor price with respect to depth of pullback.
Intraday expectation:
Price to trade down to either discount of 50% internal EQ, or M15 demand zone before targeting weak internal high, priced at 4,264.700.
Note:
Gold remains highly volatile amid the Federal Reserve's continued dovish stance, persistent and escalating geopolitical uncertainties. Traders should implement robust risk management strategies and remain vigilant, as price swings may become more pronounced in this elevated volatility environment.
Additionally, President Trump’s tariff announcements, particularly against China, are expected to further amplify market turbulence, potentially triggering sharp price fluctuations and whipsaws.
M15 Chart:

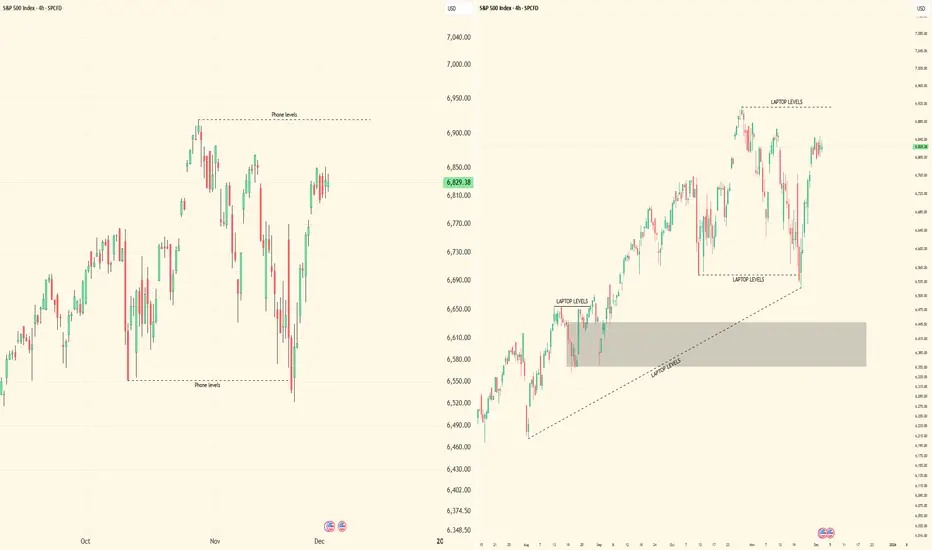
''iPhone vs Laptop Trading: The Truth Nobody Talks About''Alright, let’s get straight to it. I’ve been watching traders debate this forever — phone or laptop. Here’s my breakdown, from someone who actually trades multi-timeframe SMC setups, tracks liquidity, and executes in real-time.
⸻
1️⃣ Execution and Speed
• On a laptop, you’ve got full visibility: multiple monitors, larger charts, higher timeframe context, all indicators and order blocks at a glance.
• On iPhone? Limited view, smaller screen, harder to see context, and micro adjustments take longer.
• The reality: Speed matters. A 1-minute confirmation or lower-high break can happen fast. If you’re on a phone, you risk missing that critical move or entering late.
⸻
2️⃣ Multi-Timeframe Analysis
• Edge comes from analyzing multiple chart intervals to see the bigger picture and confirm setups.
• Laptop: Side-by-side charts, smooth workflow, all intervals visible at once.
• On the phone, switching between timeframes is clunky, slow, and mentally taxing. You’ll start guessing instead of confirming.
• Key takeaway: Serious traders of any style know: a laptop gives you the clarity, control, and precision that’s hard to achieve on a phone.
⸻
3️⃣ Precision of Orders
• Laptop: You can place precise limit entries, manage stop losses, and see where liquidity clusters are.
• Phone: Accidental taps, misclicks, or lag can cost you a trade. Especially when dealing with small spreads, tight stop losses, or micro entries.
• Lesson: Mistakes on micro orders aren’t small. They erode both capital and confidence.
⸻
4️⃣ Situational Use
• Phone trading isn’t useless. It’s fine for monitoring, tracking TPs, or checking alerts when you’re away from your desk.
• But if you’re entering, executing, or actively managing high-leverage trades — laptop wins hands down.
⸻
5️⃣ Psychology and Focus
• Laptop setups create a trading environment: focus, fewer distractions, full screen, proper charts.
• Phone trading often comes with notifications, background apps, and temptation to “glance and guess.”
• Your mindset matters as much as your setups. Treat trading like a full-time process, not a side hobby.
⸻
6️⃣ My Personal Take
• I’ve tested both. I’ll check charts on my phone sometimes — especially during quick monitoring sessions.
• But every serious execution, every multi-timeframe setup, every liquidity play — it happens on my laptop. That’s where precision, patience, and professionalism live.
⸻
🔥 Key Lessons
1. Phone = monitoring & alerts only.
2. Laptop = execution & analysis.
3. Edge isn’t just charts — it’s control, speed, and clarity.
4. You can’t shortcut this without costing yourself trades or your confidence.
⸻
💡 Visual Reference:
I posted screenshots to show the difference between iPhone and laptop trading setups. Laptop view is on the right side, showing full charts and multi-interval visibility. iPhone view is on the left side, compact and limited. This makes it clear why execution and workflow are easier on a laptop.
Bottom line: Don’t kid yourself. Your tools matter, but more importantly, how you use them separates amateurs from pros.
I’m curious — who’s still trying to trade full-time on a phone? Let’s see if they’re really ready to compete.
Bitcoin at the daily target: what comes after 93,092?This analysis is based on the Initiative Analysis (IA) method.
Hello traders and investors!
On the daily timeframe, Bitcoin has formed another confident buyer absorption — and this absorption was simultaneously a manipulation (a false breakout) of the 86,116 level.
Notably, the seller’s candle appeared with increased volume, and the subsequent absorption created a new buyer zone.
The buyer target within the current range — 93,092 — is almost reached.
Given the strength of buyer initiative, further movement toward 94,000 or even 97,000 cannot be ruled out.
However, once the price reaches 93,092, it is reasonable to expect seller initiative.
This is classic market behavior near a target: some buyers take profit while sellers get an opportunity to step in.
Wishing you profitable trades!

$PG $143.62 - MultiTimeFrame Trendline HoldDaily chart (1D): The trendline has been tested 6 times and has held each time, showing strong long-term support.
1-hour chart (1H): The trendline shows 7 touch points, reinforcing intraday strength.

USDCAD - Bearish BiasAnalyzing the previous candle on the D1 timeframe (Tuesday's candle), we can see we had a clear sweep of other previous D1 candle's high (Monday's candle).
Now after the sweep of Monday's high, we closed back inside Monday's candle range. So with that in mind, I'm anticipating, and confident enough that the next liquidity price is gonna draw to is Tuesday candle Low, and possibly if there's high volume, we wanna see previous Fridays Low also being takes.
And that alarms the bias for today (Wednesday).
That does not mean going on to your chart 📉 and putting your SELL order, but with careful analysis, we first anticipate price to pull back into a PDA, 1h Internal Range Liquidity (a FVG, a sweep into an old highs or testing and OB), only then we can be confident hunting for sells in alignment with the overall BIAS for today.
I'm Zak, and I'm starting a new journey in giving back the knowledge I've acquired in my 4 years trading experience.
So if you found this useful, please show me your support and I'll continue to do this everyday.
Much love trader 😊

Long trade Pair: AUDJPY
Mon 1st Dec 2025 – 2:45 PM
NY Session PM
🟦 Trade Details
Direction: Buyside
Entry: 102.270
Take Profit: 102.426 (+0.153%)
Stop Loss: 102.250 (0.020%)
Risk-to-Reward: 7.8R
🟩 Market Structure
Price formed a higher-low formation during the NY PM session.
Shift in structure occurred after: Displacement candle breaking above short-term swing highs
A micro-BOS on M5 confirming bullish orderflow. Continuation supported by EMA/WMA flipping upward and acting as dynamic support.
🟨 Liquidity Story
Pre-NY PM liquidity engineering took place below 102.20:
Multiple sell-side liquidity lows swept
Followed by aggressive bullish displacement
Target:
Buy-side inefficiencies above 102.30
Liquidity resting in the 102.33–102.36 zone
Model Type: Sell-side sweep → Displacement → Buy-side delivery.
5min TF overview
🟪 Fair Value Gaps & PD Arrays
Confluences supporting the long:
Bullish FVG created post-sweep provided mitigation level for entry
Demand pocket around 102.24–102.27 anchored the long
Price respected 200 WMA & 50 EMA as stacked support
Entry confirmed by FVG retest + premium/discount alignment (discount pricing).
🟥 Model / Entry Logic
Model used → ICT Bullish Reversal Model:
Sweep of sell-side liquidity
Displacement to confirm bullish intent
Retracement into FVG / Discount Zone
Entry at 102.270 using refined M5 structure
Targeting clean inefficiencies and resting buy-side liquidity
Tight SL (102.250) allowed for high RR (7.8R).
🟧 Session / Narrative
NY PM tends to continue earlier directional bias or complete the cycle from NY AM.
Market sentiment:
JPY weakened modestly into the NY PM window
AUDJPY aligned with risk-on flows
Volume increased as NY PM liquidity entered the market, validating bullish continuation.
🟫 Outcome
Trade in session:

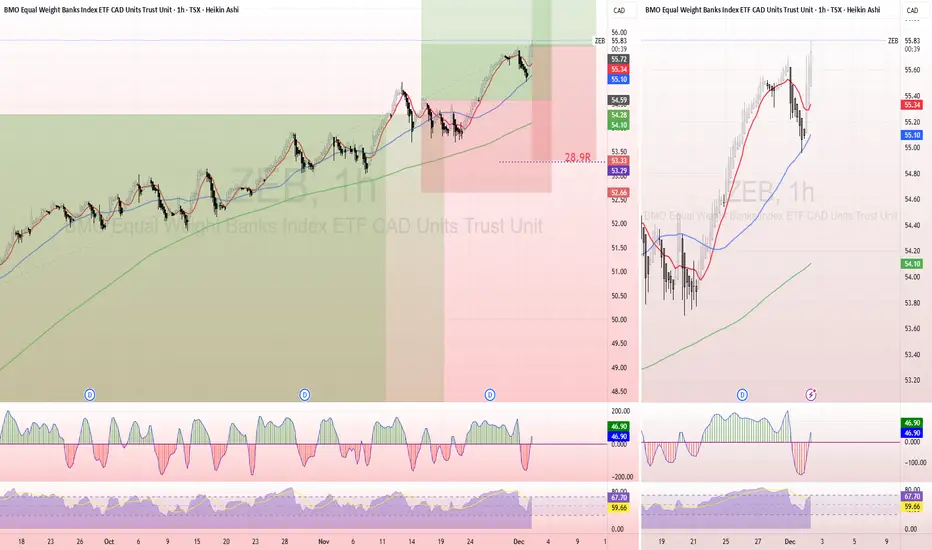
ZEB – Trend Structure Intact - 3rd Entry Following Strategy RuleRe-entered ZEB for the 3rd time as it rotated cleanly back into strength. Price respected the trend structure again- higher lows, higher highs- and reclaimed both the 20MA and 50MA on the 1h.
This entry follows my system rules exactly:
Trend confirmed (20MA > 50MA, both rising).
Pullback held structure inside the model’s “buy window.”
Heikin-Ashi flip back into momentum.
RSI + CCI reset without breaking the broader trend.
Risk stays constant by placing the stop below the structural invalidation.
This ETF doesn’t move fast, but it respects structure exceptionally well. I’m treating it as a slow, steady trend trade with compounding opportunity.
Trade Plan
Entry: Current reclaim of the trendline and MA cluster
Stop: Below the previous structural low (invalidates the setup)
Risk: Kept identical to prior entries 1% total account
If the trend continues, I’ll trail the stop behind Daily 50 MA and keep adding only when structure supports it.
Sticking to the plan > feelings.
#ZEB #TSX #Banks #ETF #TrendFollowing #HeikinAshi #RiskManagement

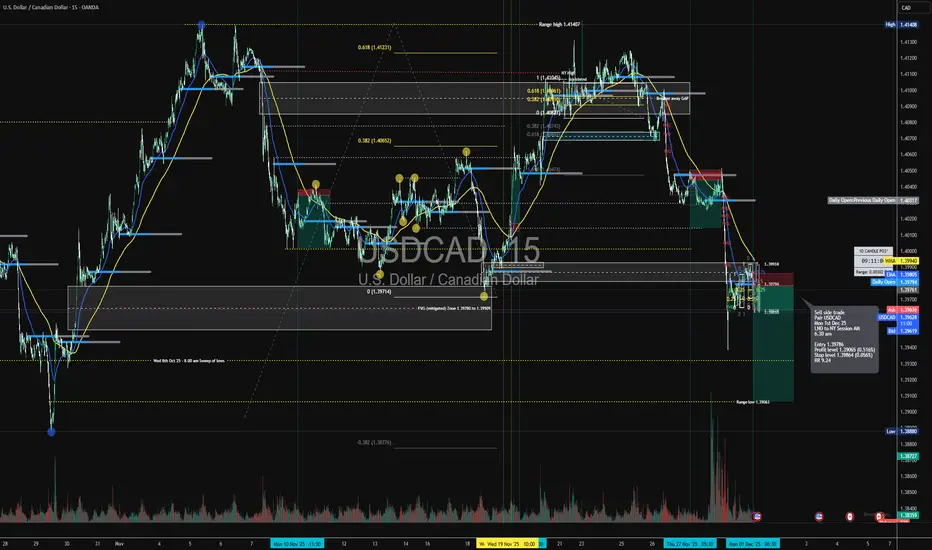
Short trade 📕 Sell-Side Trade
🟦 Trade Details
Pair: USDCAD
Date: Mon 1st Dec 2025
Session: LND to NY Session AM
Time: 6:30 AM
Model Type: Sell-Side Trade
🟥 Entry & Levels (Updated)
Entry: 1.39786
Profit Level (TP): 1.39065 (0.516%)
Stop Level (SL): 1.39864 (0.056%)
Risk-to-Reward (RR): 9.24
🟨 Trade Context
Price traded up into a premium HTF distribution zone, completing the retracement after the previous liquidity sweep. Market printed equal highs → sweep → rejection, confirming engineered liquidity. A clean MSS (Market Structure Shift) formed once price broke below the internal structure. The 1-minute chart aligned with the HTF 15-minute bearish displacement already underway. The Daily Open + WMA/EMA confluence acted as overhead resistance once price failed to reclaim it.
Timeframe: 1-minute (LTF execution inside HTF displacement)
🟨 The macro narrative shows a multi-day premium sweep of the range high at 1.4140, followed by heavy distribution. Price delivered a liquidity sweep above the internal high cluster (yellow circles), then rejected strongly. A key mitigated FVG zone at 1.39790 – 1.39930 aligned with the 0.382–0.618 Fibonacci retracement range. Displacement broke the bullish internal chain, giving a confirmed MSS → BOS into bearish order flow.
15min TF overview
🟪 Sentiment & Narrative
NY AM session typically fuels continuation of London’s directional intent — in this case sell-side pressure. USDCAD macro sentiment showed CAD strength supported by oil volatility + USD corrective flow. Persistent inefficiencies below act as magnets for a corrective re-pricing phase after the premium sweep.
🟫 Outcome
Trade in session
Trade logic:
Sweep → MSS → Displacement → FVG Entry → Continuation.
Short tradeSell-Side Trade
Pair: GBPAUD
Mon 2nd Dec 2025 — 8:30 AM
NY Session AM
🟥 Trade Details
Direction: Sell-side
Entry: 2.01331
Take Profit: 2.00827 (+0.25%)
Stop Loss: 2.01436 (0.52%)
Risk-to-Reward: 4.8R
🟧 Execution Context
NY AM open delivered premium distribution pricing
Clear liquidity grab (highlighted blue Fib zone 0.618 -0.328 & FVG)
above micro-swing before displacement
Bearish orderflow confirmed by:
Break of Structure (BOS) to downside
Displacement candle
Retest into bearish FVG + Order Block
Entry taken at optimal 0.75 (PDArray) retracement inside imbalance
🟦 Market Structure
M15 + M5 structure already bearish on the day
Lower highs across London into NY
Price broke: London low, Asia low & Internal liquidity taken →
for a continuation setup, HTF (H1) aligned with bearish flow
Compression pattern preceding the drop confirmed exhaustiveness
🟪 Liquidity Story
Pre-NY sweep of the liquidity low marked on chart
Price engineered buy-side liquidity for distribution
Orderflow transitioned to:
Sell-side targeting:
2.01131 (−0.618 level)
2.00827 (TP, external liquidity pocket)
Multiple FVGs stack above mark → clear rejection zones
🟩 Model Confirmation
SMC + ICT Model Alignment:
Liquidity grab → displacement → FVG → confirmation entry:
All PD arrays aligned:
Premium pricing
FVG
Bearish OB
Retracement into imbalance
RR 4.8
🟫 Narrative & Psychology
Market offered a counter-trend bounce trap
Retail longs positioned after the wick sweep
Smart money distributed into premium
We assume we are in the NY AM expansion phase
Strong conviction supported by consistent session behaviour
🟩 Outcome / Trade Status
Currently in progression / tracking toward sell-side targets
Strong follow-through momentum observed
Clean trend delivery expected into NY PM continuation

Long trade
Trade Journal — AUDNZD (Updated)
Buyside Trade — London Session AM
Mon 1st Dec 2025 — 5:00 AM
🔵 Trade Details
Pair: AUDNZD
Direction: Buyside
Date: 1st Dec 2025
Time: 5:00 AM
Session: London Session AM
🟩 Execution Block
Entry: 1.14546
Stop Loss: 1.14489 (0.05%)
Profit Target: 1.14935 (0.340%)
Risk–Reward Ratio: 6.82R
🟧 Model & Structure
Trade follows the internal structure shift seen after the sell-side liquidity sweep
Entry aligns with your 1-minute or 5-minute confirmation model
PD array sequence respected: SSL (Sell-side Liquidity Sweep) sweep → BOS (Break of Structure) → FVG/OB (Fair Value Gap/Order block) → retracement entry.
🟦 Bias & Higher-Timeframe Context
NZDUSD showing bullish recovery after multi-session selloff
H1 discount pricing respected ?
Price returns into a reactive demand block at 0.5715 ?
Daily open acts as a draw above ?
We assume the London expansion time window (7:00–9:30 AM) supports upside delivery ?
🟩 Outcome: Trade in session
Expect continuation toward 0.57500 once retracement is filled
Watch for reaction around daily open.

Long trade
Date: Mon 1st Dec 2025
Time: 7:40 PM
Session: Tokyo Session PM
Execution TF: 5-min
Bias: Sell-Side / Short
🟥 1. Trade Details
Pair: AUDJPY
Direction: Sell-Side Trade
Entry: 101.808
Take Profit: 101.279 (-0.43%)
Stop Loss: 102.278 (0.46%)
RR: 3.95R
🟦 2. Higher-Timeframe Context (Blue Tab — HTF Bias & Structure)
HTF Bias: Bearish → Retracement → Continuation
The 1H and 4H charts show:
Multiple failed attempts to break above the 102.40/102.50 macro level
HTF premium zone rejection (6.18 retracement + previous POI)
Series of lower highs forming beneath 102.30
Break of structure leading into a newly formed HTF discount imbalance
The overall context is a sell we observed a premium setup inside a bearish macro sequence.
Key HTF Levels:
102.49 high → external buyside liquidity
102.20 – 102.25 → bearish rejection block
101.28 – 101.30 → Sell-side liquidity target (TP)
🟨 4. Technical Breakdown
ICT Sell Side Model:
Model Sequence:
Liquidity Grab → Displacement → BOS → FVG Return → Short Entry
Confluences:
FVG + 0.25/0.5 fib level
Supply block rejection
Clear market structure shift
Tokyo Session PM timing (low volatility → Algorithmic clean move)
Risk tightly defined above rejection block at 102.27
Stop Logic:
SL placed above:
The 102.27 rejection block
The last internal high
Invalidates bearish structure if taken
TP Logic:
Take profit set at:
Sell-side liquidity at 101.28
1.272 fib extension
Previous session low cluster
🟩 5. Session Narrative
Tokyo PM Session Behaviour:
Clear sweep during session transition
Smooth distribution after premium mitigation
No opposing liquidity until session lows
🟫 6. Outcome: Trade in session

Long trade
🟩 1. Trade Details
Pair: USDJPY
Direction: Buyside Trade
Date: Mon 1st Dec 2025
Time: 10:00 AM
Session: NY Session AM
Execution TF: 15-min
Entry: 155.086
Take Profit: 155.774 (+0.39%)
Stop Loss: 155.037 (–0.03%)
Risk-to-Reward: RR = 8.54R
🟦 2. Higher-Timeframe Context
HTF Bias: Bullish → Bullish Continuation:
USDJPY has been in a macro uptrend, consistently printing higher highs on the 4H / Daily charts. Current retracement is shallow, indicating strong buyer aggression.
Key HTF Levels:
Daily bullish FVG at 155.00 → 155.40
Weekly liquidity above 156.50–157.00
Daily Open reclaim gave strong directional confirmation
Narrative:
Price delivered a corrective pullback into discount and formed a consolidation wedge before a sharp NY AM expansion → signalling the start of a new impulsive leg.
🟧 3. Liquidity - ICT model logic
1️⃣ Sell-Side Liquidity Raid
The lows at 155.014 were swept
Price dipped into a 0.618 retracement + internal liquidity pocket
2️⃣ Inducement Layer
Multiple equal lows created “fake support”
Retail positioned short on the breakdown
3️⃣ Displacement
Fast upside displacement candle at NY AM session open
Breaks micro structure and invalidates bearish order flow
4️⃣ Rebalance & Entry
Price returns to:
Discount zone
Bullish FVG (15m)
Bullish Order Block
EMA/WMA dynamic support
5️⃣ Buyside Liquidity Target
Liquidity above 155.760 (previous NY high) tapped
🟪 5. Market Sentiment & Session Narrative (Purple Tab)
Session Behaviour:
London session showed compression
NY session created high-volatility spike → indication of algorithmic shift
Liquidity engineered below the lows was used as fuel to power the expansion
Sentiment:
Retail bias was bearish due to breakdown under 155.30
HTF remained bullish? USD strength increasing due to macro drivers (Fed rate expectations narrative)
🟫 6. Outcome
Status: Trade in session

Long trade 📘 Trade Journal — AUDNZD (Updated)
Buyside Trade — London Session AM
Mon 1st Dec 2025 — 5:00 AM
🔵 Trade Details
Pair: AUDNZD
Direction: Buyside
Date: 1st Dec 2025
Time: 5:00 AM
Session: London Session AM
🟩 Execution Block
Entry: 1.14546
Stop Loss: 1.14489 (0.05%)
Profit Target: 1.14935 (0.340%)
Risk–Reward Ratio: 6.82R
🟧 Model & Structure
Trade follows the internal structure shift seen after the sell-side liquidity sweep
Entry Type: 1-minute
PD array sequence respected: SSL sweep (Sell-side Sweep) → BOS (Break of Structure) → FVG/OB (Fair Value Gap & order Block) → retracement entry
Clean displacement from the FVG triggered the continuation setup trade execution.
🟦 Bias & Higher-Timeframe Context
H1 shows exhaustion into previous delivery range
Clear sell-side liquidity failure at multi-session lows
Price retraced into the OB + FVG cluster near 1.1450 (mitigation)
We assume London AM session we continue with a expansion towards
the inefficiency overhead at 1.1493
🟩 Outcome / Trade in session
TP aligns with the 1-hour imbalance fill
Strong continuation expected once VWMA/EMA cross supports structure

EURNZD: Bullish After the News 🇪🇺🇳🇿
EURNZD formed an inverted head & shoulders pattern
on a key daily support cluster.
We see a bullish breakout of its neckline and a strong bullish momentim
after EU inflation data today.
Odds are high that the pair will rise at least to 2.0335 level.
❤️Please, support my work with like, thank you!❤️
I am part of Trade Nation's Influencer program and receive a monthly fee for using their TradingView charts in my analysis.

NZDUSD: Retracement Continues 🇳🇿🇺🇸
There is a high probability that NZDUSD will retrace more
from the underlined key daily resistance.
A double top pattern on a 4H and a formation of a bearish
imbalance candle with London session opening provide
strong confirmations.
Goal for sellers - 0.5709
❤️Please, support my work with like, thank you!❤️
I am part of Trade Nation's Influencer program and receive a monthly fee for using their TradingView charts in my analysis.

XAU/USD 02 December 2025 Intraday AnalysisH4 Chart:
-> Swing: Bullish.
-> Internal: Bullish.
Analysis and bias remains the same as analysis dated 20 October 2025.
Price has printed as per previous intraday expectation by printing a bearish CHoCH which indicates, but not confirms, bullish pullback phase initiation.
Price is currently trading within an established internal range, however, I will continue to monitor price with regards to depth of pullback.
Intraday expectation:
Price to continue bearish, react at either discount of 50% internal EQ, or H4 supply zone before targeting weak internal high priced at 4,380.990.
Note:
The Federal Reserve’s sustained dovish stance, coupled with ongoing geopolitical uncertainties, is likely to prolong heightened volatility in the gold market. Given this elevated risk environment, traders should exercise caution and recalibrate risk management strategies to navigate potential price fluctuations effectively.
Additionally, gold pricing remains sensitive to broader macroeconomic developments, including policy decisions under President Trump. Shifts in geopolitical strategy and economic directives could further amplify uncertainty, contributing to market repricing dynamics.
H4 Chart:
M15 Analysis:
-> Swing: Bullish.
-> Internal: Bullish.
Price has printed as per analysis dated 14 November 2025 where I mentioned price to trade down to either discount of 50% internal EQ, or M15 demand zone before targeting weak internal high, priced at 4,245.195.
Price subsequently printed a bearish CHoCH, however, as mentioned yesterday, I would closely monitor price with respect to depth of pullback.
Price did not pull back with any significance, therefore, I will apply discretion and not classify an iBOS. I have marked this with red dotted and dashed lines.
Price has since printed another bearish CHoCH.
We are currently trading within an established internal range, however, as per yesterday, I will continue to monitor price with respect to depth of pullback.
Intraday expectation:
Price to trade down to either discount of 50% internal EQ, or M15 demand zone before targeting weak internal high, priced at 4,264.700.
Note:
Gold remains highly volatile amid the Federal Reserve's continued dovish stance, persistent and escalating geopolitical uncertainties. Traders should implement robust risk management strategies and remain vigilant, as price swings may become more pronounced in this elevated volatility environment.
Additionally, President Trump’s tariff announcements, particularly against China, are expected to further amplify market turbulence, potentially triggering sharp price fluctuations and whipsaws.
M15 Chart:

USDCAD: Another Bullish Confirmation 🇺🇸🇨🇦
A quick follow-up for the yesterday's post for USDCAD.
I see another bullish pattern on a 4H time frame now.
The price formed a cup & handle pattern and broke its neckline.
I still expect a move up to 1.402
❤️Please, support my work with like, thank you!❤️
I am part of Trade Nation's Influencer program and receive a monthly fee for using their TradingView charts in my analysis.

Gold is still showing us it's bearish intent on the macroEasy peasy reading on the week so far. Let me know if I missed anything. I'm here for the sharing of info 💎

USDJPY Sell SetupTechnical Context
Break of Structure → Price broke last week’s low at 155.64, extending down to 154.70, confirming bearish momentum.
Supply Zone Retest → Price is now retesting the 155.40–155.70 supply zone on the 1H chart, offering a potential short entry area.
🎯 Trade Plan 🎯
Entry : 155.50 (below supply zone, 1H)
Stop Loss : 155.72 (above supply zone, 1H)
Target : 154.95 (above demand zone, 1H)
Risk–Reward: ~3.5x
⚠️ Disclaimer ⚠️This journal entry is for educational and documentation purposes only. It does not constitute financial advice or a recommendation to trade. All trading involves risk, and past performance does not guarantee future results. Always conduct your own analysis and consult with a licensed financial professional before making trading decisions.
