USDCHFCurrently bullish Overall. Price have broken the trend line supporting sells. Retracement from the market POI to the breaker should push price higher.
I'll be taking a short term risky sells at that POI now. Manage risk
Multiple Time Frame Analysis

AUDCHF: Bullish More After Breakout 🇦🇺🇨🇭
AUDCHF broke and closed above a key daily horizontal resistance.
Retesting a broken structure, the price formed a bullish flag pattern.
A breakout of its resistance line is a strong confirmation.
It indicates a highly probable movement up to 0.5656 level.
❤️Please, support my work with like, thank you!❤️
I am part of Trade Nation's Influencer program and receive a monthly fee for using their TradingView charts in my analysis.

L.V.L Capital Weekly Outlook | 12.8.25 XAUUSD ANALYSIS :
[ EIGHTCAP:XAUUSD ]
Price is currently consolidating between the daily Support & Resistance Levels w/ a Area of Interest / Liquidity pool @ 4187.50 Level & 4262.5
Price hasn't given us any clear intent after london session open, There simply isn't enough liquidity / volume to move the markets with volatility rn
Potential Trades
•
Shot #1 | Buy off liquidity pool at 4187.5
Shot #2 | Sell off down to Daily resistance 4225 after rejection off 4262.5
Shot #3 | Wait for Break and retest to the down side of 4187.5 due to the fact we are at a HH on the Daily time frame and price cant generate enough liquidity to continue is push higher we will have to wait for NY session to see what unfolds
** Trade LVL to LVL waiting for the rejections into limit orders
ENTRY SIGNAL :
**
SUCCESS IS BUILT ON PROCESS THEREFORE WE NEED FLAWLESS EXECUTIONS
RISK PER TRADE
Maximum $600.00 Drawdown Per Week
2.5RR Minimum
15 POINT STOPS

XAU/USD 08 December 2025 Intraday AnalysisH4 Analysis:
-> Swing: Bullish.
-> Internal: Bullish.
Analysis and bias remains the same as analysis dated 20 October 2025.
Price has printed as per previous intraday expectation by printing a bearish CHoCH which indicates, but not confirms, bullish pullback phase initiation.
Price is currently trading within an established internal range, however, I will continue to monitor price with regards to depth of pullback.
Intraday expectation:
Price to continue bearish, react at either discount of 50% internal EQ, or H4 supply zone before targeting weak internal high priced at 4,380.990.
Note:
The Federal Reserve’s sustained dovish stance, coupled with ongoing geopolitical uncertainties, is likely to prolong heightened volatility in the gold market. Given this elevated risk environment, traders should exercise caution and recalibrate risk management strategies to navigate potential price fluctuations effectively.
Additionally, gold pricing remains sensitive to broader macroeconomic developments, including policy decisions under President Trump. Shifts in geopolitical strategy and economic directives could further amplify uncertainty, contributing to market repricing dynamics.
H4 Chart:
M15 Analysis:
-> Swing: Bullish.
-> Internal: Bullish.
Analysis and bias remains the same as yesterday's analysis dated 02 December 2025.
Price has printed as per analysis dated 14 November 2025 where I mentioned price to trade down to either discount of 50% internal EQ, or M15 demand zone before targeting weak internal high, priced at 4,245.195.
Price subsequently printed a bearish CHoCH, however, as mentioned yesterday, I would closely monitor price with respect to depth of pullback.
Price did not pull back with any significance, therefore, I will apply discretion and not classify an iBOS. I have marked this with red dotted and dashed lines.
Price has since printed another bearish CHoCH.
We are currently trading within an established internal range, however, as per yesterday, I will continue to monitor price with respect to depth of pullback.
Intraday expectation:
Price to trade down to either discount of 50% internal EQ, or M15 demand zone before targeting weak internal high, priced at 4,264.700.
Note:
Gold remains highly volatile amid the Federal Reserve's continued dovish stance, persistent and escalating geopolitical uncertainties. Traders should implement robust risk management strategies and remain vigilant, as price swings may become more pronounced in this elevated volatility environment.
Additionally, President Trump’s tariff announcements, particularly against China, are expected to further amplify market turbulence, potentially triggering sharp price fluctuations and whipsaws.
M15 Chart:

Looking to buy GCGC fell on Friday leaving inefficiency above. 4H closed bullish with expansion candle. Looking to buy from 15M engulfed candle (order block). Going for bit more than 2R. 4H candle high is the first target

5m & 4H Supply and Demand Short - CLLooks like Price (CL!) is getting to a support area based on the 4H chart (zoom out).
So, I've mapped a daily gap, 4H zone, for a quick short.
There are double bottoms way down around 58.27, so keep an eye out as this 4H trend has got to get swiped.

gold going long!! but not yetmy thoughts on gold is that we are going to continue bullish momentum but first we need a slight pull back . gold already confirmed a change of character when it slightly broke the previous highs last week around 4260 . that is also at a daily supply area and price is once again showing weakness once reaching that area. I see gold pushing back down to 4087 which would create relatively equal highs at that supply area. once price rejects 4087 we can anticipate buys up to 4377 area.

"The Liquidity Trap 90% of Traders Completely Miss"🔥 EVERY TRADER GETS TRAPPED HERE… EXCEPT THE ELITE
You watch the highs and lows, the support and resistance, the obvious levels…
And you think you’re safe.
You’re not.
The real move comes from liquidity inside the swing — the part most traders never notice.
1️⃣ External Liquidity is What Retail Chases… Not the Real Move
• Traders see obvious highs, obvious lows, support, resistance.
• They think: “Price will reverse here.”
• This is the illusion the market creates.
Here’s the truth:
External liquidity is bait, not the target.
It’s where most traders get trapped.
⸻
2️⃣ Internal Liquidity is Where the Smart Money Lives
Inside every swing — every leg up or down — exists hidden liquidity:
• Micro Order Blocks
• Lower highs / higher lows inside the leg
• Stop clusters designed to trigger retail exits
Most traders don’t look inside the leg. They only see the edges.
That’s the trap. That’s where your edge comes in.
Nugget: The move you want usually comes after the internal liquidity is cleared, not at the obvious high/low.
⸻
3️⃣ The Sequence Traders Must See (Stop Losing to the Trap)
Here’s the real SMC sequence, step by step:
A. External Sweep → The Bait
• Everyone watches it
• Everyone reacts
B. Internal Liquidity Run → The Real Target
• Hidden inside the leg
• Where stops, inducements, and OBs cluster
• The market clears this before the real move
C. Displacement → The Delivery
• After internal liquidity clears, price finally moves in the “true” direction
• This is when smart traders enter with confidence
Nugget: If you chase the sweep and ignore internal liquidity, you’re giving your edge to the market.
⸻
4️⃣ How to Spot Internal Liquidity Like a Pro
Look for these patterns inside the leg:
• Lower highs / higher lows forming in micro OBs
• Price clustering around imbalance areas
• Fake breaks that lure retail orders
• Zones where price pauses before real expansion
Golden Nugget: Price gives clues every time. The problem is, 90% of traders don’t see them.
⸻
5️⃣ Why Traders Lose Even When They’re “Right”
• You can have the right bias
• You can see the sweep
• You can even pick the “obvious OB”
But if you enter too early or in the wrong micro-structure, your stop gets taken, and the move happens without you.
This is why SMC isn’t about guessing.
It’s about understanding sequence, intention, and liquidity footprint.
⸻
6️⃣ Mindset Shift: Read Market Intention, Not Candles
Stop asking:
• “Did it break the high?”
• “Did it hit my level?”
Start asking:
• “Where is the internal liquidity being cleared?”
• “What is the smart money engineering?”
• “Where will the market take the stops before the real move?”
Nugget: Reading price action without seeing internal liquidity is like driving blind.
⸻
7️⃣ The SMC Edge You Must Internalize
• External liquidity = bait → observe
• Internal liquidity = real objective → anticipate
• Displacement = delivery → execute
When you see it unfold:
• Your entries become surgical
• Your stops make sense
• Your bias is confirmed before most traders even blink
You’re not reacting to the market.
You’re predicting its intentional sequence.
⸻
🔥 Final Takeaway (Save This)
The market isn’t random.
It’s designed to trap traders.
External liquidity tricks 90% of traders into early stops.
Internal liquidity reveals where the real move will come.
Learn to see it.
Respect it.
Trade it.
This is the real sauce of SMC trading.
Not flashy indicators. Not random setups.
Sequence, liquidity, inducement.
Pro Nugget: Once internal liquidity is in your sights, price becomes predictable.
The rest? Just execution.

AUDCAD - Bullish Outlook | Weekly * MidtermHigher-Timeframe Bias:
AUDCAD is bullish. HTF structure is clean, price has broken major and significant highs, showing clear bullish intent and directional control.
Mid-Term Structure:
On the mid-term perspective, structure is mapped and ready for continuation.
Currently, we’re waiting for:
• A sell-side liquidity sweep
• Inducement taken
• Price falling into the internal-framework OB just underneath
Once full mitigation occurs, we drop to lower timeframes for confirmation.
Lower-Timeframe Execution:
On LTF, we’re looking for:
• Internal micro lower-high break
• Pullback within the bullish leg
• Entry points to target:
• Mid-term highs
• HTF highs
• LTF highs
Plan:
Until the market opens, we stay patient.
Smart Money leads direction; we track footprints. Our job is to monitor structure, map zones, and execute when the algorithm delivers.
Patience is key. Follow the footprints. Let’s go.

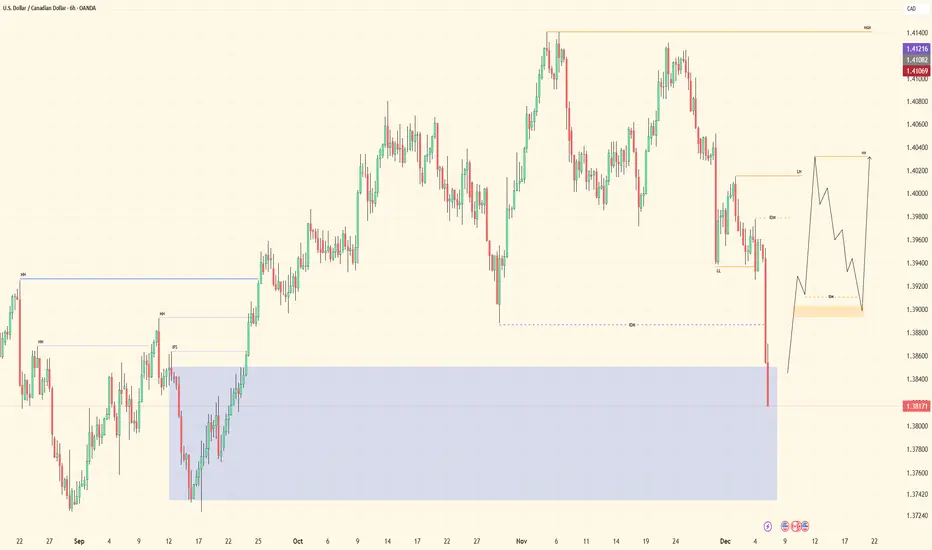
USDCAD - Bullish Outlook | Weekly * Midterm Higher-Timeframe Bias:
USDCAD is bullish. HTF structure is clean — price has broken major and significant highs to the left, maintaining a clear bullish trajectory.
Mid-Term Structure:
Price initially disrespected the mid-term flow but landed into a HTF internal-framework structure zone.
• From here, we wait for a mid-term CHoCH (trend change)
• Once the CHoCH occurs and a new POI is refined, the plan is:
• Wait for mitigation
• Drop to lower timeframes to play continuations
Execution Approach:
This setup will take time to fully develop. Until then, we track price, follow the footprints, and remain aligned with structure.
Plan for the Week:
We stay patient and observe — let Smart Money lead the direction.
Structure first, entries second.
Patience is key. Follow the footprints. Let’s go.
USDCHF - Bullish Outlook | Weekly * MidtermHigher-Timeframe Bias:
USDCHF remains bullish. Price has maintained clear HTF bullish structure, breaking highs and respecting higher-high / higher-low sequencing. Corrections have been deep, but structure remains intact.
Mid-Term Structure:
From the mid-term perspective:
• Price took out sell-side liquidity
• Mitigated both mid-term and HTF order blocks
• When price reached the HTF OB, we normally wait for a mid-term CHoCH
However, lower-timeframe structure is cleanly holding within the mid-term OB, giving confidence that continuation is intact.
Lower-Timeframe Execution:
While the LTF micro charts aren’t physically visualized here, from a broader bird’s-eye view:
• Price switched lower-timeframe structure
• Delivered bullish push power toward mid-term and HTF highs
• Inducement and engineered liquidity were taken in the green structure far to the right
Lower-timeframe entries will be looking to ride continuation, targeting:
• 5-minute highs
• Mid-term highs
Plan:
Until market opens, we remain patient, observing how Smart Money directs price.
If price doesn’t give our ideal setup, we track, monitor, and adjust — no cracks, no forced entries.
The Job:
Map structure → Track footprints → Follow the flow.
Patience is key. Let Smart Money lead. Let’s go.

EURGBP - Bullish Outlook | Weekly * MidtermHigher-Timeframe Bias:
EURGBP remains bullish. On the HTF, we have a clean, event-driven structure:
Price has been breaking major highs, pushing the market into higher-high / higher-low context and maintaining bullish order-flow.
Mid-Term Structure:
On the mid-term perspective, I’m looking to attend continuations.
Inside the structure, this is what we see:
• Price took out the inducement from the top
• Engineered liquidity was collected
• Price fell into a thin, refined internal-framework structure order block (the orange line that might be hard to see)
However, while we did get an initial bullish reaction, price pushed deeper — tapping directly into the higher-timeframe internal-framework structure order block.
That deeper tap is the true reaction point.
Next Step — Midterm CHoCH:
From the HTF OB, we wait for:
• A mid-term CHoCH (trend change)
• A new refined mid-term POI to form
Once that refined POI forms, the plan is:
1. Wait for the inducement above the refined POI to be taken
2. Let price fall back into the mid-term order block
3. Once mitigated — drop down to LTF
Lower-Timeframe Execution:
After dropping to LTF, the model is simple:
• Wait for the internal LTF lower-high break
• Get the pullback inside the bullish leg
• Execute longs targeting:
• Mid-term highs, and
• Higher-timeframe highs
This keeps our entries aligned with both direction and structure.
The Approach:
We stay patient and we let Smart Money reveal the next step.
If price shifts deeper or accelerates early, we simply adjust — because our job is to track the footprints, map structure, and follow delivery.
Patience is key. Structure is king. Let’s work.

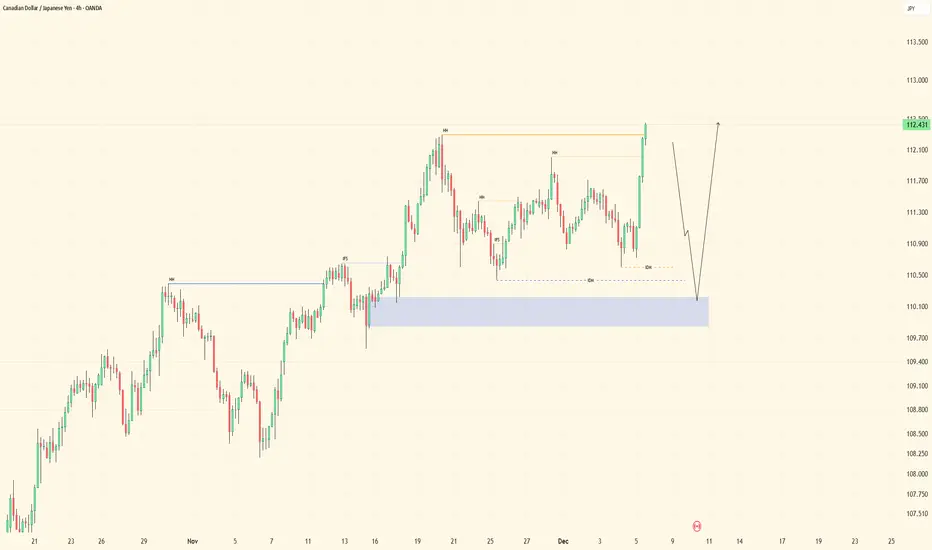
CADJPY - Bullish Outlook | Weekly * MidtermHigher-Timeframe Bias:
CADJPY remains bullish. HTF structure is clean, visual, and directional — price continues to respect bullish order-flow, confirming upward intent.
Mid-Term Perspective:
Going into the upcoming week, we’re looking for continuations.
I’m waiting on a sell-side liquidity sweep, but keep in mind:
Price is moving with strong volume and has already cleared mid-term highs.
That type of aggressive delivery typically leads to:
• A clean sweep of the current leg
• Followed by price dropping into the higher-timeframe order block below
That HTF OB is where the meaningful reaction is expected.
Important Note — Patience With LTF:
When price drops directly into a HTF structure, we do not jump straight to lower timeframes.
Reason:
LTF can easily be pushed around inside a HTF zone — it’s “big boy structure.”
Instead, we follow a disciplined, top-down sequence.
Execution Sequence:
1. Wait for price to sweep sell-side liquidity
2. Expect a drop into the HTF order block
3. Do not go to LTF yet
4. Wait for a mid-term CHoCH off the strong HTF zone
5. Once mid-term structure confirms, refine the POI
6. After mitigation of the refined mid-term POI → then drop to LTF for confirmation
This is the proper mapping sequence — a clean top-down approach.
If Price Doesn’t Follow Our Steps:
No panic, no emotion.
We simply:
• Track price
• Monitor delivery
• Follow the footprints
That’s our job as day traders — observe, map, adjust.
Plan:
We wait for market open.
We let Smart Money align the direction.
Then we execute with precision.
Patience is key. Follow the footprints. Let’s go.
GBPJPY (GJ) - Bullish Outlook | Weekly * MidtermHigher-Timeframe Bias:
GBPJPY remains bullish. On the HTF, price continues breaking major highs, printing a clean sequence of higher-highs and higher-lows. Direction is clear, structure is controlled, and Smart Money is maintaining bullish flow.
Mid-Term Perspective:
On the mid-term view, we want to play continuations. Price is currently sitting at a high, and the next step we’re waiting for is:
• A sell-side liquidity sweep,
• Followed by price falling into our internal-framework structure order block sitting underneath the inducement.
Once mitigation occurs, we move into execution mode.
Lower-Timeframe Execution Plan:
After price taps the refined OB, we want LTF confirmation:
• A trend change
• A clean internal LTF lower-high break
• Then a pullback into the bullish leg for our entry
From there, targets are:
• Mid-term highs
• Higher-timeframe highs
If Price Violates the Zone:
If price violates the orange zone and dips deeper — no fear, no panic.
We simply:
• Reassess
• Pull up the PD grid
• Locate the next valid order blocks in discounted territory
The OB we’re currently working with is aligned with near structure and current order-flow, but deeper discount is still valid if price chooses that path.
If Price Keeps Climbing:
If price continues pushing higher without giving our sweep/mitigation, that’s fine too.
We track the footprints, stay aligned with structure, and wait for the next clean opportunity.
Plan:
Direction is clear. Liquidity is in place. Structure is clean.
We stay patient, wait for Smart Money to reveal the next step, and execute when the algorithm delivers.
Patience is key. Follow the footprints. Let’s go.

XAUUSD still in corrective mode!I believe that GOLD is still in corrective wave and it is not done yet!
Possibilities prices to go down after hitting zone 4275 and 4325

AUDJPY (AJ) - Bullish Outlook| Weekly * MidtermHigher-Timeframe Bias:
AUDJPY is bullish on the high-term perspective. Price has been breaking major highs and significant highs, leaving us positioned at a precise, pinpoint high on the HTF.
Direction is clean — Smart Money is clearly leaning upward — so we continue to favor bullish continuations.
Mid-Term Structure:
On the mid-term perspective, structure is also bullish. Price already broke another significant high, keeping the continuation narrative intact.
Now the next steps are simple:
• Price needs to clear the volatility leg,
• Take out the side liquidity, and
• Then mitigate into our mid-term internal-framework structure order blocks
That mitigation gives us our refined POI.
Lower-Timeframe Execution:
Once price taps that mid-term OB, I’ll be dropping down to the LTF to confirm direction through:
• A clean LTF lower-high break,
• A sell-side liquidity sweep, and
• Structure holding inside the refined OB
When those align, I’ll be looking to ride longs toward mid-term highs and then HTF highs.
If Price Skips the Sweep:
If price refuses to sweep the side liquidity first, then we simply track the footprints as it falls into liquidity on the way down.
Never forcing the market — always following the algorithmic path.
Plan for Market Open:
Until market opens, we stay patient and let Smart Money lead direction.
We trade the footprint — not emotions.
Patience is key. Follow the footprints. Let’s go.
