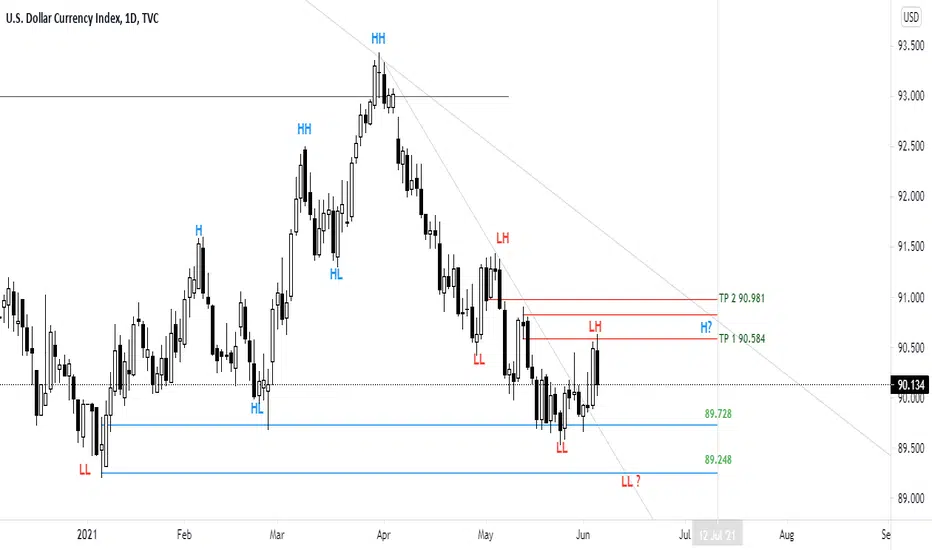
XAUUSD : WE BACK TO 1800following a flash crash early this week on Monday morning The price of gold has been on an upward trend for quite some time now.
Gold is now headed back to 1800 after breaking through resistance at 1752.
Any rejection at 1800 on a daily timeframe could provide an opportunity to short the position at least to 1770 - 1752.
My trading strategy isn't intended to be used as a signal service. It's a process of gaining knowledge of market structure and improving my trading abilities.
happy trading to all
Nakedchartanalysis

EURJPY : UPDATEEURJPY has been trading sideways for a few days...
if price fails to break through a fresh high,
it may be possible to ride this trend until target 1 is reached.
For explanation, please refer to the previous trade plan.
Please give me a thumbs up if you like this idea. Until then, happy trading!

SILVER: TRENDING IN DAILY CHANNELafter breakout 4 hr support price retesting trendline before fall down.. please check my previous silver trade idea
in daily price is trending in channel and trying to breakout daily... im looking for any bounce back at this 2 level support

XAUUSD : STRONG US DATA BREAK SUPPORTso the question where will the price bounce? there is 2 level support and which one is the strongest support that can bounce the price...
Is there a chance of a weekly breakout?

15 Min Recap GBPJPY If you love reading charts and price action in general, then we'll probably mesh well. Thanks for watching

Looking for more Bullish Looking to hold this till 1.18600 tp 1
But already closed my original trade.


Xauusd short well I see a shorting opportunity on xauusd. Its one of my high probability setups for the week, Simple continuation pattern the market is currently in a corrective phase and if the probabilities are in my favor then the market well have an Impulsive move to the downside.

XAUUSD : WEEKLY TRADE PLAN Any downturn is an opportunity to continue buying, as the 4 hour structure has already been broken.


XAUUSD : WEEKLY TRADE PLAN Some sideways movement was seen last week. 1797.18 is the recent high, 1760.74 is the recent low, and 1773.01 is the current support.
I'm still on the side of the shorts.


XAUUSD : WEEKLY TRADE PLAN I see a sideways market... the rising trendline is still in place, but I'm leaning toward selling.


USDJPY: Head and Shoulders Pattern1: Head and shoulders Pattern clearly visible on the Daily Chart. Price also created a New Low by breaking the lower high around the area of 108.330
2: Price would need to break the key level of 107.460 - 107.450 area as confirmation.
3: The target will be based on how deep the breakout is.
4: Will take up to two weeks for the pattern to complete before we start looking for entries. This could be during the second week of May 2021.


USDCAD Long Oppotunityas you see price was touched major and strong support zone which is a lowest price since Sep 2018
Its good opportunity long position with 1st TP at 1.22230 and 2nd TP at 1.23600 (the resistance zone) and SL at 1.2040
Happy trading
#nakedchartchallenge

AUDNZD - Price Inefficiencies Overlooked...As AUDNZD started to put a whooping on me, I then started doing my top down analysis (Ironically after having entered a knee-jerk short). Poor planning on my part and I see that I should have been long all along.
A beautiful inverse head/shoulders with a nice compressed move back to the Quasimodo. It was interesting to note the fractal QM at the accumulation area along with the interesting RSI display. Seeing that compressed, wedge-like move back, along with the clearly divergent RSI, it was quite a nice set up and a beautiful example of neutralization of sell-side liquidity and the indomitable propensity of price to bring efficiency along with it. Hats off to price!
The shaded areas were price inefficiency areas derived from the h4/h1/m15. The blue verticals are delineating NY midnight opening price (a bit of ICT).
Thanks for stopping in.
