Nasdaq
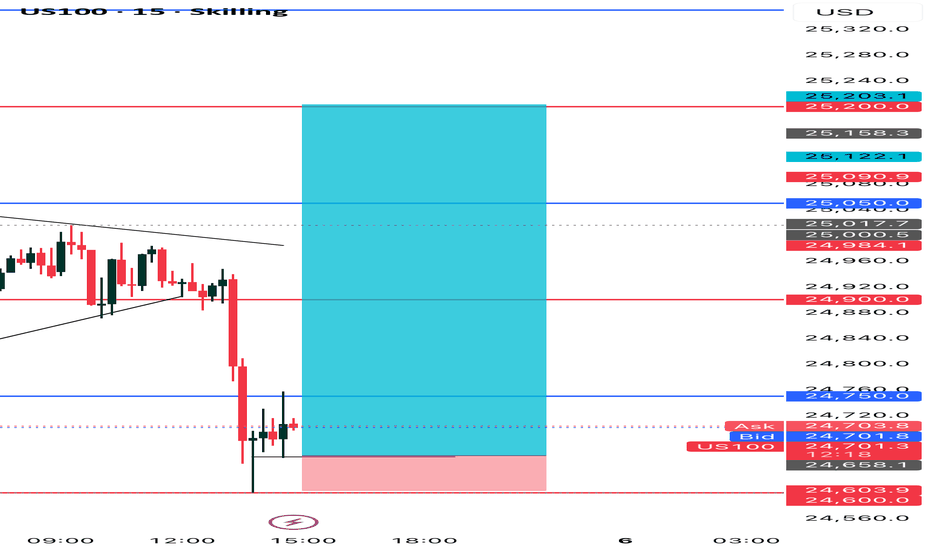
USNAS100 | Tech Earnings Drive Volatility as Bears Hold ControlUSNAS100 | Bearish Pressure Builds as Tech Earnings Drive Volatility
Nasdaq futures remain under pressure as markets continue to digest the latest big tech earnings, following the recent tech-led selloff highlighted in the S&P 500 outlook. With Alphabet and Amazon earnings in focus, volatility is expected to remain elevated as traders position for the next directional move.
Technical Outlook
The index maintains a bearish structure while trading below 25415.
As long as price remains below 25415, downside pressure is expected toward 25250, followed by 25120.
A break below 25120 would expose deeper downside toward 24770.
On the upside, a 1H candle close above 25415 would signal a bullish corrective move toward 25610 and 25700, with further resistance at 25835.
Key Levels
• Pivot: 25415
• Support: 25250 – 25120 – 24770
• Resistance: 25610 – 25700 – 25835
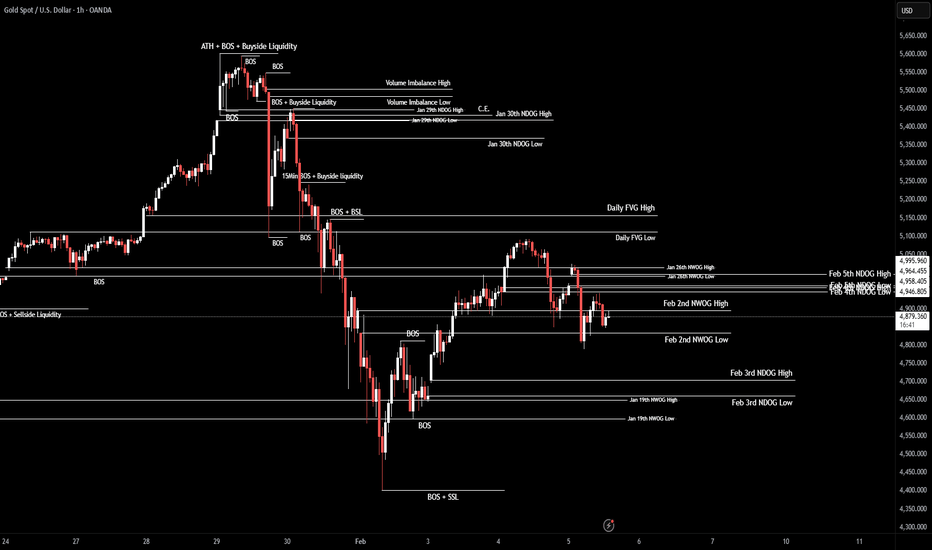
XAU/USD | NWOG Retest (READ THE CAPTION)Gold went below the Feb 2nd's NWOG low it the early hours of today, but managed to go back and went through it, then dropped again into the NWOG zone, currently being traded at at 4880. It once got close to the NWOG high at 4884 but fell short of 7 pips and didn't touch the NWOG high.
I expect Gold to retest the NWOG high, and current targets are: 4890, 4900, 4910, 4920 and 4930.
If it fails at retest, the targets are: 4866, 4850, 4835 and 4820.
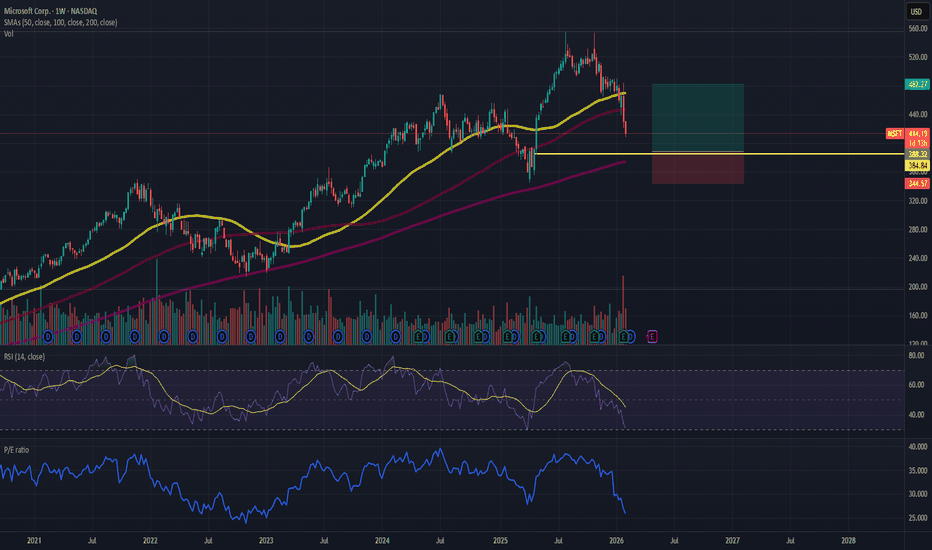
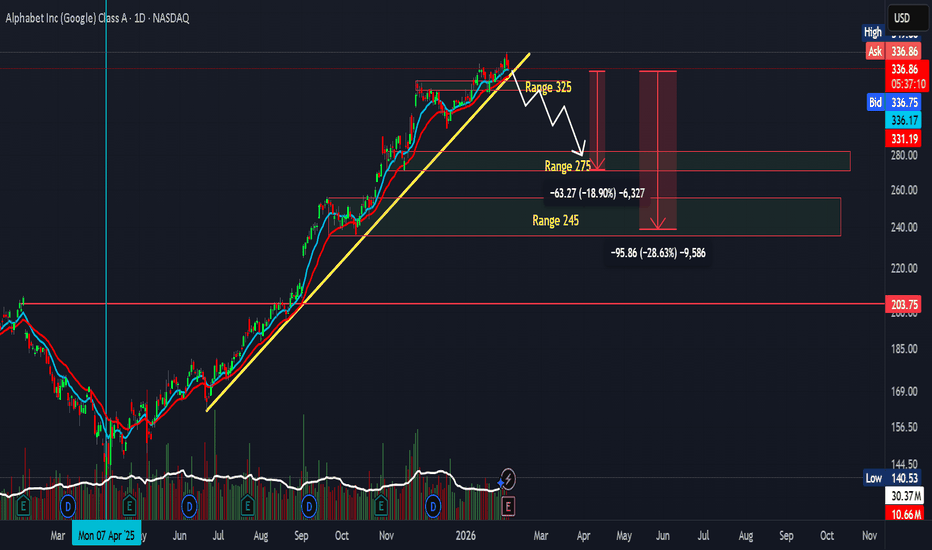
MSFT BUY - Market Overreaction!Market overreaction due to OpenAI making up for 45% of MSFT's Azure Remaining Performance Obligations (RPO) - raising questions about circular financing.
Disregarding the RPO the remaining revenue growth is still sustained and considerable
With a mag7 at PE near 25~, MSFT has never been cheaper
Buy @ 385 - 400
Near Weekly 200SMA
Target @ 482, 550
Long hold
Is NVIDIA showing signs of a potential momentum shift?Is NVIDIA starting to shift momentum after a strong uptrend since October 2022?
There’s a possibility of a retest toward $88 if price fails to break out above the $180 range.
Volume continues to decline, suggesting weakening participation. Only time will tell.
BUY for META at Discounted Price - AI CAPEX Priced In!Market sentiment dragging prices down due to concerns over AI CAPEX, but from what I see, these are one time costs with sustained future ROI and non-linear positive scaling effect on META's family of apps and advertising services.
Catalysts upcoming include META's AI Frontier models release - Avocado.
META has also not fully leveraged profit margins on threads and whatsapp unlike instagram and facebook which has global advertising footprint.
BUY @ below 685
TARGET @ 850, 1000, Long hold
Smart Money Are Hedging While Seasonality Turns BearishThe Nasdaq is entering a technically delicate phase where positioning, seasonality, and price structure are beginning to converge toward a potential corrective scenario rather than trend continuation.
Starting with the Commitment of Traders, a configuration is emerging that deserves close attention. Non-commercial traders — typically speculative money — remain net long with 89,479 long contracts versus 61,324 shorts, confirming that the broader positioning is still structurally bullish. However, the latest weekly change highlights a reduction in risk exposure, with an increase in short positions alongside a contraction in total open interest. This is not yet an outright bearish signal, but it clearly reflects de-risking behavior following an extended bullish cycle.
Even more significant is the positioning of commercial hedgers, who are heavily net short (170,046 shorts vs 128,486 longs). Historically, when commercials expand downside hedges near elevated price zones, it tends to reflect institutional protection rather than directional speculation, a dynamic typically associated with the mature stages of a trend.
Seasonality further reinforces this cautious tone. February often shows strength in the early part of the month, followed by weakness into the mid-to-late period, and the multi-year composite currently projects negative average performance. After the strong fourth-quarter rally, supported by election-cycle liquidity and continued leadership from the technology sector, the market is now entering a statistically softer window where pullbacks become more likely than impulsive breakouts.
Shifting to the daily chart, price has recently lost the lower boundary of the ascending channel, suggesting early signs of momentum exhaustion. The rejection from the upper structure followed by an impulsive decline confirms that buyers no longer have full control of the market.
The key technical area now sits within the 23,800–24,000 demand zone, which also aligns with trendline support visible on higher timeframes. This is the level where institutional participation is most likely to re-emerge.
Until strong bullish acceptance returns, rebounds may increasingly offer tactical short opportunities rather than breakout entries.
Operational bias: bearish in the short term / bullish in the medium term as long as the broader structure remains intact.
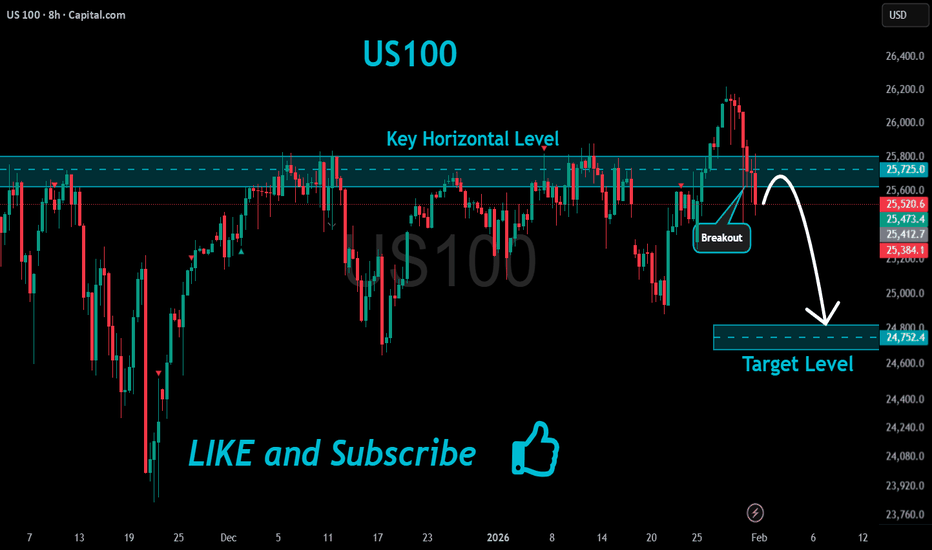
NAS100 Weekly Outlook: Watch This Liquidity Sweep Before SellingNAS100 🌍
The macro narrative heading into this week is dominated by a sudden reassessment of the AI investment cycle following a string of high-stakes earnings reports 🏦. While Big Tech giants like Meta and Microsoft have delivered "on-paper" beats, the underlying sentiment is shifting toward exhaustion as investors start demanding immediate monetization from massive AI capital expenditures. Interestingly, general online sentiment is showing a "buy-the-dip" mentality reaching near-extreme levels, suggesting a potential liquidity hunt before the real move lower can materialize. This retail eagerness to catch the falling knife often provides the perfect fuel for a deeper sweep of the lows 🧹.
We are seeing a Bearish Market Structure on the H4 after a significant rejection at the 26,000 psychological level 📉. While the long-term trend remains structurally bullish, the prevailing community chatter is heavily leaning toward a bounce, which tells me retail is likely positioned poorly and trapped in early long positions. The recent break of the 25,200 support zone has shifted the immediate momentum to the downside, and I am watching for the market to exploit this "crowded long" positioning before settling into a more sustainable range.
Key Zone: The confluence of the bearish Parallel Channel and the Fibonacci 50% retracement level (near 25,293) is the primary area of interest 📉.
We are currently trading just below the mid-point of the recent sell-off, and the price action is carving out a corrective flag within a descending channel. I am watching for a 'run on liquidity' to sweep the late buyers I'm seeing across various social forums who are aggressively longing this minor pullback 🧹. If we see a failure to reclaim the 50% Fibonacci level accompanied by a bearish "Break of Structure" (BoS) on the lower timeframes, it will confirm that the sellers are still firmly in control of the weekly range.
PayPal (PYPL) Breakout or Breakdown? High-Volume Reversal Zone aPayPal (PYPL) is trading near a major multi-year support zone after an extended downtrend, creating a high-probability area for a potential trend reversal or a decisive breakdown. I’m watching how price reacts around this demand area, combining structure, volume, and momentum to frame both long and short scenarios.
Nvidia Corporation Weekly Outlook (Count 3)This is a Weekly outlook on NASDAQ:NVDA . I don't hold a position in this stock, but have paid it some attention due to its affect on the stock market, plus it may be something i consider holding in the future given a nice entry.
This outlook views the October 2025 high as being the completion of an impulsive wave I, and so current price action is in a corrective pattern building a wave II.
There are many ways a corrective pattern can form, so If this analysis doesn't play out then, its still worth noting how this particular corrective pattern can unfold, as you will likely see if in plenty of other places following a similar structure and levels.
More comments on the chart.
NAS100 Short: "Back On The Table" (The Software Disruption) PEPPERSTONE:NAS100
The 26,000 level has proven to be a formidable ceiling for the Nasdaq over the last few months. After several failed attempts to sustain a breakout, the technical and macro signals suggest the short thesis is back on the table with a more defined risk-reward profile.
🏛️ The Macro Shift: Uncertainty & Disruption
Rather than a single event, we are seeing a "clustering" of risks that the market is struggling to price:
Structural Disruption & The MSFT Precedent: Recent advancements in AI-driven automation (Anthropic/Claude) have put a spotlight on SaaS valuations. We saw a significant compression in the IGV (Software ETF) recently. Critically, Microsoft (MSFT) beat expectations last week but saw its stock drop, signaling a "sell-the-news" regime where AI margins are now under forensic scrutiny.
The Information Gap: With the government shutdown impacting official labor releases, we are in a "Data Blackout." Without a jobs floor to rely on, the VIX is reflecting a defensive rotation as certainty evaporates.
The Earnings Cliff: Eli Lilly (LLY) reported a beat this morning, but this is a "divergence" play—liquidity is moving out of "Paper Tech" and into "Real Economy" growth. Alphabet (GOOGL) reports after today’s close; if they follow Microsoft's lead of "beat but drop," the Nasdaq wedge will snap.
Yield Gravity & The "Warsh" Curve: As the 10Y yield holds near 4.30%, elevated discount rates weigh on high-multiple growth. Investors are ramping up bets on higher long-dated yields following the Kevin Warsh Fed Chair nomination, creating a "valuation ceiling" that high-beta tech cannot easily break.
🏛️ The "Perpetual" Information Gap
Today's ADP Employment and ISM Services are now the only data points the market has to trade on.
The Data Blackout (NFP Suspended): Despite the late-January budget deal framework, the Bureau of Labor Statistics (BLS) confirmed this morning that the January Non-Farm Payrolls (NFP) report will NOT be released this Friday as scheduled. We are effectively "flying blind" on the most critical jobs floor. Because the NFP is postponed, these private prints now carry 2x the normal market weight.
The VIX "Certainty Premium": Markets reward clarity. With official labor data on ice due to the partial shutdown, the VIX is reflecting a defensive rotation as investors refuse to bid tech "blindly" into the apex of this wedge.
Private Data Sensitivity: Because of the government's silence, today's ADP Employment and ISM Services PMI numbers will carry 2x the normal market weight. If these private prints miss, there is no "Official NFP" to save the narrative on Friday, accelerating the tech flush.
📊 Technical View: Compression With a Double Top Toward Apex
The Double Top: After the initial rejection in late Q4, the recent re-test of 26,000 failed to find follow-through, leaving a clear "M-structure" at the ceiling. Institutional supply is heavy at these levels.
The Compression Wedge: Price is coiling within a narrowing wedge toward its apex. Historically, when a market "hammers" on the upper bound and fails twice, the eventual breakout is forced toward the path of least resistance: Down.
Volatility Coiling: This "wedge-within-a-top" suggests that indecision is exhausted. The narrowing range indicates a high-velocity expansion is imminent.
🏛️ Scenarios to Watch: The Catalyst Checklist
The validity of this short rests on whether the "Real Economy" validates the "Software Disruption" lead during today’s data block.
✅ Thesis Confirmation (The Bearish Breakout):
ISM Services PMI < 53.5: Confirms the non-manufacturing core is cooling alongside tech.
Alphabet (GOOGL) Guidance: Any sign that AI CapEx is peaking or search margins are eroding.
ADP Jobs > 50K: Forces yields higher (10Y > 4.301%), increasing valuation pressure on growth.
VIX > 18.00: Signals a transition to "Sell the Rip" psychology.
⚠️ The Red Flags (The Invalidation Checklist):
ISM Services PMI > 55.0: Signals demand is too robust to fade; 26,000 likely breaks to the upside.
10Y Yield < 4.20%: Removes valuation "gravity" and allows a tech re-rating.
DXY < 97.00: A weakening Dollar restores global liquidity, overriding technical resistance.
Bottom Line: We aren't fighting the trend; we are observing a Range Regime that has yet to be broken. If the wedge snaps, we're looking for a mean-reversion test of the lower value zones.
🏁 Your Afternoon Watchlist (CET)
14:15: ADP Private Payrolls (Forecast: ~41k–50k)
16:00: ISM Services PMI (Forecast: 53.5)
16:30: EIA Oil Inventories (The "Real Economy" check)
XAU/USD | Going higher? (READ THE CAPTION)As you can see, after 3 hellish days for gold, dropping over 10000 pips! Gold has finally regained a bullish momentum and now it's being traded at 5085, though it is far from its ATH at 5602.
I expect Gold to go for the Daily FVG zone between 5111-5157 levels. If it manages through the FVG Low and hold above it, the targets are: 5099, 5110, 5120, 5130, 5140 and 5150.
If it fails to hold above: the targets are: 5080, 5070, 5060, 5050 and 5040.
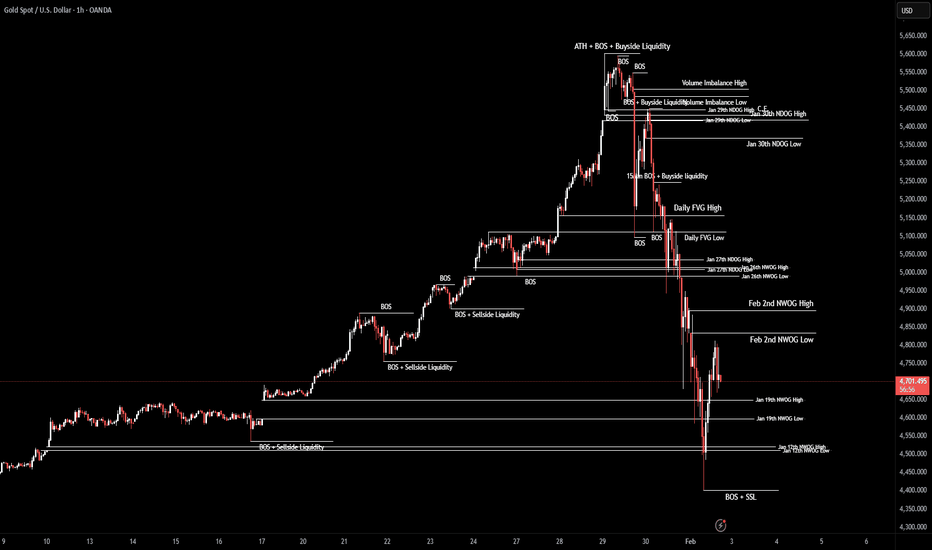
XAU/USD | Where will Gold go next? (READ THE CAPTION)As you can see in the hourly chart of XAUUSD, it dropped from 5602 all the way to 4402 in just 3 days! After sweeping the liquidity and filling the Jan 12th NWOG, it bounced back up and went as high as 4812, before dropping again and now being traded at 4720.
How Gold has been moving in the past couple of weeks...
Well, I expect gold to drop into the Jan 19th FVG and then going higher.
For now the Bullish targets for Gold are: 4800, 4900, 5000 and 5100.
Bearish Targets are: 4620, 4520 and 4420.
NAS100 Liquidity Grab & Distribution ExplainedNAS100 runs buy-side liquidity during active hours and fails to hold above premium supply. The move higher is corrective, not continuation. Under-hours price action suggests distribution, with lower highs forming and downside liquidity as the main objective.
📉 Bias: Bearish
APLD :: Bullish Price Action After Controlled Pullback🟢 APLD (Applied Digital Corporation) — NASDAQ
Market Profit Playbook | Day / Swing Trade
🧠 Trade Thesis (Why This Setup?)
APLD is showing bullish continuation behavior after prior expansion, now respecting a Double Exponential Moving Average (DEMA) pullback on the 3H timeframe.
This type of pullback often attracts institutional dip participation when trend structure remains intact.
Think of this as a controlled pullback inside a broader bullish environment, not a random dip.
📊 Technical Structure Breakdown
🔹 Trend
Primary bias: Bullish
Price holding above key trend structure
Pullback into Double EMA zone (3H) → classic trend continuation zone
🔹 Entry Method (Layered Accumulation)
Institutional-style scaling, not a single all-in entry.
Buy Limit Layers (example):
🟩 36.00
🟩 35.00
🟩 34.00
🟩 33.00
📌 You may add or adjust layers based on your own risk model and volatility tolerance.
🎯 Target Zone (Profit Escape)
Target: 🎯 42.00
📍 Rationale:
Prior supply / resistance zone
Momentum historically stalls here
Overbought + liquidity trap potential
Smart money often distributes here — grab profits, don’t negotiate
🛑 Risk Control (Capital Protection)
Stop Loss: ❌ 30.00
📌 Below key structure → invalidates bullish thesis if breached.
⚠️ Risk Notes (Read Carefully)
Targets and stops are reference levels, not mandatory instructions
Partial profits are always valid
Manage position size responsibly
This playbook shows structure — execution discipline is on you.
🏦 Fundamental & Macro Context (Why This Matters):
🔹 Company Angle (APLD)
Applied Digital operates in high-performance computing & digital infrastructure
Sector sensitive to:
AI / data center demand
Energy costs
Capital market liquidity
🔹 Macro Factors to Watch
📈 US Treasury Yields → higher yields can pressure growth stocks
🏦 Fed Policy Expectations → easing bias supports speculative tech
⚡ Energy Prices → impacts operational costs
📊 NASDAQ sentiment → APLD moves with risk-on / risk-off flows
Upcoming macro data that may impact volatility:
US CPI / PPI
FOMC statements
Bond auction demand
🔗 Correlated Assets to Monitor
NASDAQ:NDX / NASDAQ:QQQ → Tech sentiment driver
SP:SPX → Broader risk appetite
CRYPTOCAP:BTC → Speculative capital flow proxy
TVC:US10Y → Yield pressure indicator
📌 If NASDAQ weakens sharply or yields spike, expect higher volatility in APLD.
🧠 Final Thought
This is not prediction trading — it’s probability management.
The edge comes from structure + patience, not hype.
✨ “If you find value in my analysis, a 👍 and 🚀 boost is much appreciated — it helps me share more setups with the community!”
Trusting Your System After a Losing StreakTrusting Your System After a Losing Streak
Welcome everybody to another educational article.
Today we are covering one of the hardest moments every trader, beginner, novice or pro will face:
“Trusting your system after a losing streak.”
This is where most traders ditch profitable systems not because the system failed, but because emotion took control and said “I am Losing with this”
Trusting your system after a losing streak is not about blind belief.
It is about understanding probability, psychology, and discipline.
What Is a Trading System?
A trading system is a set of clearly defined rules that control:
• Entries
• Exits
• Risk management
• Trade management
A system removes emotion and replaces it with structure.
An EDGE that works best for you.
What Is a Losing Streak?
A losing streak is a series of losing trades that occur within normal probability.
Losing streaks are not failure, they are a statistical reality in trading. (They are needed)
Profitable system experience drawdown.
Gaining Trust in a System:
Trust is not given it is built.
You build trust in a system by:
• Clearly defining system rules
• Back testing across different market conditions
• Forward testing in demo or small size
• Tracking performance over a large sample size
Testing proves that losses are part of the system not a sign is not broken.
When you have seen the data, losses stop feeling personal.
Losing Trust in a System
Traders lose trust in their system when emotion overrides logic.
This often happens when:
• A losing streak appears unexpectedly
• Results don’t match recent performance
• Social media shows others “winning”
• Patience runs out
Instead of reviewing data, traders:
• Change strategies weekly
• Mix systems together
• Add random indicators
• Chase the next “better” setup
This strategy-hopping resets progress and prevents mastery.
Maintaining Trust After a Losing Streak
Maintaining trust is purely mental.
You must control the urge to react emotionally.
Even when trades lose, you still benefit.
Every loss provides:
• More data
• More clarity
• More understanding of system strengths and weaknesses
Losing streaks often occur because:
• Market conditions change
• Volatility shifts
• Structure transitions
These periods allow you to adapt, refine, and improve your strategy.
Trading Is Not Judged Only by Money
We live in a world where success is measured by money.
Trading is different.
A trade is not defined by profit or loss, it is defined by execution.
As mentioned in previous posts:
Positive Wins vs Negative Wins
A positive win:
• Making money while following the plan
• Hitting a target and stopping for the day
A negative win:
• Hitting stop loss
• Accepting it
• Closing the platform
• Being done for the day
It may feel frustrating —
but discipline is strengthened.
That frustration is growth.
Losses Are Data, Not Failure
By following your rules even when you lose, you strengthen your system.
You did not receive a money return you received a data return.
That data:
• Refines your edge
• Improves your entries
• Strengthens your confidence
• Leads to long-term profitability
Every losing trade is an investment in future performance.
Losing streaks do not mean your system is broken.
They mean the system is being tested.
Trust is built through:
• Data
• Discipline
• Consistency
• Emotional control
Traders who survive losing streaks grow.
Traders who react emotionally reset themselves.
Trust the process.
Respect the data.
Stay disciplined.
That’s how profitable traders are made.
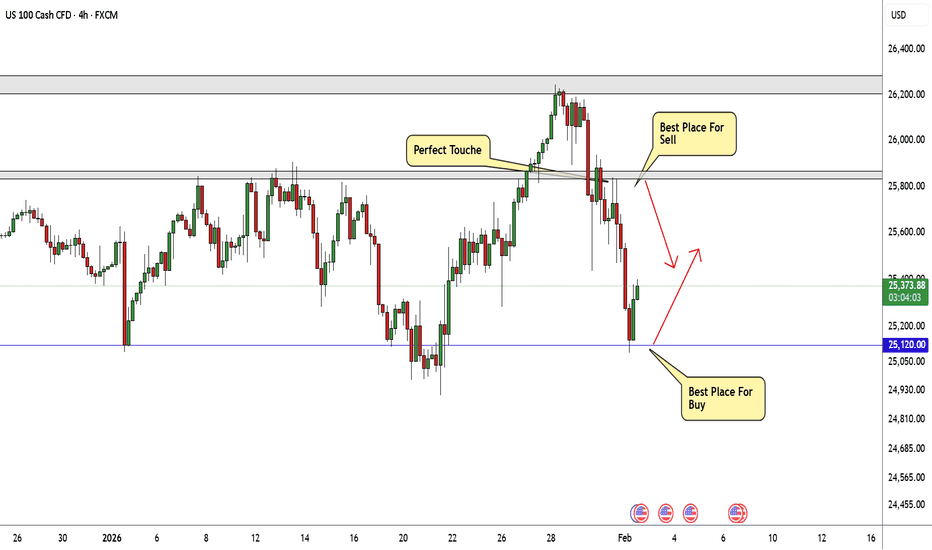
Nasdaq Best Places To Buy And Sell Cleared , 800 Pips Waiting !Here is m y opinion on NASDAQ On 4H T.F , We have a Huge movement To Downside as i mentioned in my last Analysis About Nasdaq & Then to Upside Now , and we have a good range for buy and sell started between 25120.00 to 25800.00 so we can buy and sell n\Nasdaq This Week from 2 areas , 25120.00 will be the best place for Buy and 25800.00 will be the best place for Sell , now the price very near buy area so we can Enter a buy trade when the price back to retest the area one more time and targeting 25800.00 and when the price touch it and give us a good bearish P.A , we can enter a sell trade and targeting 25120.00 , It`s All Depend On Price action , if we have a daily closure below our support then this idea will not be valid anymore .
Entry Reasons :
1- Lowest Level The Price Touch It
2- Broken Res .
3- New Support Touched .
4- Clear Price Action .
5- Clear Support & Res .
6- Price Range Cleared .
Counter-trend long on GitLab Inc. (Ticket GTLB)
NASDAQ:GTLB
Technicals:
- strong candle bounce from long-term support zone on 22 Jan. absorbing previous 10 sessions
- bounce from lower line of long-term descending channel
- corrective candle of 50% leaving 34.24-35.12 zone open for further retest
- therefore short-term stop below 16 Jan. low
- aiming retest of long-term descending channel middle line
- (3-year long support/ressistance zone) = short-term target
- for middle up to long term target is upper line of long-term descending channel 48.60-50.35
- scenario invalidated if two bars close below 32.90
Fundamentals:
- сompany demonstrated consistent Non-GAAP profitability throughout 2025 but still remains unprofitable.
- tracking existing users ratio is showing robust growth, averaging 20% annually.
- positive Free Cash Flow significantly mitigates the risk of further share dilution, so there is no immediate fundamental catalyst for a sharp decline in stock price.
- high-grade security protocols, a mature ecosystem, and the rapid integration of cutting-edge technologies (such as AI-driven DevSecOps) maintain the company's competitive edge in the market.
- on the downside, company faces intense competition from industry conglomerates, and a deceleration in revenue growth during 2025 triggered a wave of institutional sell-offs.
- due to its operations in a high-precision, mission-critical industry, GitLab may serve as a reliable "safe haven" for capital preservation during a recessionary period.
# - - - - -
⚠️ Signal - Buy ⬆️
✅ Entry Point - 36.38
# - - - - -
🛑 SL Short Term - 41.72
🤑 TP Short Term - 33.90
⚙️ Risk/Reward - 1:2.2 👌
⌛️ Timeframe - 2 weeks 🗓
# - - - - -
🛑 SL Long term - 32.44
🤑 TP Long Term - 48.73
⚙️ Risk/Reward - 1:3.1 👌
⌛️ Timeframe - 3-4 months 🗓
# - - - - -
Good Luck! ☺️
The US Dollar is about to Roar !For the last few years the US Dollar has been climbing an uptrend channel and we finally hit
the bottom of that channel this month !
Considering Gold / Silver / Stocks / Bitcoin prices are at a HISTORICAL ATH .. they cant go up forever so once all these markets starts to crash guess which chart will pump ?
And the best part is that the top of that uptrend channel aligns perfectly with the FIB 100% line which also aligns perfectly with the 2001 ATH of the US dollar.
With all the current FUD about the US Dollar and inflation and how the world is going back to Gold as a reserve currency, it makes perfect sense that we're at the bottom of that channel and the world is in for a big surprise when the dollar reaches 120 in the next 3 years!
All I wanna say is that the charts can tell us the truth about the future of the world financial system so don't listen to social media or the news .. just look at the charts and read between the lines.
Feel free to write your opinion in the comments :)
