NATURAL GAS: Stunning breakout!Natural Gas has had a wonderful move off the lows.
Breaking out of a falling wedge pattern on inventories.
Inventory report supports higher price. 27B exp build vs 18B actual.
If you have been following our analysis you would have ought to have know to start accumulating into the key weekly gap fill zone.
We have been pounding the table on resource stocks showing relative strength compared to the underlying commodity.
Our members have received several alerts via: AMEX:BOIL , NYSE:EQT NYSE:AR NYSE:RRC and others. We have netted some wonderful profits and it looks like Nat Gas should climb higher after some near term consolidation.
I would like to see Nat gas retest the major volume shelf (POC). That level should be monitored closely.
Natural Gas
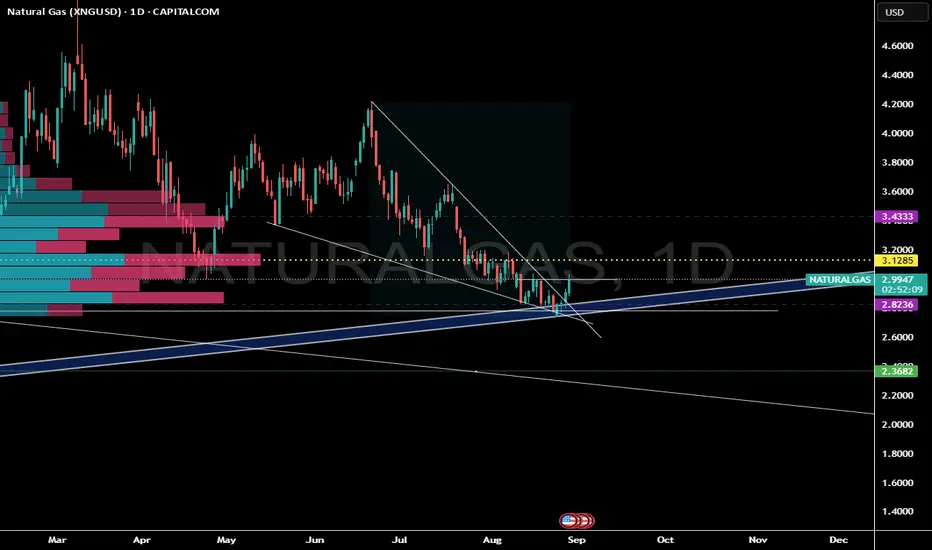
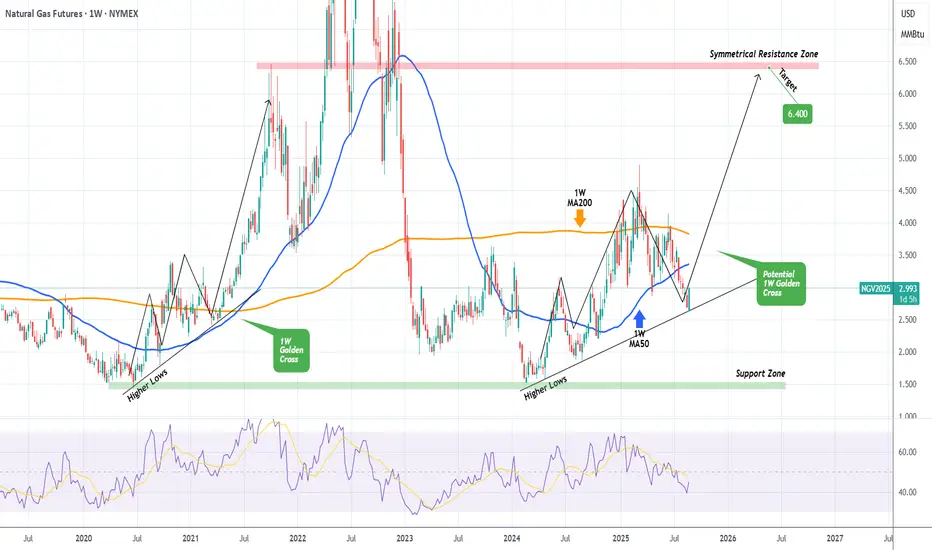
NATURAL GAS rebounding on a 1.5-year Support! Bullish.Natural Gas (NG1!) is having a strong green 1W candle, coming off a 2-month decline. It is highly likely that this correction has come to an end as the price hit this hit (and thus rebounding on) the Higher Lows trend-line that started all the way back since the February 20 2024 market bottom.
Technically the whole pattern from that day until now looks similar to the June 22 2020 - March 15 2021 sequence, which initiated a stronger 3rd Bullish Leg all the way to the Symmetrical Resistance Zone.
A potential 1W Golden Cross would confirm this upward break-out, just like it did on June 14 2021.
If that takes place, our long-term Target would be 6.400 (Symmetrical Resistance Zone).
-------------------------------------------------------------------------------
** Please LIKE 👍, FOLLOW ✅, SHARE 🙌 and COMMENT ✍ if you enjoy this idea! Also share your ideas and charts in the comments section below! This is best way to keep it relevant, support us, keep the content here free and allow the idea to reach as many people as possible. **
-------------------------------------------------------------------------------
💸💸💸💸💸💸
👇 👇 👇 👇 👇 👇
U.S. Natural Gas Hits 10-Month Low on Cool Weather OutlookU.S. Natural Gas Hits 10-Month Low on Cool Weather Outlook
U.S. natural gas futures slipped to $2.70/MMBtu, the lowest since November 2024, as cooler weather and weaker late-summer demand eased storage concerns. September NG1! fell 0.1%.
Analysts say strong power demand and limited injections expected earlier won’t materialize. Forecasts show below-normal temperatures for the next two weeks, while LNG exports rose to 15.9 bcfd in August. Lower-48 gas output hit 108.5 bcfd, near record highs.
Despite a smaller-than-expected storage build last week (+13 bcf), ample supply and higher production keep pressure on prices. U.S. LNG exports are projected to grow 10% annually through 2030, even as oil output plateaus.
European gas futures also slipped 1% to €33.5/MWh as Norway’s maintenance impact eased and storage builds continue ahead of winter.

2 Month Descending ChannelSeptember natural gas futures plunged to a nine-month low on August 22, dropping 4.5% amid near-record output, ample storage, and cooler weather reducing demand. Despite a rebound in LNG exports, prices have fallen for five straight weeks, down 24% overall.
Record U.S. production in August averages 108.4 bcfd, while storage remains 6% above normal. Demand, including exports, is expected to ease in coming weeks, with LNG feedgas rising to 16.2 bcfd as plants recover from outages. Hurricane activity in the Atlantic poses no immediate threat to U.S. supply. Analysts expect U.S. LNG exports to grow about 10% annually through 2030.
Gold | Oil | Dollar | Silver | Natural Gas Price Forecast Support & Resistance Guide
Natural Gas NYMEX:NG1! stock Bulls AMEX:UNG
USO NYMEX:CL1! Oil Stock price Forecast
DXY US dollar Stock analysis
Gold COMEX:GC1! XAUUSD Stock price Forecast
Silver XAGUSD stock analysis

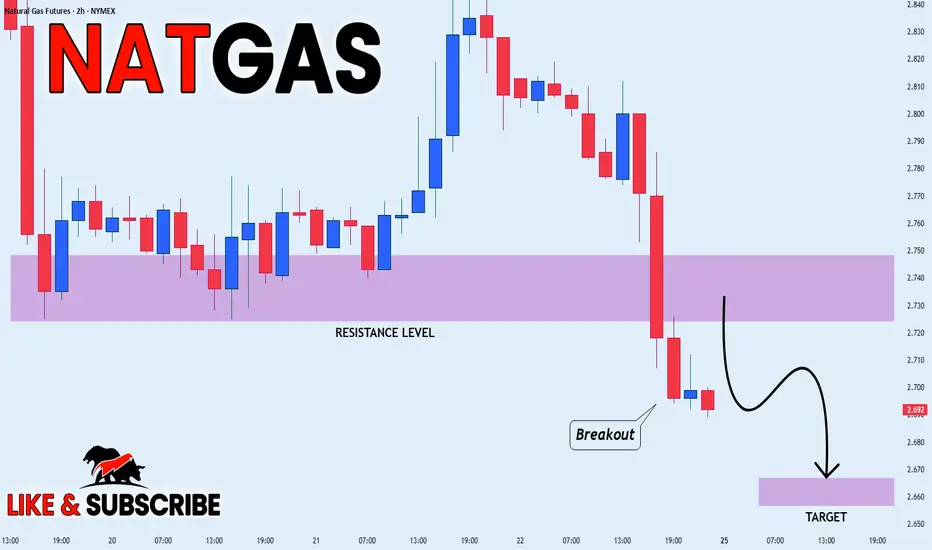
NATGAS WILL KEEP FALLING|SHORT|
✅NATGAS is going down currently
As the Gas broke the key structure level of 2.73$
Which is now a resistance, and after the pullback
And retest, I think the price will go further down
SHORT🔥
✅Like and subscribe to never miss a new idea!✅
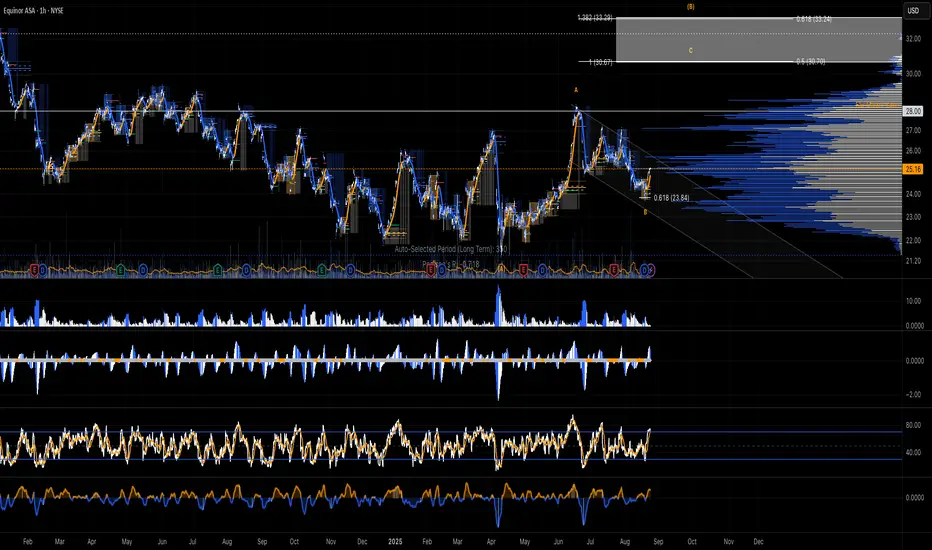
Equinor ASA ($EQNR) ~ Beautiful WaVes...Business Summary
Equinor ASA, formerly Statoil ASA is a Norway-based international energy company. The Company’s purpose is to turn natural resources into energy. Equinor sells crude oil and delivers natural gas to the European market. It is also engaged in processing, refining, offshore wind and carbon capture and storage activities. Equinor ASA has five reporting segments: Exploration & Production Norway (E&P Norway), Exploration & Production International (E&P International), Exploration & Production USA (E&P USA), Marketing, Midstream & Processing (MMP) and Renewables (REN). The Company has several subsidiaries such as Equinor Nigeria Energy Company Ltd, Equinor Wind Power AS, Equinor International Netherlands BV and Equinor Brasil Energia Ltda. EQNR 1.15%↑
Financial Summary
BRIEF: For the six months ended 30 June 2025, Equinor ASA (ADR) revenues increased 8% to $54.51B. Net income decreased 13% to $3.94B. Revenues reflect Marketing, Processing and Renewable Energy segment increase from $25.14B to $53.86B, Exploration and Production - International segment increase of 90% to $308M. Net income was offset by REN segment loss increase from $90M to $1.26B, Marketing.
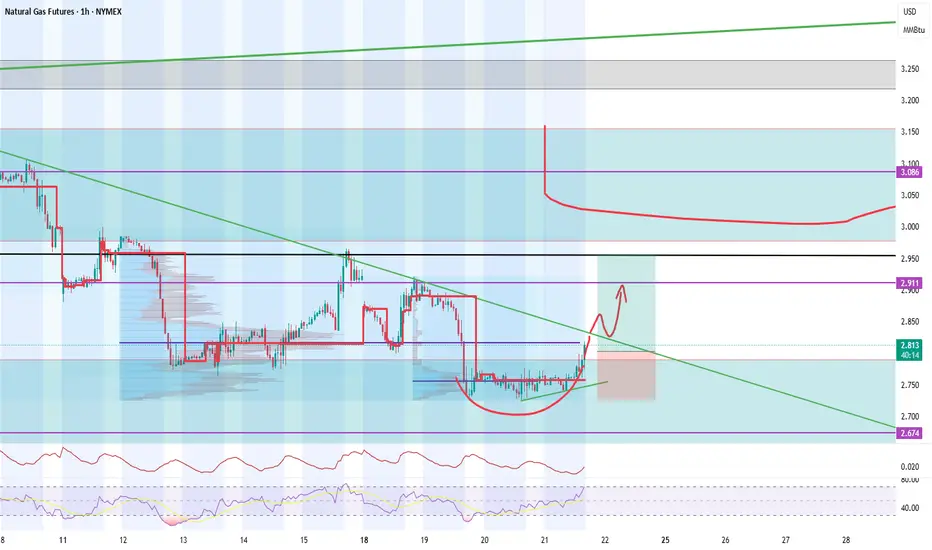
NATGAS - Potential UPI notice a support with a potential accumulation patter for a new phase UP until 3$
Natural Gas Equities Showing Relative StrengthNatural Gas was briefly red today but saw a bit of a bullish recovery.
Price action came very close to filling the weekly downside gap but just missed it.
Inventories are set to be released tomorrow at 10:30am
Interestingly, Nat Gas stocks like NYSE:AR & NYSE:EQT showed great relative strength in the market today.
Is this signaling a pop in Nat Gas price tomorrow?
We are long NYSE:AR calls from yesterday.

New Bear Market? Heavy Tech SelloffToday the markets were shattered by weakness in mega cap tech.
All major leading companies in the QQQ were severely down.
We saw the majority of the S&P 500 sectors green with health care leading the charge.
Despite all indices closing negative this was not a full fledge market sell.
Commodities were hit across the board. Gold, Nat gas, Oil, Uranium, Silver were all down.
It seems the market is de risking into J Powell Jackson Hole meeting on Thursday / Friday.
Today we closed out NASDAQ:MSFT NASDAQ:PLTR short & trimmed AMEX:MSOS puts for over 105%
We were very active on the option and swing trading side of the market.

Gold | Oil | Dollar | Silver | Natural Gas Price ForecastGold | Oil | Dollar | Silver | Natural Gas Price Forecast
COMEX:GC1! COMEX:SI1! AMEX:UNG NYMEX:CL1!

NATGAS Swing Short! Sell!
Hello,Traders!
NATGAS made a bearish
Breakout of the key horizontal
Level of 2.895$ while trading
In a downtrend so we are
Bearish biased and we will
Be expecting a further
Bearish continuation
Sell!
Comment and subscribe to help us grow!
Check out other forecasts below too!
Disclosure: I am part of Trade Nation's Influencer program and receive a monthly fee for using their TradingView charts in my analysis.

NATGAS BEARISH BREAKOUT|SHORT|
✅NATGAS is going down currently
As the price broke the key structure level of 2.90$
Which is now a resistance, and after the pullback
And retest, I think the price will go further down
SHORT🔥
✅Like and subscribe to never miss a new idea!✅

Natural Gas consolidates nearby support level of 3.0000Natural Gas consolidates nearby support level of 3.0000
U.S. Natural Gas has been declining since mid-June, forming the bullish wedge. Since the end of July 4-h RSI shows us bullish divergence, the price consolidates nearby the 3.0000 support level. The price is expected to rise towards 3.4000 level as a first target with 3.6000 as a final target. Additionally, according to seasonals, since the second half of the august, natural gas prices go bullish due to the beginning of the shoulder season, which may be an extra support factor for the asset.

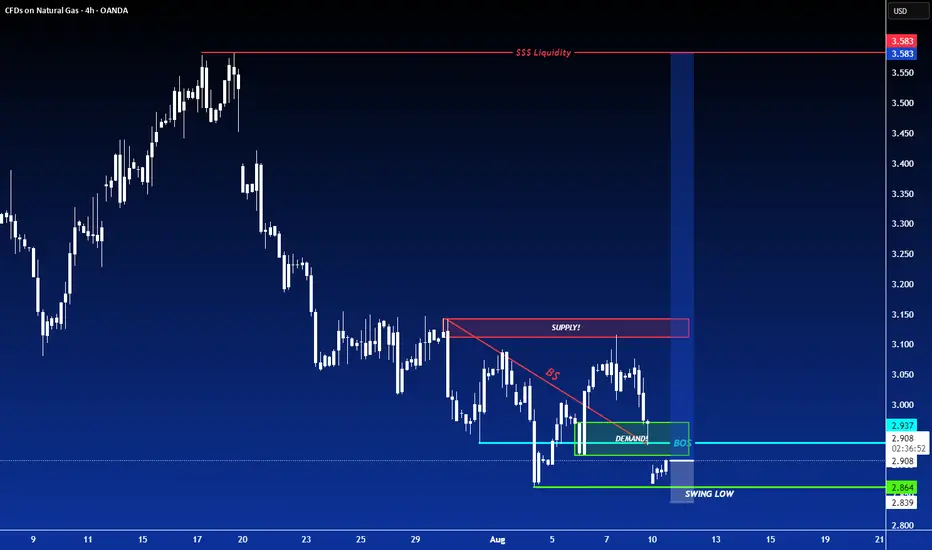
LONG ON NATURAL GASNatural gas has given us a nice CHOC (change of character) to the upside to start a upward move from a major demand zone.
I will be buying natural gas to the next level of supply.
Bullish Energy in Natural Gas: -DMI Extreme + Wedge BreakoutThe Spark in the Gas Market
Natural gas has been quietly simmering in recent weeks, building pressure beneath a surface of consolidation. Traders watching closely will have noticed a rare alignment — one that history shows can potentially precede outsized moves. We’re talking about the convergence of two powerful signals: a -DMI yearly extreme and a falling wedge breakout.
In the past, this combination has marked moments when bearish momentum had run its course, giving way to swift and decisive bullish reversals. Now, that same alignment is flashing again, inviting a closer look at the technical landscape and the potential opportunities it presents.
Why This Setup Matters
The -DMI (Directional Movement Index) measures the strength of downward price moves. When it pushes beyond two standard deviations above its yearly linear regression channel, it signals an overextended bearish phase. Historically, these extremes have often coincided with market bottoms in Natural Gas Futures.
Layer on top a falling wedge — a bullish reversal chart pattern — and the probability of an upside move gains weight. The wedge compresses price action into a narrowing range, reflecting reduced volatility and setting the stage for a potential explosive breakout once resistance gives way. The current breakout level sits near 3.18, with technical projections aligning closely to a well-defined UFO resistance (UnFilled Orders) zone around 3.90.
The Technical Story Unfolds
Looking at the daily chart in the present, the -DMI has recently breached the +2 standard deviation boundary of its 252-period regression channel — a rare occurrence that, as said, has preceded multiple major bullish reversals in the past year. When this condition appeared, downside momentum often faded, making room for buyers to take control.
This time, the current signal aligns with a falling wedge that has been developing for weeks. Price is about to break above the wedge’s upper boundary at approximately 3.18, suggesting a potential trend reversal.
The Trade Blueprint
Direction: Long
Entry: 3.18 (confirmed breakout above wedge resistance)
Target: 3.90 (wedge projection + UFO resistance)
Stop Loss: 2.858 (below wedge and technical support floor)
Reward-to-Risk Ratio: ~2+ to 1
This structure allows traders to define risk tightly while targeting a meaningful upside move. The setup applies equally to both Natural Gas Futures (NG) and Micro Natural Gas Futures (MNG), offering flexibility in capital allocation. For smaller accounts or those wanting to reduce margin exposure, the MNG contract delivers the same tick size precision with only one-quarter of the notional value.
The Contract Advantage
Natural Gas Futures (NG) represent 10,000 MMBtu per contract, with a minimum tick size of 0.00025 — equivalent to $2.50 per tick.
Micro Natural Gas Futures (MNG) are one-tenth the size at 1,000 MMBtu per contract, with the same 0.00025 tick size equaling $0.25 per tick.
Margin requirements vary with volatility and exchange adjustments, but at the time of writing, the CME lists initial margin for NG in the range of $3,500 per contract, while MNG margins are proportionally lower at $350 per contract. This creates flexibility for traders to scale positions or manage risk without altering the technical logic of the trade. Both contracts trade nearly 24 hours per day, Sunday through Friday, offering the ability to react to global energy market shifts in real time.
Risk Management as the Safety Valve
Defining risk is the cornerstone of any trade plan. The stop loss at 2.858 is not arbitrary — it sits below both the wedge’s lower boundary and a nearby technical support level. If price were to close below this level, it would undermine the bullish thesis and call for an exit.
Using smaller MNG contracts can help align risk with account size, allowing for partial position scaling and better drawdown control. Equally important is avoiding undefined risk scenarios, particularly in a commodity as volatile as natural gas. Precision in both entries and exits reduces exposure to intraday whipsaws while maintaining the trade’s structural integrity.
Closing the Loop
The natural gas market has aligned a rare set of conditions — a -DMI yearly extreme and a falling wedge breakout — each of which has historically preceded significant upside moves on their own. Together, they offer a compelling technical case for a defined, risk-managed long position targeting the 3.90 zone.
While no setup guarantees success, this one seems to offer clarity: a well-defined entry, stop, and target, supported by historical probability and pattern structure. In volatile markets, those moments of clarity are worth paying attention to — and acting on with discipline, and always depending on the trader’s trading plan.
When charting futures, the data provided could be delayed. Traders working with the ticker symbols discussed in this idea may prefer to use CME Group real-time data plan on TradingView: www.tradingview.com - This consideration is particularly important for shorter-term traders, whereas it may be less critical for those focused on longer-term trading strategies.
General Disclaimer:
The trade ideas presented herein are solely for illustrative purposes forming a part of a case study intended to demonstrate key principles in risk management within the context of the specific market scenarios discussed. These ideas are not to be interpreted as investment recommendations or financial advice. They do not endorse or promote any specific trading strategies, financial products, or services. The information provided is based on data believed to be reliable; however, its accuracy or completeness cannot be guaranteed. Trading in financial markets involves risks, including the potential loss of principal. Each individual should conduct their own research and consult with professional financial advisors before making any investment decisions. The author or publisher of this content bears no responsibility for any actions taken based on the information provided or for any resultant financial or other losses.

Gold | Oil | Dollar | Silver | Natural Gas Price ForecastGold | Oil | Dollar | Silver | Natural Gas Price Forecast
NYMEX:NG1! NYMEX:CL1! COMEX:GC1! COMEX:SI1!

"NATURAL GAS PRICE THEFT IN PROGRESS – JOIN THE HEIST!"🔥 XNG/USD HEIST – BEARISH LOOT AWAITS! SWIPE & ESCAPE BEFORE THE COPS ARRIVE! 🔥
🌍 Greetings, Fellow Market Robbers! (Hola! Oi! Bonjour! Hallo! Marhaba!) 🚔💸
🚨 Mission Briefing:
Based on 🔥Thief Trading Intelligence™🔥, we’ve identified a prime robbery opportunity in the XNG/USD (Natural Gas) Energy Market. Our Bearish Heist Plan is locked & loaded—long entries are a trap, and the real loot lies in the downside escape.
🎯 Heist Strategy:
Entry (Swipe the Loot!) 🏦
"The vault is cracked! Bears are distracted—time to steal!"
Sell Limit Orders preferred (15m-30m pullback entries).
DCA/Layering Strategy for maximum loot efficiency.
Stop Loss (Escape Route) 🚨
SL at nearest swing high (4H basis) – 3.480 (Day/Swing Trade)
Adjust based on risk tolerance, lot size, & number of orders.
Target (Police Evasion Zone) 🎯 2.900 (or earlier if cops close in!)
🔪 Scalpers’ Quick Heist:
Short-side scalp ONLY!
Big money? Go direct. Small stack? Join the swing robbers.
Trailing SL = Your Getaway Car! 🚗💨
⚡ Why This Heist? (Bearish Forces at Play)
Fundamentals: Oversupply, weak demand, storage glut.
Technicals: Overbought, trend exhaustion, reversal signals.
Sentiment: Bulls are overconfident—perfect trap setup!
📰 Breaking News Alert (Stay Sharp!)
High-impact news = Volatility spikes!
Avoid new trades during releases.
Trailing SL = Your Shield. (Lock profits before the cops raid!)
💥 BOOST THIS HEIST!
👉 Hit LIKE & FOLLOW to fuel our next robbery! More loot = More strategies! 🚀💰
⚠️ WARNING (Legal Escape Plan):
Not financial advice!
Your risk, your loot.
Markets change—adapt or get caught!
🤑 NEXT HEIST COMING SOON… STAY TUNED, ROBBERS! 🐱👤🔥

Natural Gas XNG: Trend Reversal or Just a Retracement?Natural Gas (XNG) has been trending bearish 🔻, but we’re now witnessing a bullish market structure shift ⚡— particularly visible on the 4H timeframe ⏱️. At present, price is overextended and pressing into a key resistance zone 📈🧱. I’m watching closely for a retracement back into equilibrium 🔄 within the previous price swing. This could offer a short-term scalp or day trade short setup 🎯.
Should price hold firm at support after the pullback 🛑, we could then begin building a bullish bias and look for long opportunities 📊— depending on how price action develops from there. 🚨 This is not financial advice.

U.S. Hot temperature boosted natural gas prices. For how long?U.S. Hot temperature boosted natural gas prices. For how long?
U.S. natural gas futures rose ~2% August 6 due to near-record LNG export flows and forecasts of hotter-than-normal weather through late August, boosting air conditioning demand and gas use by power plants (over 40% of U.S. electricity). Despite a hot summer, record production has kept gas stockpiles ~6% above normal, with storage likely to grow further.
Technically, price seems to form bullish wedge since mid - August. Price successfully tested the level of 3.0000, still can go on a retest of this level soon once again before some mid-term bullish momentum occurs. Additionally, according to seasonals, since the second half of the august, natural gas prices go bullish due to the beginning of the shoulder season.

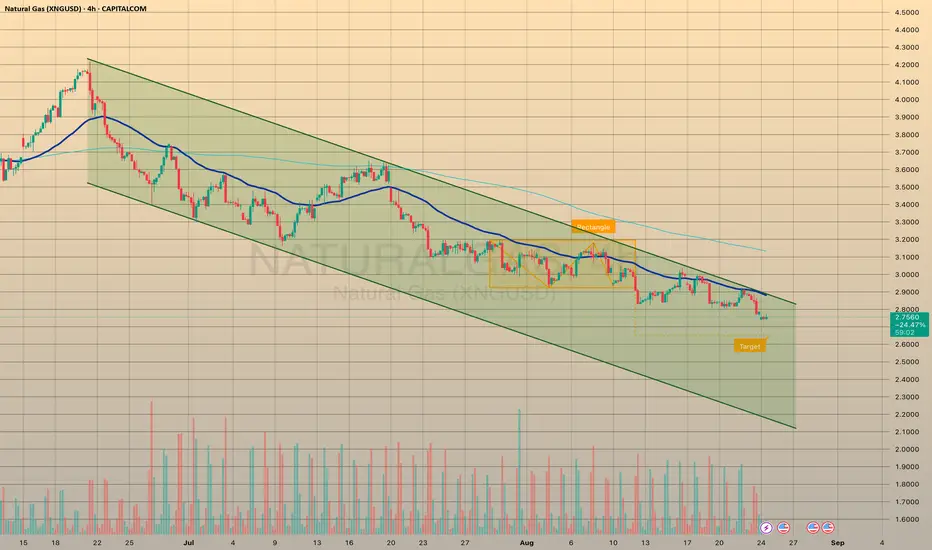
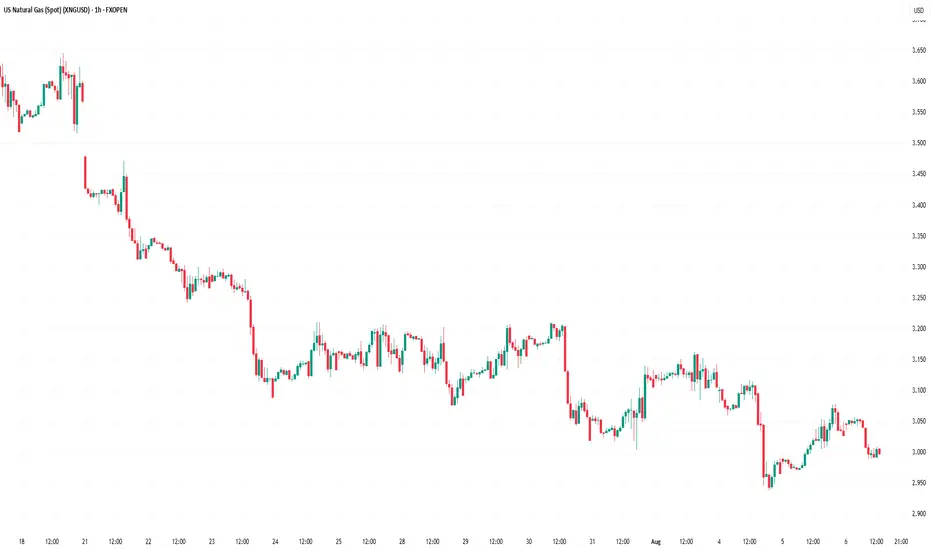
Natural Gas Prices Fall to Yearly LowNatural Gas Prices Fall to Yearly Low
Analysing the chart on 22 July, we constructed a descending channel and assumed that natural gas prices would continue to form a bearish market structure of lower highs and lower lows. Since then, the market has declined by almost 10%.
As the XNG/USD chart shows today, natural gas prices are hovering around the psychological level of $3.000/MMBtu. Earlier this week, gas was trading around $2.940/MMBtu — the lowest level of 2025.
According to media reports, the price decline is driven by both high production levels and favourable weather forecasts for August, the hottest month of the year. What might happen next?
Technical Analysis of the XNG/USD Chart
We have updated the descending channel, taking into account the recent fluctuations in natural gas prices.
The chart shows that bearish momentum remains intact — the rise from point B to C appears to be a corrective rebound within the prevailing downward trend, with the following developments:
→ point C formed in the 0.5–0.618 area, which corresponds to classic Fibonacci retracement levels following the A→B impulse;
→ the former support at 0.365 has now become resistance.
Bulls may hope that the current sentiment could shift following tomorrow’s natural gas storage report (scheduled for 17:30 GMT+3). A drop in inventories could potentially trigger a bullish impulse on the XNG/USD chart.
This article represents the opinion of the Companies operating under the FXOpen brand only. It is not to be construed as an offer, solicitation, or recommendation with respect to products and services provided by the Companies operating under the FXOpen brand, nor is it to be considered financial advice.
NG FUT long setupNG FUT long setup
Entry - 260.8
Stop loss - 260
Target - 267.4
Risk Reward - 1:11.3

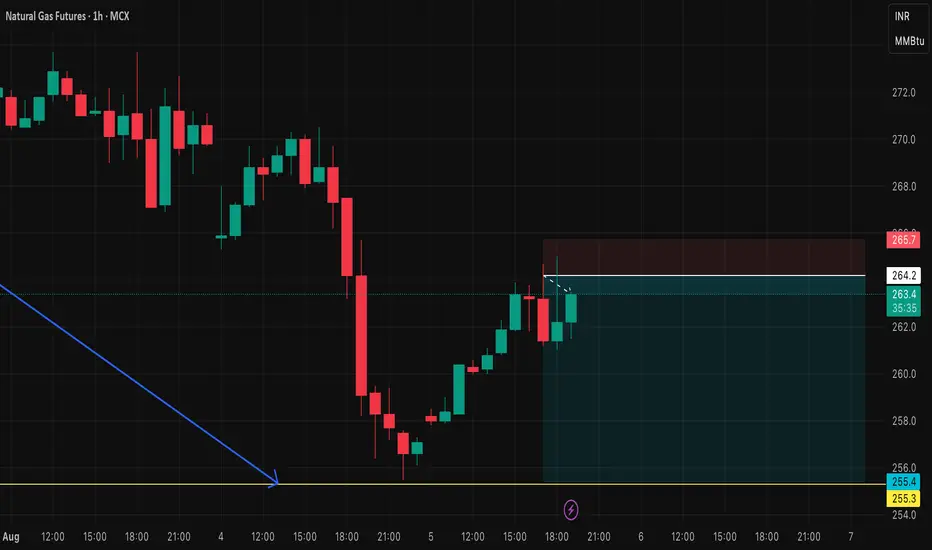
NF FUT short setupNG FUT short setup
Entry price - 264.2
Stop loss - 265.7
Target - 255.5
Risk Reward - 1:5.6