Very, Very, BearishThis market selloff is about to get a lot worse if the bulls do not put a floor under this market immediately.
If we close today below $618.50, forget it.
Most of the Mag7 are already broken.
QQQ has been held up by only 1 or 2 stocks trading sideways.
Good luck out there.
NASDAQ 100 CFD

Sell-Side Liquidity Was the ObjectiveCAPITALCOM:US100 Yesterday’s analysis played out clean and technical, with price respecting higher timeframe supply and failing to hold premium levels.
As i have shared on monday this week, the short side idea remains valid as long as price stays capped below key resistance.
📌 Higher Timeframe Context VANTAGE:NAS100 (Daily)
• Price remains inside a daily premium supply zone
• No daily acceptance above resistance
• Overall structure still range to bearish
• Recent upside move shows weak continuation characteristics
➡️ Daily Bias: Bearish below 26,000
📉 Intraday Structure (1H)
• Clear failure at equal highs
• Distribution forming below resistance
• Price rejected from mid-range equilibrium (BB / balance area)
• Discount PD array below remains unfilled
Liquidity has been taken on the upside, and price is now rotating back into range.
🔴 Short Scenario (Primary)
• Sell zone: 25,750 – 25,900
• Conditions:
• Price remains below resistance
• No strong bullish displacement
• Targets:
• 25,650 (range low)
• 25,400 (discount / liquidity)
• Extended: 25,250
This aligns with the short idea shared earlier this week and remains the higher probability path.
🟢 Long Scenario (Secondary / Conditional)
• Valid only if price reclaims and accepts above 25,900
• Requires:
• Strong bullish displacement
• Holding above prior highs
• Upside targets:
• 26,000
• 26,050+
⚠️ No conviction longs while price trades below supply.
❌ Cancellation / Invalidation Levels
• Short bias invalidated if:
• 1H close above 26,050
• Acceptance above daily supply
• Long bias invalidated if:
• 1H close below 25,600
🎯 Final Expectation
Market continues to respect premium supply, confirming that patience at higher prices pays.
As long as price remains below daily resistance, Sell-Side reactions are favored , with liquidity resting lower.
Patience at premium. Execution at reaction.
Not financial advice.
Risk management is mandatory.

AMD Pullback Complete? Momentum Signals Say Watch Closely🚀 AMD – NASDAQ | Market Profit Playbook (Swing Trade)
🎯 Bullish Layered Entry Setup + Macro Factors
📌 Asset: Advanced Micro Devices, Inc. (Ticker: NASDAQ:AMD • NASDAQ Equity)
📈 Setup Type: Bullish Swing Play — Momentum + Pullback + Macro Support
📊 Timeframe: Swing / Multi-session
📍 Trade Plan — Bullish Thief Strategy (Layer Entries) 💰
Market Bias: Bullish continuation confirmed when price respects strong moving average pullback levels and accumulates buyers.
Strategy: Thief Style Layered Buy Limits 🧵
🔹 Buy Zones (Layered Limit Entries):
• 🛒 Layer 1: 205.00
• 🛒 Layer 2: 210.00
• 🛒 Layer 3: 215.00
• 🛒 Layer 4: 220.00
(You may extend layers above or below based on market context & risk tolerance)
💡 Layered limit orders help scale into the position during volatility and liquidity troughs for smoother basis.
🎯 Targets & Exits
📌 Primary Target: ~260.00 🚀
• Psychological resistance & overbought trap zone 👮♂️ — profit taking recommended as momentum stalls.
• Adjust partial exits as price approaches key levels.
⚠️ This is a range target — feel free to scale in/out based on price action, RSI divergence, trend strength.
🚨 Risk Management
🔻 Stop Loss: 195.00 — risk defined zone below major support.
📌 You choose your own SL — manage risk as per your trading plan.
🔍 Why This Setup Matters (Realtime Catalysts)
📊 Fundamental & Macro Drivers
🧠 AI and Data Center Demand: AMD’s data center business continues to expand with strong AI GPU & EPYC CPU adoption; record Q3 2025 revenue + partnerships with OpenAI & Oracle boost structural growth narrative.
💼 Strong Analyst Support: KeyBanc and other analysts reaffirm overweight views with robust targets, reflecting rising hyperscaler demand.
📈 Sector Momentum: Broader Nasdaq strength driven by tech & AI sentiment supports semiconductor plays like AMD.
🌍 Economic Factors to Watch
📊 Semiconductor Market Growth: Global market projected to expand significantly by 2025-26, fueled by AI, HPC & cloud infrastructure.
💡 Inflation / Cost Pressures: Ongoing inflation & supply chain costs continue to impact margins — track CPI & producer price data for risk gauges.
📉 Interest Rates: Any shifts in Fed policy or rate expectations can influence tech valuations quickly — watch upcoming FOMC dates.
🔗 Related Pairs / Correlations to Watch
🪙 Tech & Semiconductor Peers
• NASDAQ:NVDA (NVIDIA) — closely correlated AI / GPU leader
• NASDAQ:INTC (Intel) — fundamental demand indicator for chip cycle
• NASDAQ:AVGO (Broadcom) / NASDAQ:MU (Micron) — memory & connectivity cues
💡 Strength in peers often supports AMD momentum — divergence may signal rotation or sector rebalancing.
🛠 Technical Edge + Trader Sentiment
📌 Momentum Confluence:
• Pullbacks to key moving averages often trigger institutional buy pressure.
• Layered entries capture volatility while smoothing risk.
📌 Oscillators:
• Overbought RSI warns of profit zones near targets — taper positions accordingly.
📌 Market Structure:
• Watch for higher highs & higher lows formation for trend confirmation.
❗ Notes for Traders
• This is a plan template — adapt based on live price action.
• Always adjust layers, risk, and targets based on volatility & liquidity.
• Disclaimer: This is Thief style setup with fun rhythm — your execution + risk discipline matters.
✨ “If you find value in my analysis, a 👍 and 🚀 boost is much appreciated — it helps me share more setups with the community!”
📌 Disclaimer: This is thief style trading strategy just for fun.

Are tech stocks about to surge? Nasdaq New Highs? The market is very close to making a big move.
We believe the market is still bullish and will likely trend higher.
Today crypto was strong when the market was weak. This could be signaling tech is about to capture some bullish liquidity.
Banks got decimated today, which allows lots of capital to rotate back into tech.
The Nasdaq is lagging and the only indices to not make new all time highs.

NASDAQ Testing 1 month Resistance. Break or rejection?Nasdaq (NDX) has been on a Higher Lows uptrend since the November 21 2025 bottom but following the December 05 high, it has failed to break above that 25830 Resistance (1) on 5 tests. Today it is attempting it for the 6th time.
A break and 1D candle closing above Resistance 1 then, will confirm the bullish break-out of that Ascending Triangle and transitioning into a Channel Up. If it maintains a high symmetry with the first one (+4.31%) then we expect to see 26150, falling just below Resistance 2 (26260) and the All Time High.
If however the price gets rejected again on Resistance 1 (close a candle below it), the minimum Target would be the 4H MA200 (orange trend-line) at 25450, falling just above the 0.618 Fibonacci retracement, which is the level that all Higher Lows since November 21 approached.
It has to be noted at this point that the 1D RSI is now hitting the Lower Highs trend-line that started on September 22 2025. If rejected here again, the market will confirm a huge Bearish Divergence that can shift the long-term trend to bearish.
---
** Please LIKE 👍, FOLLOW ✅, SHARE 🙌 and COMMENT ✍ if you enjoy this idea! Also share your ideas and charts in the comments section below! This is best way to keep it relevant, support us, keep the content here free and allow the idea to reach as many people as possible. **
---
💸💸💸💸💸💸
👇 👇 👇 👇 👇 👇

Nasdaq - Tech is rallying during 2026!💰Nasdaq ( TVC:NDQ ) is remaining totally bullish:
🔎Analysis summary:
The Nasdaq and the entire tech sector is about to finish a very strong year of 2025. Going into 2026, market structure remains totally obvious and is clearly showing massive upside potential. Every major dip, especially going into 2026, leads to a massive buying setup.
📝Levels to watch:
$25,000 and $21,000
SwingTraderPhil
SwingTrading.Simplified. | Investing.Simplified. | #LONGTERMVISION

AAPL: The 30% Rule — Why Apple’s Next True Low Likely at 200 USD🍎 AAPL WEEKLY SNAPSHOT — EXECUTIVE SUMMARY
✨ Apple Inc. is entering the late phase of a multi-year corrective cycle
📉 Primary thesis: A ~30% correction is still unfolding, consistent with prior Apple macro drawdowns
🏛️ Macro backdrop: Dow Jones Industrial Average extended near psychological 50,000 → late-cycle risk elevated
⏳ Timing focus: 2025 distribution → 2026 corrective low
🎯 Projected downside target: $200 ±10 macro support + valuation reset
________________________________________
🔍 Why the 30% Correction Matters Historical Fractal Logic
Apple has repeatedly respected ~30% drawdowns during secular bull markets — not crashes, but controlled re-ratings:
• 📌 2021 → 2022:
• High → Low ≈ -30%
• Trigger: tightening cycle + growth multiple compression
• Outcome: strong multi-quarter recovery
• 📌 2024 → 2025:
• High → Low ≈ -30%
• Trigger: AI-led over-extension + index concentration risk
• Outcome: range repair, not trend resumption
• 📍 Current Cycle (2025 → 2026):
• Structure suggests another proportional leg
• Distribution at highs → rolling lower highs → trend exhaustion
• Measured move from 286 ⇒ ~200 aligns with historical symmetry
📐 Market logic: Apple doesn’t usually collapse — it compresses.
________________________________________
🧱 Key Technical Zones Weekly / Monthly
• 🔺 286–280: Macro ceiling / cycle high (distribution complete)
• ⚖️ 245–235: Mid-range congestion (temporary reactions possible)
• 🟨 215–200: High-probability terminal support zone
• 🚨 Invalidation (bear thesis): Sustained acceptance above 286
________________________________________
🧠 Macro Confluence Why 2026 Matters
• 📊 DJIA near historic extension → mean reversion risk rising
• 💰 Passive flows crowded into mega-caps (AAPL = core holding)
• 🧮 Valuation sensitivity at cycle peaks historically resolves via price, not time
• 🕰️ Apple corrections often lag index tops, bottoming after broader sentiment breaks
________________________________________
🎯 Strategic Trade Framework
• ❌ Avoid chasing long exposure at highs
• 🧘♂️ Expect volatility + range expansion before clarity
• 🛒 Best long-term accumulation: only near 200 zone, not earlier
• 🧭 Tactical traders may short rallies below 280 with tight risk
• 🏦 Post-2026: High-quality reset likely sets up next secular advance
________________________________________
🗳️ AAPL Weekly Scenarios — Levels Quiz
Which path do you see next?
🅰️ Hold above 245 → extended range before final breakdown
🅱️ Break 235 → acceleration toward 215–200 macro support
🅲 Flush to ~200 in 2026 → generational accumulation window
🅳 Your level: comment the one price that changes your bias

$NDX Move Higher to ATHNASDAQ:NDX broke out of the near term descending trendline. Looking for a continuation and move to ATH.

NASDAQ is on the verge of collapse.Nasdaq (NDX) completed its 'Santa rally' on December 26 and since then it's been pulling back, breaking below the 1D MA50 (blue trend-line), despite today's early rise in the aftermath of Maduro's capture over the weekend.
Technically, it is repeating the Cycle Top formation of 2021. That was achieved under a Lower Highs trend-line, which as soon as the very first week of 2022, started a violent correction that extended well beyond the 1D MA200 (orange trend-line), making a first stop on the 2.618 Fibonacci extension, before a dead-cat-bounce kicked in.
Right now, the latest Lower High was that 'Santa rally' and since we've just started the first week of 2026, there are high probabilities that a new collapse will begin. Even the 1D RSI comes to confirm this, being very similar to that of late 2021.
If the market repeats the 2022 Bear Cycle, then we are looking at a first Low at 21000 (Fib 2.618) by March.
---
** Please LIKE 👍, FOLLOW ✅, SHARE 🙌 and COMMENT ✍ if you enjoy this idea! Also share your ideas and charts in the comments section below! This is best way to keep it relevant, support us, keep the content here free and allow the idea to reach as many people as possible. **
---
💸💸💸💸💸💸
👇 👇 👇 👇 👇 👇

US100 / NDX - Bullish setup for 2026. Look at this 12M yearly candle chart of NDX, Text book setup of bullish as per volume and PA. Max volume buyers for the year at bottom 20% of candle, they managed to close the candle as bullish big body hammer. So 2026 - Possible liquidity grab at FVG fill and head higher, so watch out for bigger stocks level NVDA near154, NFLX near 80 an tesla near 380... when all dots connect rocket should fire for huge run of 2026. We don't know where we will close for 2026 at the moment, but there will be good run for upside. Until this dots connect expect choppy action. BTC may also fill 75k level when these dots connect.

SELLside Liquidity got Cleaned Below...VANTAGE:NAS100 price is trading below the major supply band at 25,800 – 26,000.
This zone is the origin of the last impulsive sell-off and remains unmitigated supply.
As long as price stays below 26,000, the higher-timeframe bias remains bearish 🐼
On H1, market structure confirms this bias:
• Lower highs
• Weak reactions from demand
• Repeated failures below supply
The recent sell-off cleaned sell-side liquidity below 25,300, followed by a sharp reaction.
This move is not accumulation.
It is a liquidity grab followed by a corrective pullback.
🦈 Scalp
While the higher-timeframe bias remains bearish, a short-term scalp long 🦖 is possible only after a clear rejection from OG demand zones on lower timeframes.
• Sell-side liquidity already taken
• Execution strictly based on M15 / M5 / M3
Scalp activation criteria (OG Concept) on M15 / M5 / M3:
• Price taps OG demand zone
• Clear rejection from the OG zone (wick + displacement)
• Momentum shift with follow-through
• Failure to continue lower after the liquidity sweep
Scalp plan:
• Long only after OG zone rejection is confirmed
• Target: 25,480 – 25,520 (≈ 25,500 supply)
• This move is reactional, not a trend reversal
📌 No OG rejection = no trade.
🔴 Primary Scenario
Main idea: SELL the pullback
• Key supply zone: 25,480 – 25,520
• This zone aligns with:
• H1 supply
• Prior breakdown area
• Premium pricing within the current range
Execution logic:
• Price reaches supply
• Momentum weakens
• Rejection / failure to hold above the zone
• Continuation to the downside
Targets:
• 25,300 → partial profit
• 25,250 → liquidity retest
• 25,180 – 25,200 → extension
❌ Invalidation
• M15 close above 25,550
• Acceptance above supply invalidates the short idea
🧠 Smart Money Logic (OG Concept)
• Panic sell triggers liquidity
• Sell-side gets cleaned
• Price is pushed back into premium
• Retail chases the bounce
• Smart money distributes into supply
Two-phase play:
• Reaction long → into supply
• Distribution short → continuation dump
Bias remains sell-side while price trades below higher-timeframe supply.

NASDAQ doesn’t move randomly. It hunts liquidity.CAPITALCOM:US100 Price is currently trading inside a broken OG zone, after a clear distribution phase from the premium area.
Market structure remains bearish, with lower highs and weak upside reactions.
Short-term outlook (15M)
• Price failed to hold above the broken OG zone
• No strong bullish displacement or acceptance above resistance
• Liquidity is still resting below current price
• Expectation: continuation to the downside to sweep short-term liquidity
Mid-term outlook (1H)
• Overall structure remains bearish
• Previous OG zone acting as resistance
• Unfilled liquidity remains below the range lows
• As long as price stays below the broken zone, shorts remain valid
My expectation
I expect price to take the liquidity below and deliver a minimum 50-point drop from the current levels.
Any pullback into the broken OG zone can be considered a sell opportunity, as long as structure does not shift.

NASDAQ 100 INDEX: Trade on the Long-Side, Breakout Incoming.Hello There,
the NASDAQ 100 INDEX recently formed interesting formational structures which caught my attention. Following the underlying price-actions a trade signal on the long-side is generated. Important here is to wait for the breakout above the neckline of the inverse head-and-shoulder formation.
__________________________________________________________________________________
REASON: Inverse head-and-shoulder formation, structural MA-bullishness, strong volume spikes.
__________________________________________________________________________________
Trade on the Long-Side Potential
ENTRY: 25600 - 25700
MINIMUM TARGET: 26200
EXPECTED TARGET RANGE: 26300 - 26500
MINIMUM STOP LOSS: 25200
__________________________________________________________________________________
In this manner, thank you for watching and happy new year!
__________________________________________________________________________________

Breaking: Antelope Enterprise Holdings Limited (AEHL) Surge 90%The shares of Antelope Enterprise Holdings Limited (NASDAQ: NASDAQ:AEHL ) surge over 90%. The asset is set to breakout of a bullish symmetrical triangle. With the RSI at 50, this gives more room for NASDAQ:AEHL to capitalize on the bullish spike.
In recent news, Antelope Enterprise Holdings Limited (NASDAQ: AEHL), today announced that its board of directors has approved a change of the Company’s fiscal year end from December 31 to September 30.
The Company plans to file a transition report on Form 20-F for the transition period of January 1, 2025 through September 30, 2025. The Company’s 2026 fiscal year will begin on October 1, 2025 and end on September 30, 2026.
CEO Ms. Tingting Zhang, stated: “This fiscal year change is intended to better align our reporting cycle with the Company’s operational and financial planning needs. We remain committed to high standards of financial reporting, transparency, and compliance.”
About AEHL
Antelope Enterprise Holdings Limited, through its subsidiaries, provides livestream e-commerce, and business management and information systems consulting services in the People's Republic of China and the United States. The company operates social media and various e-commerce platforms. It also provides business management consulting; information system technology consulting services, including the sales of software use rights for digital data deposit platforms and asset management systems.

Nasdaq 100 Index - Analysis & ProjectionBased on the current upward trajectory and the alignment of moving averages, the Nasdaq 100 Index is likely to continue its bullish trend in the near term, potentially testing the 26,000 level by mid-January 2026 if momentum persists. However, a pullback could occur if the RSI approaches overbought territory (above 70), possibly around the 25,800 resistance level. Long-term, the index may aim for 27,000 by mid-2026, assuming sustained economic growth and favorable market conditions, though external factors like interest rate changes or geopolitical events could introduce volatility.

$NDX Next Leg Higher ComingCalled for a Santa Rally for NDX to 25710 which hits nicely and price stalled there (). Market sold down but overall, there is nothing bearish. Looking for a move higher, with 26125 next,

NASDAQ Will this rejection lead to a bearish 2026 opening?Nasdaq (NDX) just got rejected on the Lower Highs trend-line that started after its October 30 All Time High (ATH). With the 4H RSI also rejected on its own Lower Highs trend-line and the 4H MACD forming a Bearish Cross already, we expect this to be the start of a new Bearish Leg, similar to the previous two that followed such Lower Highs rejections.
As a result, the most likely scenario as long as this trend-line remains intact, is for the index to approach the 1D MA100 (red trend-line) again. We expect it to hit at least 24800.
---
** Please LIKE 👍, FOLLOW ✅, SHARE 🙌 and COMMENT ✍ if you enjoy this idea! Also share your ideas and charts in the comments section below! This is best way to keep it relevant, support us, keep the content here free and allow the idea to reach as many people as possible. **
---
💸💸💸💸💸💸
👇 👇 👇 👇 👇 👇

NAS100 Shows Strong Bullish Structure After Pullback📈 NASDAQ100 (NAS100) | Bullish Swing Trade Opportunity 🎯
Market Trade Opportunity Guide — SMA Pullback Strategy
🔥 TRADE SETUP SUMMARY
Asset: NAS100/US100 (NASDAQ-100 Index)
Timeframe: Swing Trade
Strategy: Bullish Simple Moving Average (SMA) Pullback
Bias: 🟢 BULLISH CONFIRMED
📍 ENTRY POINTS
Flexible Entry Strategy:
✅ Any price level entry acceptable (DCA approach recommended)
✅ Optimal entry zones: SMA support pullback levels
✅ Consider scaling into positions on dips
✅ Volume confirmation at entry crucial for momentum
🛑 STOP LOSS MANAGEMENT
Primary SL Level: 25,200
⚠️ DISCLAIMER: This is a reference level only. Adjust your stop loss based on:
✓ Your personal risk management strategy
✓ Individual account risk tolerance
✓ Position sizing preferences
✓ Your trading experience & capital allocation
Your responsibility: Set SL that fits YOUR risk profile. Don't rely solely on suggested levels.
🎯 PROFIT TARGETS
Primary Target: 26,100
Key Resistance Factors:
📊 High voltage resistance zone
📈 Overbought conditions detected
⚡ Trap risk at elevated levels
💡 Recommend: Take partial profits, don't go all-in
⚠️ DISCLAIMER: TP level is reference only. Manage profits based on:
✓ Your personal trading objectives
✓ Risk/reward ratio preferences
✓ Market momentum confirmation
✓ Your own technical analysis
Exit Strategy: Capture gains systematically. Don't be greedy—take money when available.
📊 RELATED PAIRS TO MONITOR (Correlation Analysis)
Major USD Pairs to Monitor:
EUR/USD 💶 — Current: 1.1713 | Bias: 🔵 Bearish $ | Correlation: INVERSE (Risk sentiment driver)
GBP/USD 🇬🇧 — Current: 1.3381 | Bias: 🔵 Bearish $ | Correlation: INVERSE (Tech growth proxy)
USD/JPY 🇯🇵 — Current: 155.00 | Bias: 🟢 Bullish $ | Correlation: INVERSE (Carry trade impact)
USD/CAD 🇨🇦 — Current: 1.38 | Bias: 🔵 Bearish $ | Correlation: INVERSE (Risk-off correlation)
Correlation Insights:
Weaker USD = Better for tech stocks (positive NAS100). Stronger JPY carry = Risk-off mood (negative NAS100). Watch EUR/USD & GBP/USD for broader sentiment shifts—these are your early warning indicators for tech sector rotation.
🌍 FUNDAMENTAL & ECONOMIC FACTORS (December 2025)
Fed Monetary Policy 🏦
✅ Latest Decision (December 10, 2025):
Rate cut: 25 basis points (0.25%)
New target range: 3.50%-3.75%
3rd consecutive rate cut in 2025
Divided vote: 9 for cuts, 3 dissenting
Market Implication: Powell signals "patience" on further cuts—limited cuts expected in 2026 (only 1-2 projected). This is a headwind for aggressive tech rallies but supports intermediate tech strength.
Inflation Status 📊
PCE Inflation (September 2025): 2.8% (above 2% target)
Trend: Inflation moved UP since earlier 2025, remains "somewhat elevated"
Outlook: Expected to remain above 2% through 2026
Tariff Risk: Trump tariffs expected to push inflation higher in 2026
Market Implication: Persistent inflation limits Fed's ability to cut rates aggressively. Tech valuations face pressure from higher rates. Expect volatility from tariff-related inflation surprises.
Employment & Labor Market 👥
Job gains: Slowed significantly in 2025
Unemployment rate: Edged up through September (at 4.4%)
Fed assessment: "Downside risks to employment rose in recent months"
Tone: Labor market showing weakness, supporting rate cuts
Market Implication: Weaker jobs data = positive for equities (lower rates). But lack of October/November data due to govt shutdown creates uncertainty going into 2026.
Economic Growth 📈
GDP Growth (Fed projection 2026): 2.3% (raised from 2.0%)
Current pace: "Moderate expansion" of economic activity
Outlook: Modest growth expected, not recessionary
Market Implication: No recession expected. Growth supports equity rallies like NAS100, but tariffs could dampen 2026 growth trajectory.
Key Macro Risks for 2026 ⚠️
Tariff Impact: Trump tariffs likely to increase inflation and reduce growth
Rate Uncertainty: Fed Chairman succession unclear; policy direction murky
Government Data Gaps: October/November data delayed; information asymmetry high
Market Expectations Divergence: Fed members divided on future rate path
Bond Yields: Higher yields = headwind for high-multiple tech stocks
📅 KEY UPCOMING EVENTS TO WATCH
January 2026: Fed Chair decision; delayed employment/inflation data releases
Q1 2026: Tariff implementation timeline clarity
2026 FOMC Meetings: Only 1-2 rate cuts priced vs. 3+ in 2025
🎯 TRADE BIAS CONCLUSION
Technical: 🟢 Bullish (SMA support confirmed)
Macro: 🟡 Cautious (Fed pause, tariff uncertainty)
Composite: 🟢 BUY dips toward 25,200 | Target 26,100 | Manage risk aggressively
📌 RISK DISCLAIMER
✅ All trading involves risk. No guarantees on outcomes.
✅ Past performance ≠ future results
✅ Use proper position sizing & risk management
✅ Trade with only capital you can afford to lose
✅ This is analysis, not financial advice

NASDAQ One final Santa push??Nasdaq (NDX) is rebounding today on its 1H MA50 (blue trend-line), capitalizing on the short 6-day Channel Up that it's been trading in.
With a 1H MACD Bullish Cross confirming the start of the new Bullish Leg, we can expect at least a +2.11% rise (similar to the 1st Bullish Leg) on this one, targeting 25900, as part of the final 'Santa rally' push.
---
** Please LIKE 👍, FOLLOW ✅, SHARE 🙌 and COMMENT ✍ if you enjoy this idea! Also share your ideas and charts in the comments section below! This is best way to keep it relevant, support us, keep the content here free and allow the idea to reach as many people as possible. **
---
💸💸💸💸💸💸
👇 👇 👇 👇 👇 👇

NASDAQ NAS100 Technical Analysis and Trade IdeaThe NAS100 is currently in a strong bullish trend 🚀. Price has been pushing higher with momentum and is now trading into a key resistance zone. We could see a short-term pullback as traders lock in profits, but overall, the trend looks ready to continue ↗️.
Keep an eye on any market-moving events later today—they could either accelerate the trend or trigger a deeper retracement. If the bullish momentum holds, a pullback might offer a good opportunity to join the trend for a continuation trade 💪.
⚡ Key Points:
NAS100 trending bullish 📈
Approaching resistance, watch for pullback ↘️
Potential continuation trade on strength 🔥

NDX - Nasdaq 100 index in long term Uptrend channel. Since 2009, NDX - Nasdaq 100 index in long term Uptrend channel.
The blue resistance is very weak (only two points of contact), and not technically speaking an established trend line yet. Purple lines are strong trendlines.

Can PepsiCo Extend Higher Following This Technical Breakout?📈 ASSET OVERVIEW
Asset: NASDAQ:PEP — PEPSICO, INC
Exchange: NASDAQ
Market Type: Stock
Trading Style: Swing Trade
🧠 TRADE THESIS (BULLISH BIAS)
NASDAQ:PEP has activated a bullish structure following a Triangular Moving Average (TMA) breakout, signaling a potential trend continuation phase.
Price action confirms:
Higher lows structure 📊
Momentum expansion after consolidation
Breakout supported by trend-following averages
This setup favors controlled accumulation, not chasing.
🎯 ENTRY PLAN — STEALTH LAYERING STRATEGY
Instead of a single fixed entry, this plan uses a layered limit order approach to manage volatility and improve average price.
🔹 Layered Buy Limits (Example):
150.00
148.00
147.00
146.00
📌 You may add or adjust layers based on personal risk management and market volatility.
📌 Entry can also be taken at any price level depending on confirmation and execution style.
This method helps:
Reduce emotional entries
Improve risk-adjusted positioning
Adapt to pullbacks without panic
🛑 RISK MANAGEMENT (STOP-LOSS)
Protective Stop: 144.00
⚠️ Risk management is always trader-dependent.
This stop is a reference level, not a mandatory rule.
Adjust based on:
Account size
Risk tolerance
Timeframe preference
🎯 PROFIT OBJECTIVE
Primary Target: 158.00
This zone aligns with:
Strong historical resistance
Overbought conditions
Potential liquidity trap area
📌 Partial profit booking is encouraged near resistance.
📌 Capital protection > maximum profit.
🔍 ADDITIONAL CONFIRMATIONS TO WATCH
Volume expansion on continuation
Price holding above breakout structure
No aggressive bearish rejection near resistance
🔗 RELATED SYMBOLS TO WATCH (CORRELATION CHECK)
NYSE:KO (Coca-Cola) → Sector strength confirmation
AMEX:SPY → Overall market risk sentiment
AMEX:XLP → Consumer Staples sector momentum
📊 If AMEX:XLP & NYSE:KO remain strong, probability increases for NASDAQ:PEP follow-through.
⚠️ IMPORTANT NOTES
This is not financial advice
Market conditions can change rapidly
Always align execution with your personal trading plan
✨ “If you find value in my analysis, a 👍 and 🚀 boost is much appreciated — it helps me share more setups with the community!”
Disclaimer: This is a stealth-style trading strategy shared for educational and entertainment purposes only.
#PEP #PepsiCo #SwingTrading #NASDAQ #BullishBreakout
#LayeredEntry #TechnicalAnalysis #Stocks #TradingView

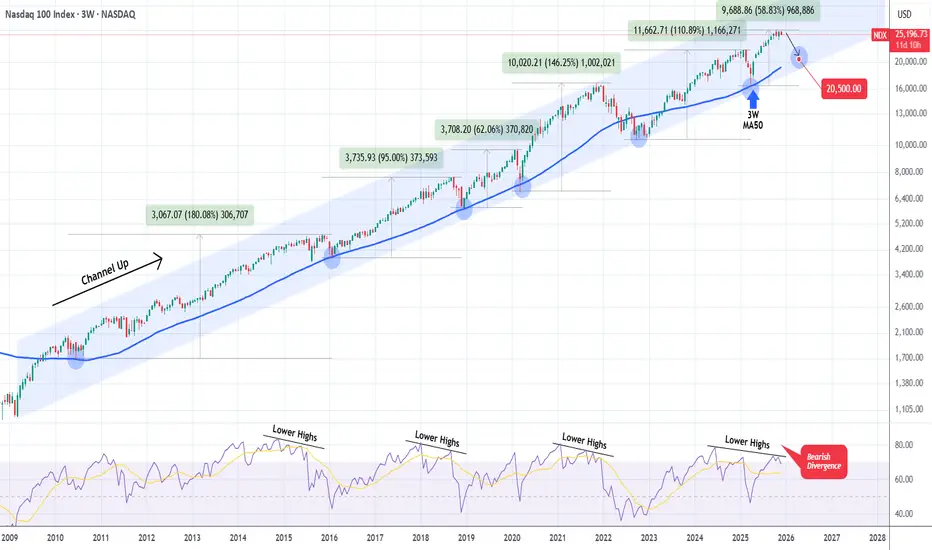
NASDAQ Time to correct hard until it reaches this level again.Exactly 6 months ago (June 20, see chart below), we posted the following analysis on Nasdaq (NDX), which helped us ride the rally following the April 07 2025 market low:
The reasoning behind this was that Nasdaq's low was on its 3W MA50 (blue trend-line), a key Support level which since 2009 and the start of the market's dominant multi-year Channel Up following the 2008 Housing Crisis, has offered 5 perfect long-term buy entries upon contact, only breaking once during the 2022 Inflation Crisis.
Now that the 3W RSI is displaying a Lower Highs Bearish Divergence (against the price's Higher Highs) that has been formed on another 3 prior Cycle Tops, we expect the market to start reversing soon for another cyclical correction. Technically another Bearish Leg for the dominant Channel Up.
Naturally, we expect it to reach at least the 3W MA50 again. Based on its trajectory, it is possible for contact to be made around 20500. Keep in mind again that absolute pricing isn't the important thing here, timing is. The most optimal time to buy based on this high accuracy model, is upon contact with the 3W MA50, regardless of the price it is at, so don't get fixed on 20500, but it is a fair projection based on the trend.
---
** Please LIKE 👍, FOLLOW ✅, SHARE 🙌 and COMMENT ✍ if you enjoy this idea! Also share your ideas and charts in the comments section below! This is best way to keep it relevant, support us, keep the content here free and allow the idea to reach as many people as possible. **
---
💸💸💸💸💸💸
👇 👇 👇 👇 👇 👇