uptrendThe triangle pattern is expected to continue along the specified paths. Then, with the completion of the corrective pattern, the start of an upward trend is likely.
Neo Wave

correctionIt is expected that the correction trend will form to the specified support area. Then, there will be a possibility of a trend change. If the price crosses the red support area, the continuation of the downward trend to the support trend line area will be possible.

possibility of uptrendThe price is expected to cross the resistance trend line and advance to the specified resistance area. Then, considering the price behavior in the resistance area, possible scenarios have been identified.
check the trendWith the support trend line break, the continuation of the downward trend will be likely. Then, considering the price behavior in the specified support area, there is a possibility of a trend change and the start of an upward trend.

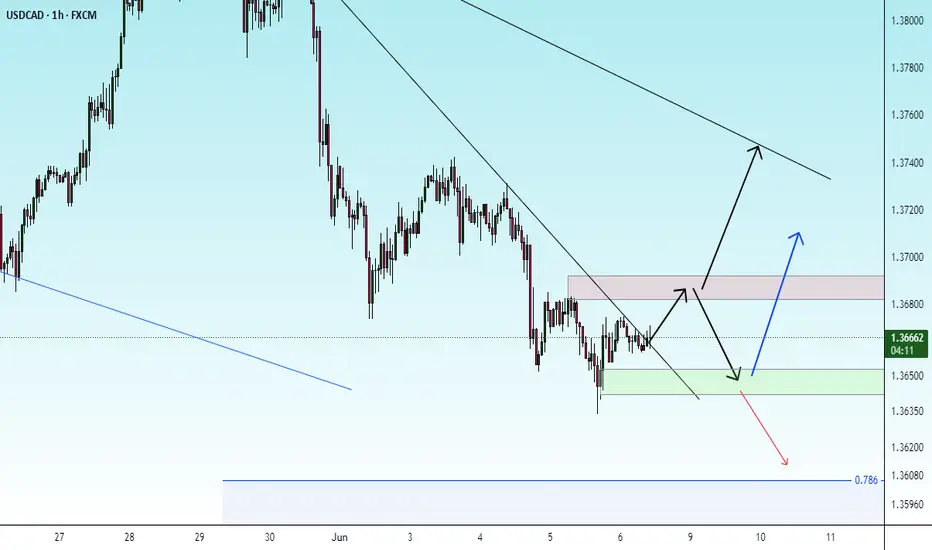
check the trendIt is expected that a trend change will form within the current support line, then there is a possibility of a trend change and the start of an uptrend. The support area break will cause the continuation of the downward trend.

correctionIt is expected that we will see price fluctuation within the current support line, then there is a possibility of a trend change and the start of an uptrend. If the price breaks through the support line, the downtrend will continue to the next support line.

possibility of uptrendIt is expected that a trend change will form within the current support line and we will see the start of an uptrend. If the price breaks through the support line, the downtrend will continue.

uptrendThe trend change is expected to form within the current support area and we will witness the start of an upward trend. A break of the resistance trend line will be a confirmation of the upward trend.
If the price breaks through the red support line, the downtrend is likely to continue.

check the trendGiven the 161.8% level being broken, the continuation of the downward trend and correction is likely.
As long as the price fluctuates below the red resistance area, the continuation of the downward trend is likely.

possibility of uptrendThe correction trend is expected to continue to the specified support area. Then there is a possibility of a trend change and the start of an upward trend.
If the price breaks the green support area, the continuation of the downward trend is likely.

BTC Dominance New Update (12H)We are truly at a critical point for Bitcoin dominance.
It’s possible that the main drop in Bitcoin dominance has already begun. If the green zone is lost, dominance could experience a deep decline, especially since the final wave of this diametric pattern | wave G | has touched the 0.618 Fibonacci level.
That said, there’s still a chance that the green zone might once again push the price near the previous high before we witness the drop in dominance. However, there are also signs suggesting that the main drop may have already started. Follow the chart closely and monitor it with precision.
For risk management, please don't forget stop loss and capital management
Comment if you have any questions
Thank You

RVN Looks Bullish (1W)It’s one of the coins we are highly bullish on.
A major liquidity pool has been swept, and the price has hit an important origin level.
As long as the upper green zone holds, it can move toward the targets on the daily and weekly timeframes. The targets are marked on the chart.
A weekly candle close below the invalidation level would invalidate this analysis.
For risk management, please don't forget stop loss and capital management
Comment if you have any questions
Thank You

Ethereum is still bullish! (1D)First of all, read the text carefully to avoid any misunderstandings.you should know that the market is currently at a sensitive point, and Ethereum’s bullish move does not necessarily mean other coins will follow the same path.
As marked on the chart, the START of Ethereum’s bullish move began after a lengthy and deep correction. Observing ETH's current behavior, this wave is sharp and appears to be more of a time-based correction rather than price-based. Wave B moved sideways and took significantly more time than wave A, suggesting that wave C could very well begin without a deep pullback, pushing price toward higher levels.
There’s a liquidity pool in the upper area that we’ve highlighted. In order for this momentum to slow down, price likely needs to hunt a major liquidity level.
There was a fresh order block inside the liquidity pool, and although price touched it, there wasn’t a deep reaction | lows weren’t taken out, and all the lows during the correction have remained intact, which is a bullish signal.
It seems that price intends to at least reach the red zone we've marked.
For this scenario to play out, the two green lines near the current price candles must hold. A daily candle closing below the invalidation level would invalidate this outlook.
For risk management, please don't forget stop loss and capital management
Comment if you have any questions
Thank You

BabydogIt seems that one of the most likely waves for Baby Dodge can be considered as a corrective wave wxy.

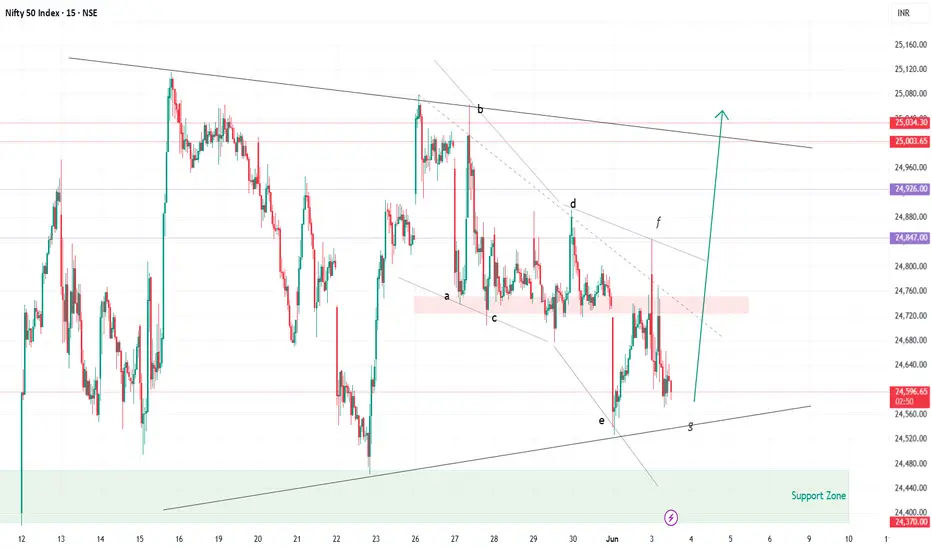
Diametric Pattern near completion?Anticipating a big Upside move after completing g-wave of the Diametric pattern.
check the trendIt is expected that a trend change will form within the current support range and we will witness the beginning of an upward trend. Otherwise, the correction trend will continue until the next support ranges.

uptrendIt is expected that the price will break through the green resistance zone and the resistance trend line, then by stabilizing above the resistance zone, the upward trend will continue.

check the trendConsidering the price behavior in the current support zone, possible scenarios have been identified. If the price breaks through the support zone, the downward trend will continue to the next support levels.

uptrendConsidering the price behavior in the current resistance zone, possible scenarios have been identified. It is expected that after some fluctuation, the corrective trend will continue.
By stabilizing above the resistance zone, the upward trend will continue.

check the trendThe correction and fluctuation trend is expected to continue until the specified time frame, then there is a possibility of a trend change and the start of an upward trend is possible.
If the price breaks through the support zone, the above scenario will be invalidated.

possibility of uptrendThe price is expected to fluctuate above the support area and then begin the upward trend. Then it can rise to the specified Fibonacci levels.
Otherwise, a correction to the previous low is possible.

possibility of uptrendThe price is expected to pass the resistance area according to the specified path and continue the upward trend to the resistance levels.
If the red support area is broken, the continuation of the downward trend is likely.

possibility of uptrendIt is expected that after some fluctuation and correction, a trend change will occur and an upward trend will begin.
If the index breaks through the support area, a continuation of the downward trend to the specified support levels will be possible.
