USDT DOMINANCE Roadmap (1D)From the point where the green arrow is placed on the chart, it seems that a large-degree bullish pattern has started. Waves A and B of this pattern are complete, and we are now in wave C.
Wave A was a diametric, and wave B was a triangle. We are currently in wave a of C. After wave b of C completes, caution is needed because the movement of c of C will begin.
From the green zone, Tether dominance may turn bullish again toward the two red-line targets.
We will try to update this analysis periodically.
For risk management, please don't forget stop loss and capital management
When we reach the first target, save some profit and then change the stop to entry
Comment if you have any questions
Thank You
Neo Wave

BTC(based on NEo wave)This branch has impulsive structure.
so why now there is an impulse wave here?
because this 5 waves are wave (c) of a flat.
when this 5 wave finished strong bullish wave will start.
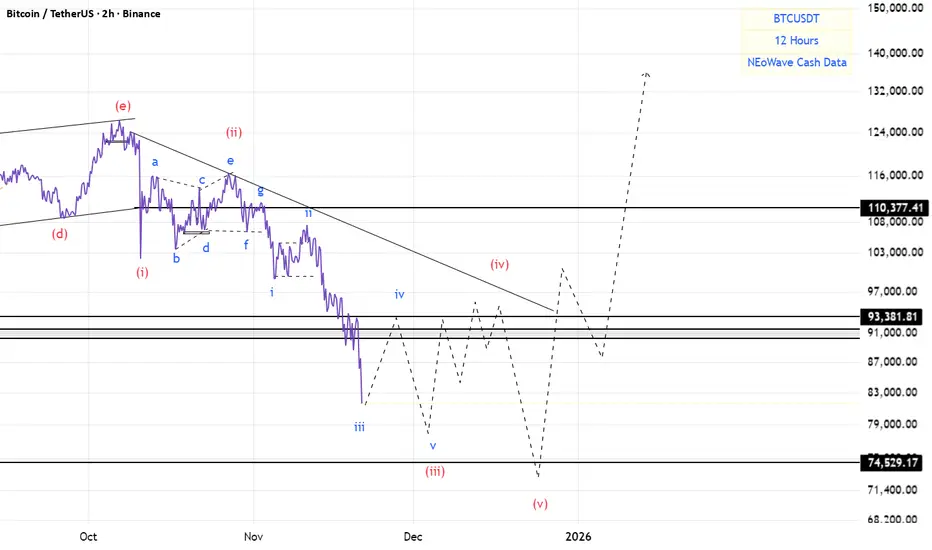
downtrend Given the price behavior in the current support level, possible scenarios have been identified. A downward trend will be formed upon the breakdown of the support zone.

check the trend Given the support level broken, the downward trend will likely continue. Then, considering the price behavior in the next support level, possible scenarios have been identified.

possibility of uptrend With the resistance level broken, the upward trend will likely continue. Then the specified targets will be available.

possibility of downtrend Given the recent downtrend, it is expected to continue the downtrend.
After the current corrective pattern is completed, it is expected to continue the downtrend.

check the trendThe correction trend in the support range is expected to end and we will witness the beginning of an upward trend.If the price breaks through the support range, a continuation of the downward trend is likely.

uptrend The upward trend is expected to advance to the specified resistance levels, then there is a possibility of a trend change.

possibility of uptrendConsidering the price behavior of the price behavior in the resistance range and trend line, possible scenarios have been identified. With the failure of the resistance range, an upward trend will be likely.

possibility of uptrend If the index breaks through the support range, the continuation of the downward trend to the next support levels will be possible.
Otherwise, with consolidation above the support range, the upward trend will be likely.

check the trendGiven the price behavior in the current range, the continuation of the downward trend will be likely. If the price consolidates above the Fibonacci levels, the upward trend will be possible.

check the trend It is expected that the trend will change in the current support range and we will see the start of the upward trend.
If the price breaks through the support range, the continuation of the downward trend will be likely.

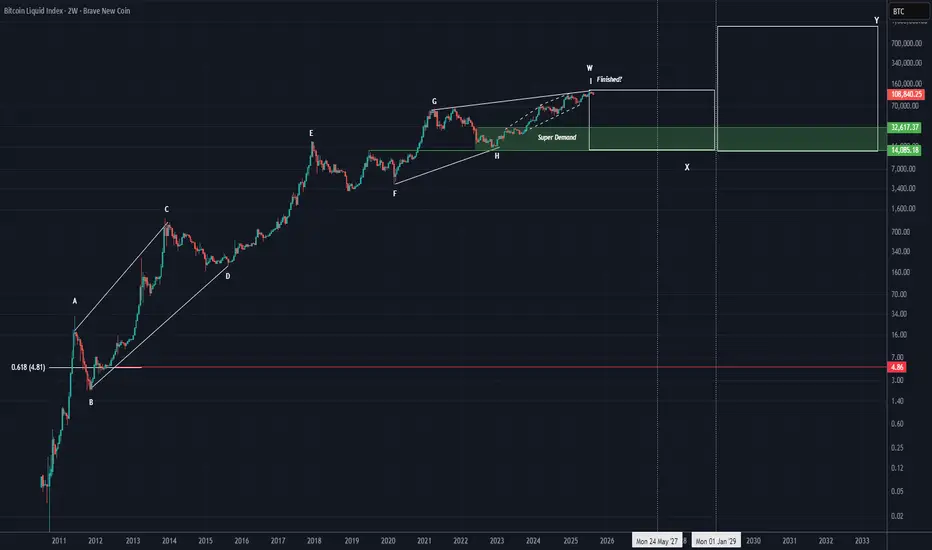
Is it really possible for Bitcoin to reach 1 million dollars?Is it really possible for Bitcoin to reach one million dollars?
This is the complete Bitcoin data | from when it was $0.01 up to the last all-time high of $125K. Whether we like it or not, a large-degree pattern on Bitcoin is reaching completion, and we are looking at the chart without bias, purely through wave theory.
The symmetrical pattern you see on the chart is on the monthly or 2-week timeframe.
We are currently in the final wave, wave i of W. Wave i of W itself is a diagonal or symmetrical pattern (which we discussed in THIS POST () |this post only concerns branch i of W of this pattern).
When such a large pattern completes, there are two possibilities:
A counter cycle of the same degree begins , or
An X wave forms.
First scenario: forming a new pattern is very unlikely because if it happens, the Fibonacci 0.618 target of this pattern would be reached | around $4–$10 for Bitcoin. If this happens, the entire crypto market would effectively become a scam. This scenario is highly improbable and currently illogical.
Second scenario: the formation of an X wave. It’s worth explaining X waves: X waves connect patterns of the same degree without requiring large time-price corrections relative to the previous pattern, allowing a phase | whether bullish or bearish | to extend. Here, since the first phase is bullish, the pattern after the X wave will also be bullish.
For Bitcoin, if an X wave forms, the best range for it to end is $32K–$14K, and the X wave could last until 2027–2028. The two time lines indicate where the X wave could end.
When a new cycle begins, it is of the same degree as the previous pattern. This means we will have years of bullish phases with corrections, similar to the first phase W, which is represented on the chart from wave A to I.
The target of the second pattern, Y, after the X wave, can realistically reach $1 million! The estimated time frame for reaching this target is 2031–2039, but why the 8-year tolerance? This accounts for the pattern type: if it’s a triangle, these targets could be reached faster, but if it’s another multi-branch pattern, the timing may extend.
From a technical and wave-theory perspective, this is indeed possible. This is our broad 10-year outlook on Bitcoin.
❤️ Stay with us updates will be provided in the future with support and resistance zones plotted on the chart. Do you really think Bitcoin can reach $1 million?

BTC Perfect Elliott Wave Zigzag With Terminal Wave-CBTC has formed into a near-perfect zigzag with a near-perfect terminal wave-C.
Highest Degree (Zigzag pattern):
Wave-C = A+B in time
Wave-C is the most complex and time consuming part of the pattern (common for terminal impulses)
There's clear alternation in time/price for all waves
Wave-B retraced <0.618% of wave-A (required for zigzags)
Channeling confirms end of all waves clearly
Wave-C (Terminal pattern):
Wave-3 = 1.382 * Wave-1 in price (common in 5th wave extensions)
Wave-3 = (Wave-1+Wave-2)0.5 in time
Wave-4 = ~1.618 * Wave-2
Wave-4 = ~(Wave-2+Wave-3) in time,
Wave-4 alternates with wave-2 in price/time
Wave-5 = 1.618(Wave-3) in price
Wave-5 = (Wave-3+Wave-4) in time
Channels as an expanding wedge, expected for 5th-wave extensions
Sentiment indicators are also reading near all time lows, as low as it was during the covid lows and FTX lows.
Given this setup as an isolated pattern, and with the high probability Bitcoin is towards the middle of a long-term pattern, this is a strong setup for a move towards ATH.
To confirm it, we should see wave-C being full retraced in less than half the time it took to form.

UNI Looks Bearish (1H)From the point where we marked the red arrow on the chart, the UNISWAP correction has begun, and the pattern appears to be a diametric.
The best area for wave F to complete is the highlighted red zone. If the price reaches this zone, we will look for Sell/Short positions.
The stop-loss and targets are also marked on the chart.
For risk management, please don't forget stop loss and capital management
When we reach the first target, save some profit and then change the stop to entry
Comment if you have any questions
Thank You

Is Bitcoin still bearish? (1D)In response to the question of whether Bitcoin is still bearish | the answer is yes.
After the drop, Bitcoin has reached a strong support zone, where it’s currently reacting and consuming lower supports. A rejection from the red zone is expected.
However, keep in mind that due to the high volume of short positions, the red zone might even experience a fakeout before the drop continues.
A daily candle closing above the invalidation level would invalidate this analysis.
For risk management, please don't forget stop loss and capital management
Comment if you have any questions
Thank You

LIGHT is Bearish (4H)It seems that a large structure, which was a triangle, has completed, and we are now at the end of wave E. Look for a trigger for a sell/short position and enter the trade at the right point with proper risk management.
If the wave count is correct, LIGHTUSDT will remain in a corrective phase for a long time.
The short-term targets are marked on the chart.
A 4-hour candle closing above the invalidation level will invalidate this analysis.
For risk management, please don't forget stop loss and capital management
When we reach the first target, save some profit and then change the stop to entry
Comment if you have any questions
Thank You

Is it really possible for Bitcoin to reach 1 million dollars?Is it really possible for Bitcoin to reach one million dollars?
This is the complete Bitcoin data | from when it was $0.01 up to the last all-time high of $125K. Whether we like it or not, a large-degree pattern on Bitcoin is reaching completion, and we are looking at the chart without bias, purely through wave theory.
The symmetrical pattern you see on the chart is on the monthly or 2-week timeframe.
We are currently in the final wave, wave i of W. Wave i of W itself is a diagonal or symmetrical pattern (which we discussed in THIS POST () |this post only concerns branch i of W of this pattern).
When such a large pattern completes, there are two possibilities:
A counter cycle of the same degree begins , or
An X wave forms.
First scenario: forming a new pattern is very unlikely because if it happens, the Fibonacci 0.618 target of this pattern would be reached | around $4–$10 for Bitcoin. If this happens, the entire crypto market would effectively become a scam. This scenario is highly improbable and currently illogical.
Second scenario: the formation of an X wave. It’s worth explaining X waves: X waves connect patterns of the same degree without requiring large time-price corrections relative to the previous pattern, allowing a phase | whether bullish or bearish | to extend. Here, since the first phase is bullish, the pattern after the X wave will also be bullish.
For Bitcoin, if an X wave forms, the best range for it to end is $32K–$14K, and the X wave could last until 2027–2028. The two time lines indicate where the X wave could end.
When a new cycle begins, it is of the same degree as the previous pattern. This means we will have years of bullish phases with corrections, similar to the first phase W, which is represented on the chart from wave A to I.
The target of the second pattern, Y, after the X wave, can realistically reach $1 million! The estimated time frame for reaching this target is 2031–2039, but why the 8-year tolerance? This accounts for the pattern type: if it’s a triangle, these targets could be reached faster, but if it’s another multi-branch pattern, the timing may extend.
From a technical and wave-theory perspective, this is indeed possible. This is our broad 10-year outlook on Bitcoin.
❤️ Stay with us updates will be provided in the future with support and resistance zones plotted on the chart. Do you really think Bitcoin can reach $1 million?
Has The BITCOIN Bear Cycle Started? (1W)This is a weekly timeframe analysis. In this analysis, we examined the bullish phase that pushed Bitcoin from the $15K channel to the $125K channel.
This phase appears to be a bullish diametric pattern, with its final wave, G, completed as a triangle.
It’s important to note that there is a possibility for this diametric pattern to transform into a symmetrical pattern. The difference between a symmetrical and a diametric pattern is that the symmetrical pattern has two additional waves.
The price zone that could potentially turn our diametric pattern into a symmetrical one is the upper support area, between $64K and $74K. The potential timeline for a reversal is indicated by two vertical lines on the chart for the months of March and January. These were derived from the duration of previous branches of this pattern, where corrective branches of prior waves ranged between 16 to 25 weekly candles. If the pattern is symmetrical and not diametric, this means the next two waves of this bullish cycle are still remaining, following these timing rules.
In general, the intersection of the support zone and the timeline lines at the top of the chart is where the price could develop the pattern and move upward. However, if these zones fail, it means the main pattern was the diametric itself, and we are now in Bitcoin’s bear cycle. In other words:
If the price continues to decline, it’s possible that the diametric pattern was the main bullish phase, which is now complete, and Bitcoin has entered a monthly timeframe bear cycle that could last months or even more than two years.
The main support after this bullish phase, on higher timeframes, is in the $31K to $44K range, where Bitcoin’s bear cycle might finally end.
We hope this gives you a clear perspective on Bitcoin.
For risk management, please don't forget stop loss and capital management
When we reach the first target, save some profit and then change the stop to entry
Comment if you have any questions
Thank You

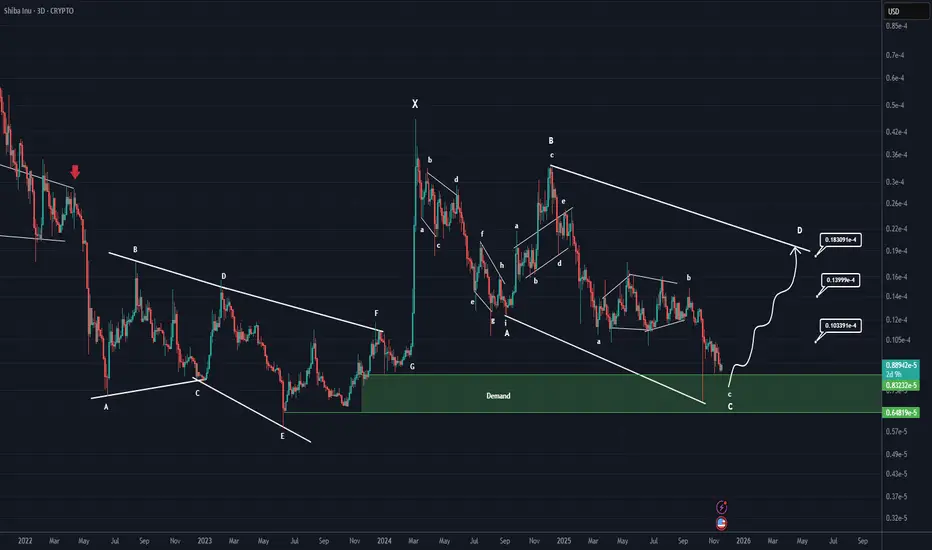
Shiba Inu Will Become Bullish Soon (3D)Shiba Inu is completing a very large correction across higher degrees and larger time frames.
It appears to be in a double or multiple correction, currently in the second phase. This phase itself is a complex correction, and it is now finishing wave C of this complex corrective structure.
The green zone is where Shiba can enter wave D in the higher time frames | a bullish wave.
Remember, we do not make decisions based on emotions; we analyze based on signals and indications.
For risk management, please don't forget stop loss and capital management
When we reach the first target, save some profit and then change the stop to entry
Comment if you have any questions
Thank You

SHIBA Inu Analysis (3D)Shiba Inu is completing a very large correction across higher degrees and larger time frames.
It appears to be in a double or multiple correction, currently in the second phase. This phase itself is a complex correction, and it is now finishing wave C of this complex corrective structure.
The green zone is where Shiba can enter wave D in the higher time frames | a bullish wave.
Remember, we do not make decisions based on emotions; we analyze based on signals and indications.
For risk management, please don't forget stop loss and capital management
When we reach the first target, save some profit and then change the stop to entry
Comment if you have any questions
Thank You
Solana is still far from a bearish phase (3D)From the point where we placed the red arrow on the chart, a corrective phase has developed on Solana, and the buying pressure has been so strong that the corrections have established a new high. Currently, the decline we are experiencing is for Wave E.
All these fluctuations between the high and low are for re-accumulation, and Solana is targeting above $350.
We expect a price reversal from the green zone on higher timeframes, and this view will only be invalidated if a weekly candle closes below the invalidation level.
For risk management, please don't forget stop loss and capital management
When we reach the first target, save some profit and then change the stop to entry
Comment if you have any questions
Thank You

DUSK ANALYSIS (1W)It seems that after forming the 3D structure, the price has entered a corrective ABC pattern or a more complex one.
It appears that wave B has now ended, and the price has entered wave C.
Wave C has a long correction ahead in terms of time, and in terms of price, the best area for the end of wave C is the green zone.
Let’s wait and see what happens.
For risk management, please don't forget stop loss and capital management
When we reach the first target, save some profit and then change the stop to entry
Comment if you have any questions
Thank You
