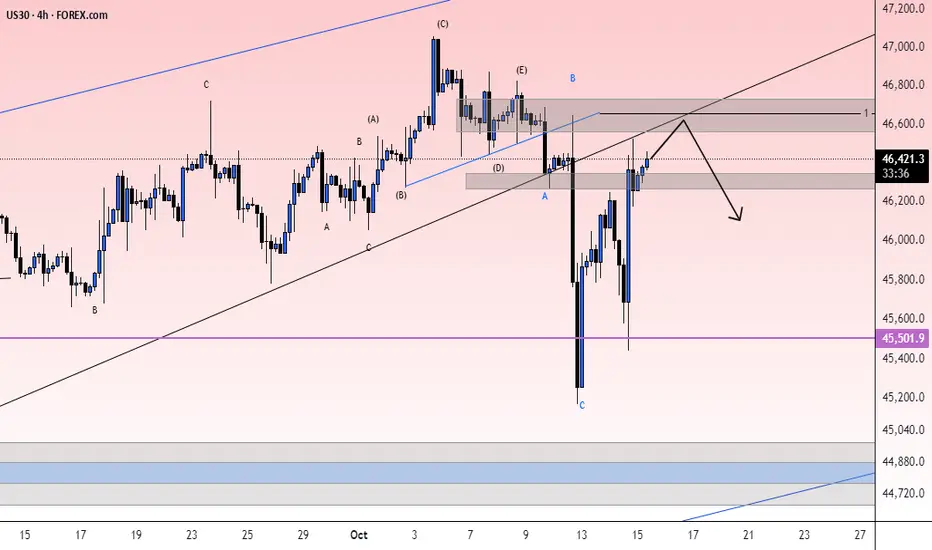
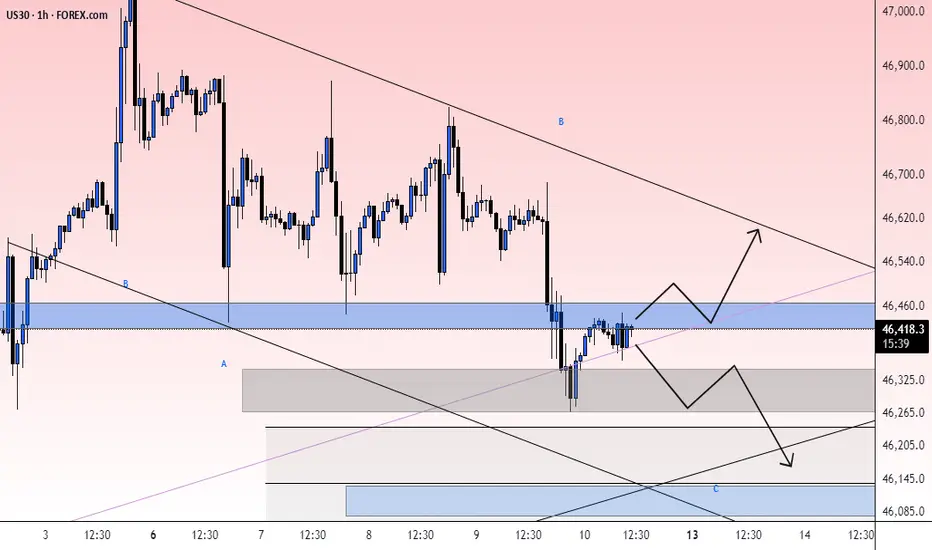
check the trendIt is expected that a trend change will form in the current resistance range and we will witness the beginning of a downward trend.
As long as the index does not stabilize above the resistance range, the continuation of the downward trend and correction will be likely.
Neo Wave
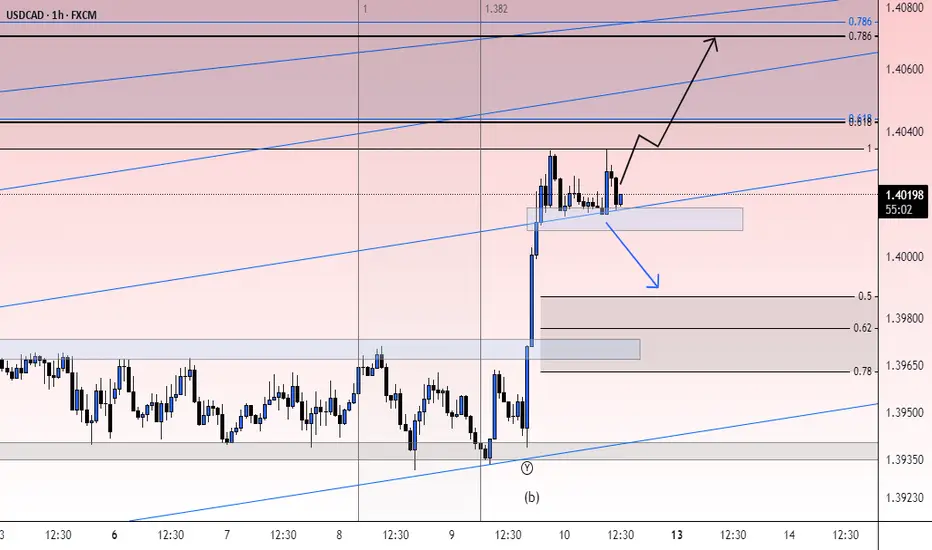
check the trend It is expected that a trend change will form in the current resistance range and we will witness the beginning of a downward trend. If the price breaks through the previous ceiling range, an upward trend will be likely.

possibility of uptrend Considering the price behavior in the current resistance range, possible scenarios have been identified. With the resistance range broken, the upward trend will continue along the specified path.

ETH Looks Bearish (12H)It seems that Ethereum has completed a large bearish triangle, with the first move already played out.
A pullback to the supply zone | marked in red | has now occurred.
The price is expected to eventually reach the green zone, accompanied by some fluctuations along the way.
The main target is the green zone.
A daily candle closing above the invalidation level will invalidate this analysis.
For risk management, please don't forget stop loss and capital management
When we reach the first target, save some profit and then change the stop to entry
Comment if you have any questions
Thank You

SNX Rebuy Setup (12H)Before anything else, pay attention to the timeframe.
From the point marked Start on the chart, it appears that a bullish phase has begun on SNX.
Currently, it seems we are at the end of Phase A. After some time correction and price consolidation, we can expect another bullish wave forming Wave C.
In the green zone, we can look for buy/long positions.
Targets are indicated on the chart.
If a daily candle closes below the invalidation level, this analysis will be invalidated.
For risk management, please don't forget stop loss and capital management
When we reach the first target, save some profit and then change the stop to entry
Comment if you have any questions
Thank You

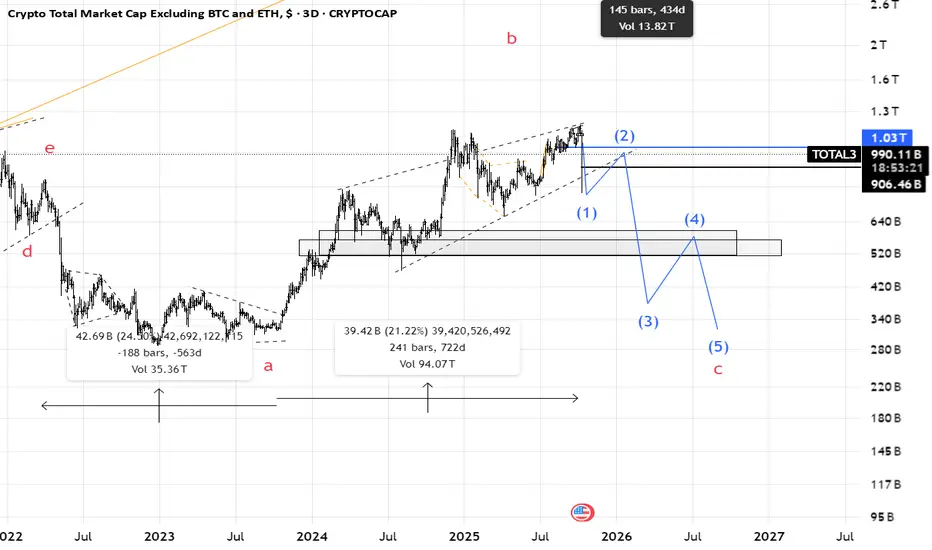
Total3(based on NEo wave) second scenario as the second way for market there is a possibility that we were in wave b of flat and now wave c which is impulse has started.
so I should see it make impulse waves or corrective waves.
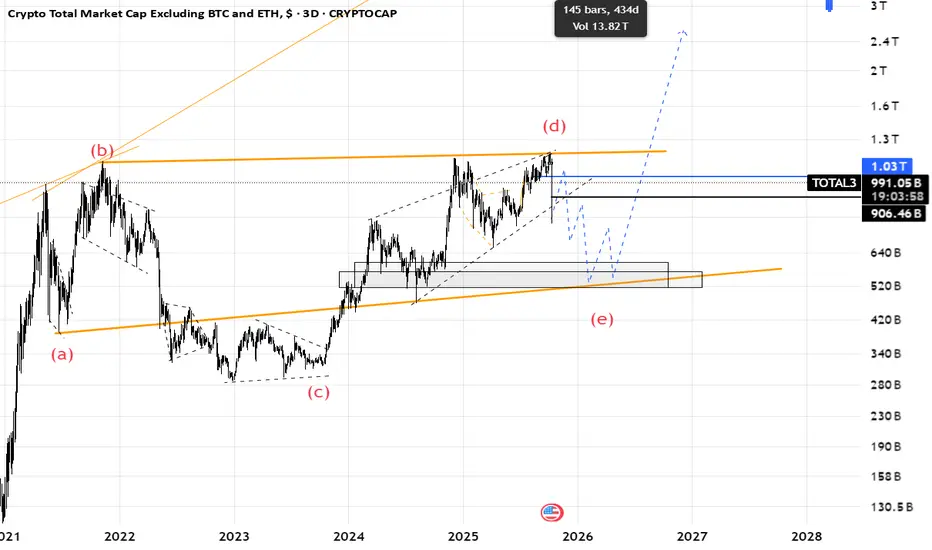
Total3(based on NEo wave)I thought wave (e) is finised but I was wrong.
now I think its the start of wave (e) and we should afraid of altcoins.
when wave (e) is finished altcoins will start to pump.
every upward is a chance to sell.
there is another scenario that I will share it on next post.
XCN Analysis (12H)From the point marked START on the chart, the correction of XCN seems to have begun.
Based on the wave structure, the price now appears to be in a complex ABC. Wave B of B looks like a diametric, and we are currently in the middle of wave F.
Once wave g of this diametric is completed, we can enter a position within the green zones, which represent our entry areas.
⚠️ Note that this asset is risky and highly volatile, so make sure to enter only in spot with proper risk management.
The closing of a daily candle below the invalidation level will invalidate this analysis.
For risk management, please don't forget stop loss and capital management
When we reach the first target, save some profit and then change the stop to entry
Comment if you have any questions
Thank You

DOGE Looks Bearish (1D)We tried to show the waves from a larger perspective so you can have a better understanding of the path.
It seems that wave "B" of the higher-degree correction has been completed (wave B was a bullish phase), and now we are entering wave "C", which is bearish at a higher degree.
With the price pulling back toward the red zone, we can look for sell/short positions.
On the chart, there is a liquidity pool marked with "$$$", and the first target of this bearish move is to sweep that liquidity pool.
A daily candle closing above the invalidation level will invalidate this analysis.
For risk management, please don't forget stop loss and capital management
When we reach the first target, save some profit and then change the stop to entry
Comment if you have any questions
Thank You

HYPE Analysis (12H)Before anything else, pay attention to the timeframe.
It seems we have a dual bullish phase on the chart, where the second phase is a triangle, and the price is likely to soon enter wave D of this second phase. The second phase is indeed a triangle.
Within the red-marked zone, we can look for sell/short setups.
You should aim for a reasonable profit target and manage your risk accordingly.
A daily candle close above the invalidation level will nullify this analysis.
For risk management, please don't forget stop loss and capital management
Comment if you have any questions
Thank You

PARTI Looks Bearish (12H)It seems that a large-degree contracting bearish triangle has been completed. If we want to consolidate this pattern, we should consider it as wave Ameaning that we expect a **wave B** to form either in terms of time, size, or potentially even larger than wave A.
Any pullback toward the two red lines is an opportunity to open a sell/short position
A weekly candle closing above the invalidation level will invalidate this view.
For risk management, please don't forget stop loss and capital management
When we reach the first target, save some profit and then change the stop to entry
Comment if you have any questions
Thank You

1INCH Analysis (12H)From the point marked START on the chart, a corrective phase seems to have formed on the 1INCH pair.
This phase appears to be a diametric, and we are currently in wave F of this diametric.
Within the red zone, wave F could terminate, after which wave G is expected to begin. Wave G is a bearish wave.
Targets are shown on the chart.
A daily candle close above the invalidation level will negate this analysis.
For risk management, please don't forget stop loss and capital management
When we reach the first target, save some profit and then change the stop to entry
Comment if you have any questions
Thank You

INJ Looks Bearish (8H)The INJ coin is under selling pressure, forming a bearish triangle that has recently completed. This triangle ended at the point where we placed the red arrow on the chart.
After the triangle, we expect at least three legs down to complete the minimum sub-waves of a bearish pattern.
Once Wave B is completed around this area (or slightly higher), the price may enter a bearish phase.
The target is the green line on the chart.
If a daily candle closes above the invalidation level, this analysis will be invalidated.
For risk management, please don't forget stop loss and capital management
Comment if you have any questions
Thank You

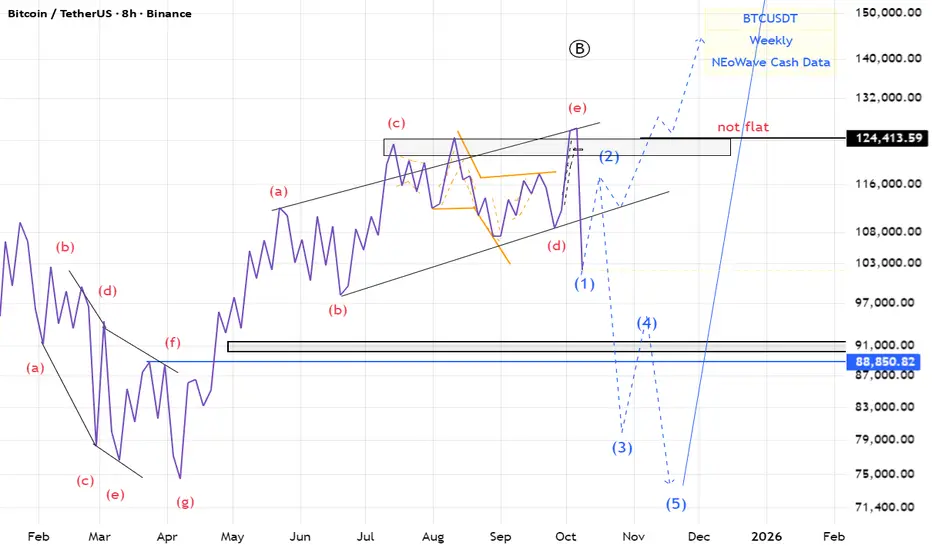
BTC(based on NEo wave)there is a good possibility for the irregular flat.
I think 2-3 month we will see the red market
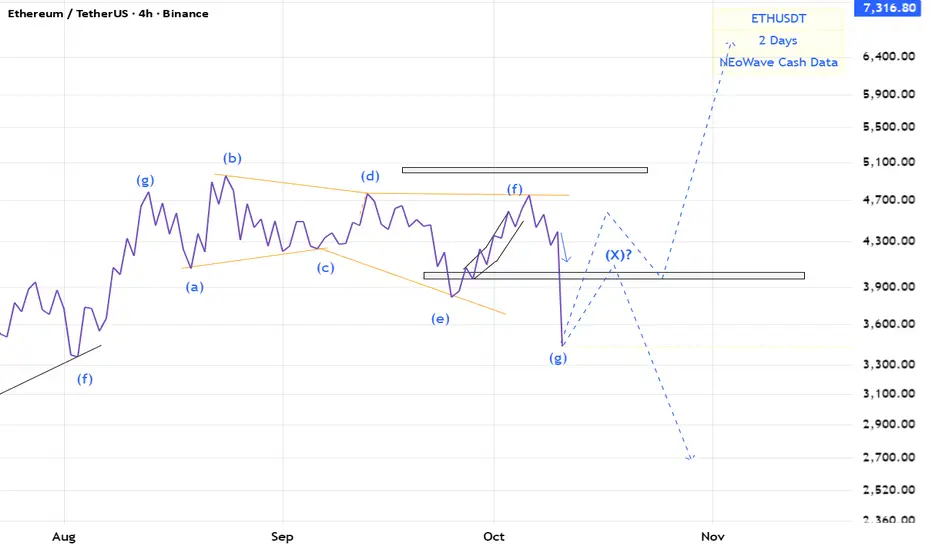
ETH(based on NEo wave)stop loss touched and now there are 2 ways for eth.
we need a post pattern confirmation for bullish wave.
or there is an x wave an correction stills go on.
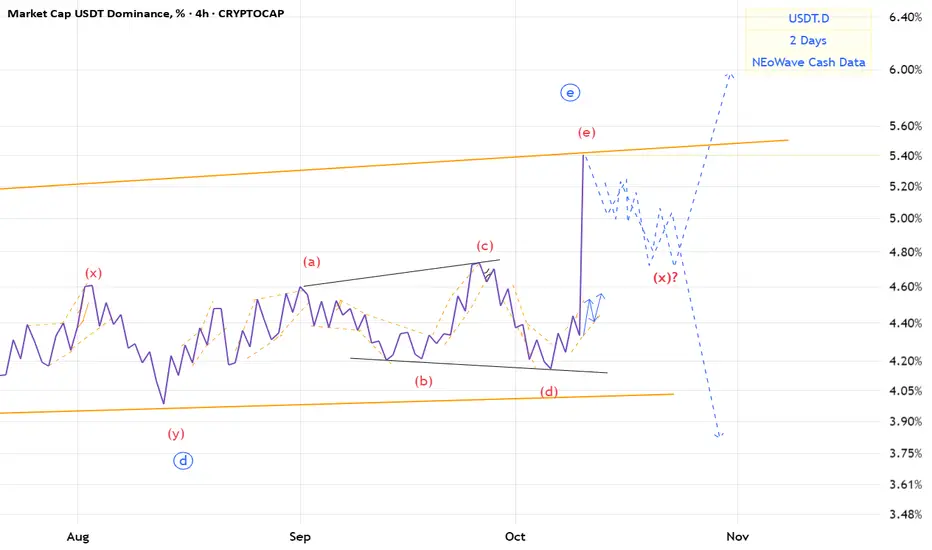
USDT.D(based on NEo wave)The e wave that I wanted made a descending triangle.
we should wait for it becouse it may make an x wave or a post pattern.
possibility of uptrend The price is expected to consolidate above the support range and then continue the upward trend. If the price breaks the support range, a downward trend to the specified support levels will be possible.
possibility of uptrendConsidering the price behavior in the current support range, possible scenarios have been identified.
With the support range broken, the continuation of the downtrend is likely.

possibility of uptrend It is expected that the price will consolidate above the support level and then the upward trend will likely begin.
If the support level is broken, the downward trend will likely continue.

uptrend It is expected that we will witness the beginning of an upward trend within the current support level and will advance to the resistance trend line.
With the resistance level being broken, the upward trend will be confirmed.

uptrend Given the resistance level being broken and the resistance level being consolidated, the upward trend will continue as per the specified path.

check the trendGiven the index is located between the two resistance and support areas, with the price breaking and stabilizing, the continuation of the movement in the same direction is likely.
uptrend Given the price behavior in the current support area, the upward trend is expected to advance to the resistance trend line.
With the support area broken, the continuation of the downward trend is likely.
