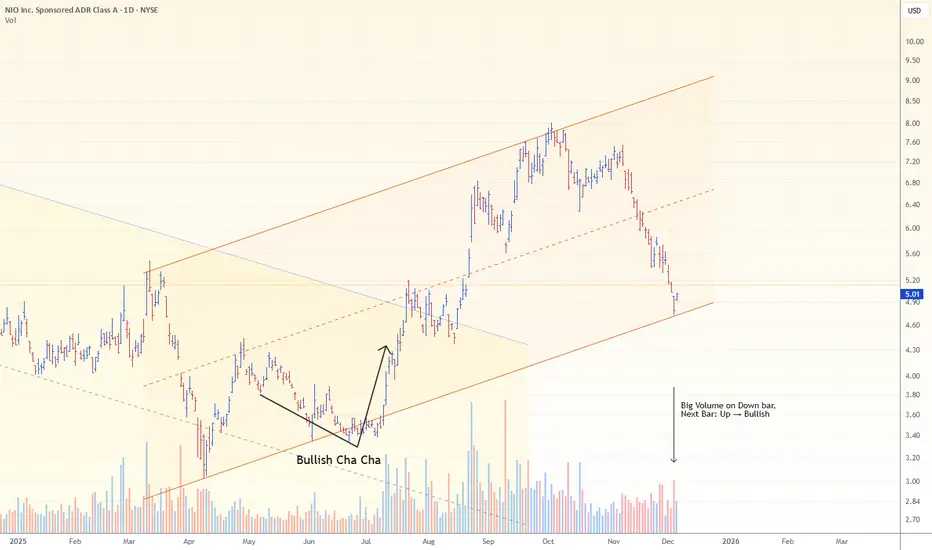
NIO mid-term TANIO is setting up bullish uptrend on daily, it's in the process, there's no confirmation as of yet but there's a positive divergence starting to appear which could be the first sign of bearish trend reversal. Short-term is in bullish formation now and the price could go higher from here.
NIO

NIO A SQUEEZE STOCK, HOW LIKELY?NIO
Hi everyone,
Thx for reading.
Anyway, here is a quick chart to show a potential explosive move to the upside.
Will it occur 100%, not sure because there are slower paths to 27.
Why 27? A gap closure, fib numbers, return to high, fits pattern stuff like that.
Long term? Not a great buy because the jump to 27 might retrace pretty hard. Investing 100 at 27 means you only have 50 dollars at 13.5.
Nio has a legit gamma squeeze setup, but the real question is does it trigger.
The week of the 16th, theoretically, the options could run up to $20, which could mean see the price move to the 27 mark.

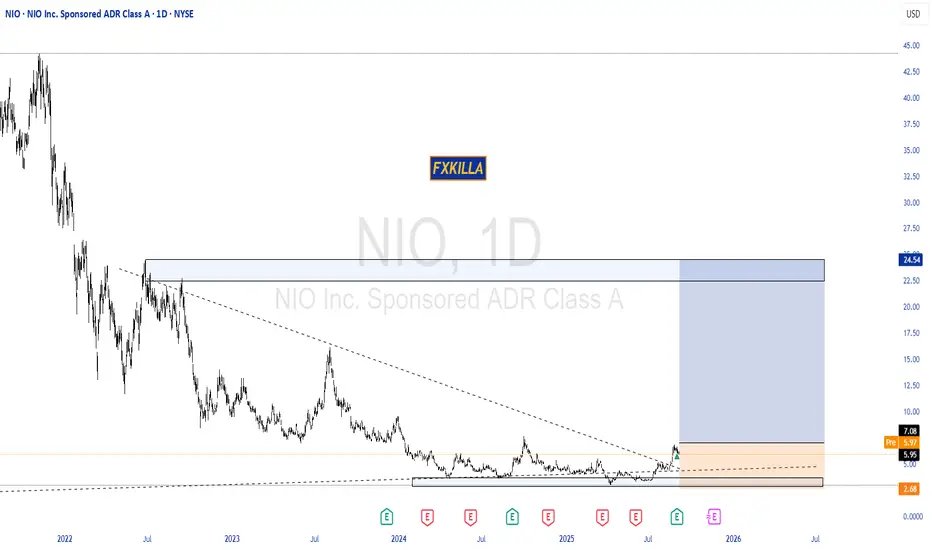
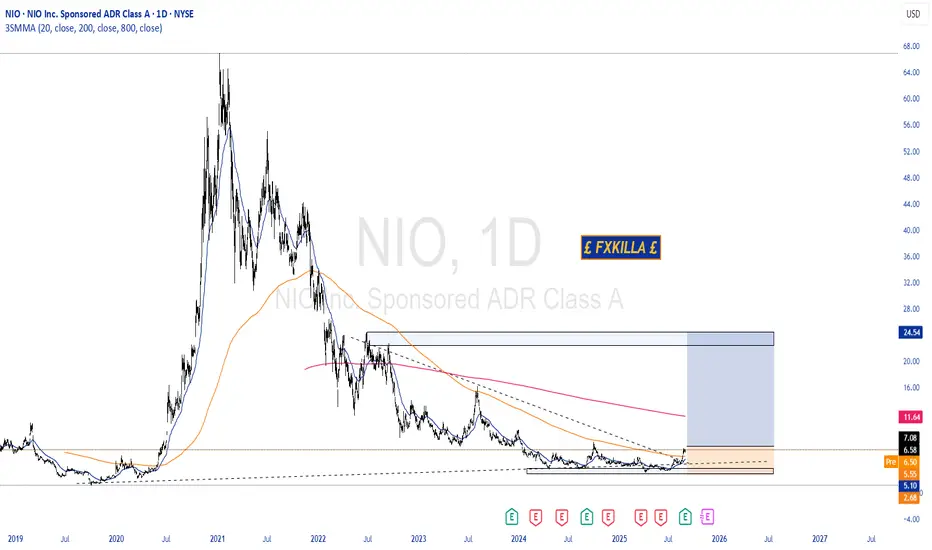
$NIO - $1.15 Price TargetNio's Bear Channel is intact going into 2026. My price target by the end of 2026 is $1.15. Fundamentals are weak and technicals is also weak. Chart is set up for a short opportunity going into 2026. We see clear lower highs and lower lows and the prices are rejecting at the channel tops creating new legs lower. The company is operating at a loss and with its over 2 billion shares outstanding, there will be many future share dilutions to fund its operations and fund its losses to keep its business afloat.

$NIO - Deep Dive into a High Growth High Volatility EV ContenderNIO Inc. stands as a prominent yet polarizing figure in the electric vehicle landscape, frequently highlighted by market observers as a fundamentally strong growth stock trading at penny stock levels. The company embodies a compelling mix of robust long-term expansion, significant near-term challenges, and a valuation that analysts believe discounts its future potential.
Analyst Sentiment: Cautious Optimism Amidst Revisions
The current analyst perspective on NIO is nuanced and in flux. As of mid-December, sentiment is mixed, with a slim majority—approximately 53%—of covering analysts maintaining a "Buy" or equivalent rating. A significant portion, nearly 40%, advises a "Hold" or neutral stance, reflecting caution, while a minimal 3% recommend selling. This divergence underscores the high-conviction, high-risk debate surrounding the stock.
Price targets mirror this split, ranging from a conservative $4.03 to a bullish $9.10. The median target of $7.04 suggests a substantial upside potential of over 41% from recent levels, indicating that even amidst caution, the fundamental growth narrative holds weight. Notably, a Morgan Stanley analyst reaffirmed a 'Buy' rating in early December with a price target equivalent to $6.94, translating to a ~39% upside.
However, the outlook has seen recent downward revisions. Following NIO's third-quarter earnings report in November, several institutions adjusted their positions. While BofA Securities maintained a Neutral rating, it trimmed its price target. More significantly, Macquarie downgraded the stock from Outperform to Neutral and slashed its target from $6.70 to $5.30, signalling heightened concerns over the near-term trajectory.
Financial Performance & Guidance: A Story of Beats and Misses
NIO's Q3 2024 results presented a mixed financial picture. The company outperformed earnings-per-share (EPS) expectations, reporting a loss of ¥-1.140 (RMB) versus a consensus forecast of ¥-1.590—a meaningful improvement. On the top line, however, revenue of ¥21.79 billion fell slightly short of the ¥22.3 billion analyst estimate.
Management's guidance for the critical fourth quarter also introduced caution. The company forecasts revenue between ¥32.76 billion and ¥34.00 billion, which sits below the consensus estimate of ¥34.70 billion. This conservative outlook has contributed to the recent analyst recalibrations, as it points to potential headwinds in delivery volumes, pricing, or both.
The NIO Investment Thesis: Growth, Differentiation, and Path to Profitability
Founded in 2014, NIO has established itself as a major Chinese EV producer, differentiating itself through a unique ecosystem centered on its "Battery as a Service" (BaaS) model. This strategy features a roadmap of "chargeable, swappable, and upgradable" batteries, with its network of Power Swap stations offering a sub-5-minute battery exchange—a significant competitive edge in user convenience and addressing charging infrastructure concerns.
The company's growth has been explosive. From 2020 to 2024, annual vehicle deliveries skyrocketed more than fivefold, from 43,728 to 221,970 vehicles. Concurrently, annual revenue more than quadrupled. This remarkable expansion occurred despite severe industry challenges, including a global pandemic, macroeconomic pressures, and an intense price war within China's hyper-competitive EV market.
NIO is strategically expanding its market reach through a multi-brand strategy:
NIO: The flagship brand, offering premium smart electric sedans and SUVs.
Onvo (Alps): A sub-brand focused on the family SUV market at more accessible price points.
Firefly: A forthcoming sub-brand targeting the affordable compact car segment.
This structure allows NIO to attack multiple price tiers simultaneously, driving volume growth. Analysts project revenue to grow at a compound annual growth rate (CAGR) of 31% from 2024 to 2027, anticipating a significant narrowing of net losses. This growth is expected to be fueled by the Onvo and Firefly launches, domestic market share gains, and a continued push into European markets. Further efficiency could come from a potential spin-off of its capital-intensive battery manufacturing division, which would streamline the balance sheet.
Valuation, Margins, and Technical Considerations
Despite its growth profile, NIO trades at a deep discount, valued at less than one times its current year's sales. This depressed valuation is largely attributed to macro-overhangs, specifically the ongoing trade tensions and tariff conflicts between the U.S. and China, which have weighed heavily on Chinese equities listed in the U.S.
Financially, the company has demonstrated improving operational health. After vehicle margins contracted to single digits in 2023 due to the industry price war, they have rebounded to double-digit levels over the past two years. This improvement is driven by a favorable sales mix toward higher-margin NIO premium vehicles, relentless reductions in production costs, and a broader streamlining of operating expenses.
From a technical analysis perspective, the stock has established several key support zones that traders monitor closely, reflecting areas where buying interest has historically emerged. These critical levels are identified at $4.50, $3.50, and $3.00. These zones will be vital for the stock's stability as it navigates its current challenges.
Conclusion: A High-Stakes Growth Story
In summary, NIO Inc. represents a high-stakes investment proposition. It is a company with a proven capacity for rapid growth, a technologically differentiated and scalable business model, and a clear roadmap toward profitability and expanded market share. However, it faces near-term execution risks, conservative guidance, and formidable macro-political headwinds that suppress its valuation. For investors, the bull case rests on the belief that the company's fundamental growth—driven by its multi-brand expansion and unique swapping ecosystem—will ultimately overcome these temporary pressures, potentially unleashing significant value once the external climate improves. The divergence in analyst opinions perfectly captures this tension between its formidable potential and its palpable risks.

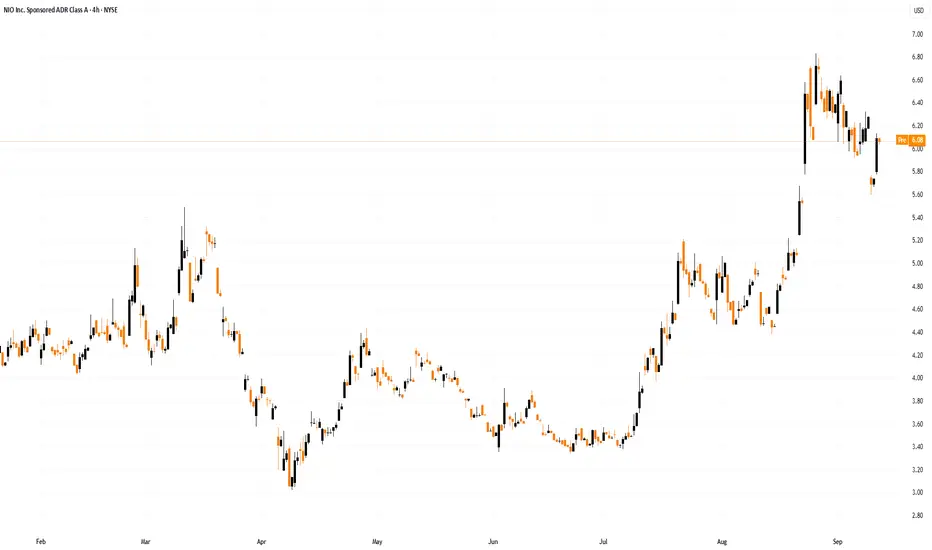
NIO: Price can find supportNIO broke below $5, extending a ~30% slide over the past month.
Pressure came after earnings showed a slight revenue miss and cautious delivery guidance — enough for bears to push the stock to new lows.
But the chart isn’t all doom:
→ price is testing the lower boundary of the 2025 ascending channel
→ yesterday opened with a bullish gap, signaling buyers may be stepping in around the key $5 level
If bulls manage to defend this zone, the trend could stabilize — with further direction depending on momentum for ONVO & Firefly heading into 2026.
NIO Shares Drop Below $5NIO Shares Drop Below $5
As the chart shows, the share price of NIO Inc. (NIO), the Chinese manufacturer of “smart” electric vehicles, has fallen by roughly 30% over the past month and this week slipped below $5 for the first time since mid-August.
Among the bearish drivers:
→ the latest quarterly report revealed gross revenue below analysts’ expectations ($3.06bn versus $3.11bn);
→ a cautious outlook for vehicle deliveries in the upcoming quarter.
Market sentiment appears to have turned wary, given that:
→ the Chinese economy continues to show signs of slowing despite government stimulus;
→ NIO’s revenue prospects may remain constrained by intense competition from BYD, XPeng and Li Auto — a particularly concerning factor as NIO launches new models and sub-brands.
Even so, the NIO share chart does offer some glimmers of optimism.
Technical Analysis of NIO Shares
Using the higher highs and higher lows of 2025, it is possible to outline an ascending channel (shown in blue). Within this structure:
→ the price is hovering near the lower boundary of the channel, which may act as support;
→ the RSI indicator is displaying a bullish divergence.
Another encouraging signal lies in the recent price action: yesterday’s session opened with a bullish gap and ended higher, suggesting renewed buying interest emerging near the psychologically important $5 level.
It is therefore plausible that the bulls may attempt to keep NIO shares within the channel and even resume the upward trend. Whether they succeed, however, will depend largely on sales performance — and on forecasts for 2026 — for the company’s new sub-brands, ONVO and Firefly.
This article represents the opinion of the Companies operating under the FXOpen brand only. It is not to be construed as an offer, solicitation, or recommendation with respect to products and services provided by the Companies operating under the FXOpen brand, nor is it to be considered financial advice.

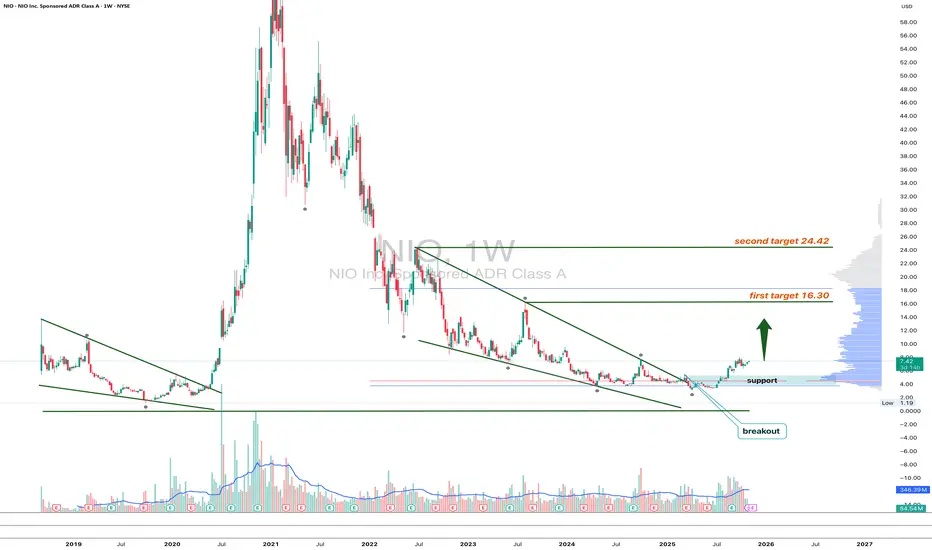
NIO 1W - engine on or just market noise?Technically, NIO has broken out of a long downtrend and is holding above the key $7.4 support. On the weekly chart this looks like the first sign of a long-awaited reversal. Fundamentally, however, the story is still mixed.
The company reported record October deliveries above 40 k units, up roughly 93% year-on-year - strong momentum that shows NIO is expanding its market share in China and entering a new growth phase. Still, free cash flow remains negative and profitability elusive due to heavy investments in battery-swap infrastructure and R&D.
Overall, sales growth and improving brand position support a bullish outlook. As long as price holds above $7.0–7.5, targets at $16.3 and $24.4 remain realistic. A breakdown below $6.5 would invalidate the setup.
Even electric dreams need a full charge - let’s see if this one can make it up the hill.
NIO - Post-Earnings Pullback to 0.618 Oversold ZoneNIO Accumulation After Earnings Pullback: 0.618 Retracement + DeM Oversold Signal
NIO has pulled back into a critical accumulation zone following recent earnings, creating a textbook geometric retracement setup combined with oversold momentum indicators. This analysis breaks down why this pullback represents a structured portfolio addition opportunity rather than fundamental deterioration.
🎯 Setup Overview:
Current Price Action: Pullback to 0.618 Fibonacci retracement level
Technical Confluence: DeMarker (DeM) indicator showing oversold conditions
Context: Post-earnings profit-taking in established support zone
Position Type: Portfolio addition / accumulation entry
📊 Technical Structure:
0.618 Retracement Zone:
The golden ratio retracement level has historically marked the deepest pullback point before trend continuation in quality growth names. NIO's current price sits precisely at this mathematical level from the recent swing low to swing high.
DeMarker Oversold Signal:
The DeM indicator measures buying and selling pressure. Current readings show exhaustion of selling pressure, suggesting the pullback may be nearing completion. This technical oscillator complements the structural support from Fibonacci analysis.
Post-Earnings Pattern:
NIO reported solid earnings but experienced typical "sell the news" behavior. This creates opportunity:
Fundamentals improved (earnings beat)
Technical setup aligned (0.618 + oversold)
Emotional selling exhausted (DeM signal)
📈 Why This Pullback Makes Sense:
Earnings Were Positive:
NIO delivered results that met or exceeded expectations, yet price pulled back due to profit-taking and sector rotation. This disconnect between fundamentals and price action creates entry opportunities.
Structural Support:
The 0.618 level isn't arbitrary—it represents the mathematical zone where buyers historically step in during corrections within uptrends. Price has shown respect for this level in prior pullbacks.
Momentum Exhaustion:
DeM oversold readings suggest sellers have pushed price to an extreme. Mean reversion probability increases when technical oscillators reach these zones combined with structural support.
🎯 Risk/Reward Framework:
Entry Consideration: Current 0.618 retracement zone
Invalidation Level: Below the 0.786 Fibonacci level (deeper support)
First Target: Previous swing high (pre-earnings level)
Extended Target: Fibonacci extension levels above prior highs
Why Risk Is Defined:
If price breaks below the 0.786 level, the pullback becomes deeper than typical healthy corrections. This provides a clear invalidation point for the bullish thesis.
Why Reward Is Probable:
Post-earnings pullbacks in growth stocks with improving fundamentals often reverse sharply once technical oversold conditions are resolved and profit-taking concludes.
🛡️ Portfolio Addition Strategy:
Why "Portfolio Add" vs "Full Position":
This isn't a "go all-in" signal. It's a strategic addition to existing holdings or a new position sized appropriately for a growth stock with inherent volatility.
Position Sizing Approach:
Smaller position size than blue-chip holdings (NIO carries more volatility)
Scaled entry across the 0.618 zone (not lump sum)
Risk limited to 1-2% of total portfolio capital
Scaling Method:
First entry at current 0.618 level
Second entry if price tests 0.786 (deeper pullback)
Reserve capital for final add if maximum pain occurs but structure holds
📊 Technical Indicators Confluence:
Fibonacci Retracement:
Mathematical zone showing where pullbacks historically find support in trending assets.
DeMarker Oscillator:
Momentum indicator showing exhaustion of selling pressure. When DeM reaches oversold territory at structural support, reversal probability increases.
Volume Analysis:
Recent selling volume shows signs of climax rather than acceleration—typical of profit-taking bottoms, not fundamental breakdowns.
Support/Resistance:
Previous resistance zones now acting as support, indicating role reversal that often precedes continuation moves.
🧠 Trader Psychology: The Post-Earnings Trap:
Why Most Miss This:
After good earnings, traders expect immediate upside. When price pulls back instead, they assume "something must be wrong" and avoid the stock entirely.
The Reality:
Earnings beats often trigger profit-taking as early holders exit and new buyers wait for "better prices." This creates the pullback that becomes the better price.
Emotional vs Structural:
Emotional view: "Earnings were good but price is falling—stay away"
Structural view: "Earnings confirmed fundamentals, price at support—add position"
Historical Pattern:
Quality growth stocks frequently pull back 10-15% post-earnings before resuming uptrends. This isn't failure—it's opportunity for patient capital.
📈 Why EV Sector Context Matters:
Sector Rotation:
EV stocks experience waves of sector rotation as investors move between growth and value. Pullbacks during rotation create entry points before the next leg up.
NIO's Position:
As a leading Chinese EV manufacturer with improving fundamentals, NIO represents exposure to the electric vehicle transformation in the world's largest auto market.
Risk Acknowledgment:
Chinese equities carry geopolitical and regulatory risks. Position sizing must account for these additional variables beyond pure technical analysis.
📅 Timeframe Expectations:
Not a Day Trade:
Post-earnings consolidations can take weeks to resolve. This is a position trade, not a scalp.
Potential Catalysts:
Delivery number announcements
Sector momentum shifts back to growth names
Technical resolution of oversold conditions
Broader market stability
Patience Required:
The 0.618 level may be tested multiple times before resolving higher. Position sizing should accommodate short-term volatility without forced exits.
⚠️ Risk Considerations:
Volatility:
NIO exhibits higher volatility than large-cap U.S. equities. Daily swings of 5-10% are not uncommon. Position sizing must reflect this reality.
Geopolitical Risk:
Chinese stocks face regulatory uncertainty and U.S.-China relations risks. These macro factors can override technical setups.
Sector Sentiment:
If EV sector sentiment deteriorates broadly, individual stock structure may not hold. Monitor sector ETFs for confirmation.
Support Breakdown:
If price closes decisively below the 0.786 Fibonacci level, the pullback becomes deeper than healthy corrections typically allow. This invalidates the thesis and requires disciplined exit.
🏆 The Professional Approach to Growth Stocks:
They Size Appropriately:
Growth stocks get smaller position sizes than stable dividend payers. Volatility demands this discipline.
They Buy Weakness in Strong Names:
When fundamentals improve but price pulls back, professionals add. When fundamentals deteriorate but price rallies, they exit.
They Use Technical Structure:
The 0.618 level + DeM oversold isn't fortune-telling—it's identifying zones where probability tilts in favor of reversal based on historical patterns.
They Accept Uncertainty:
No one knows if the bottom is today, tomorrow, or next week. But at structural support with oversold readings after positive earnings, probability favors the long side with defined risk.
📌 Key Takeaways:
✅ Fundamentals + Technicals align: Earnings beat + 0.618 support + DeM oversold creates multi-factor confluence.
✅ Post-earnings pullback is normal: Good earnings don't guarantee immediate upside. Profit-taking creates entry opportunities.
✅ Portfolio addition, not speculation: This is sized as a growth allocation within a diversified portfolio, not a lottery ticket.
✅ Risk is defined: Below 0.786 invalidates the setup. No hoping, no averaging into a broken structure.
✅ Patience over prediction: The bottom may take days or weeks to form. Structure identifies the zone; time confirms the entry.
⚠️ Important Disclaimers:
This analysis is for educational purposes and reflects a technical view based on Fibonacci retracement levels, momentum indicators, and post-earnings price behavior. It is not financial advice or a recommendation to buy or sell NIO or any security.
NIO operates in a volatile sector and jurisdiction with additional geopolitical risks. The 0.618 support level could fail, and the DeM indicator can remain oversold during extended downtrends. No technical pattern guarantees reversal.
Chinese equities carry regulatory, political, and currency risks beyond typical equity investments. Position sizing must account for these additional risk factors.
Earnings results do not guarantee future stock performance. Post-earnings pullbacks can extend beyond typical retracement levels during broader market weakness.
Always conduct independent research, consider your risk tolerance, and consult with a financial professional. All investing involves risk of loss.
✨ Your Perspective:
Are you watching NIO or other EV names at these levels? How do you approach post-earnings pullbacks in growth stocks? Share your thoughts in the comments.
📜 Buy structure. Size appropriately. Trade with discipline.

Nio Inc. (NIO) Shows Early Signs of a Potential Trend ReversalA technical review of Nio Inc. (NIO) suggests the electric vehicle manufacturer may be in the early stages of a significant chart reversal. After a prolonged period of downward pressure or consolidation, the price action is beginning to exhibit classic characteristics of a potential bullish turnaround. Key indicators, which may include a break above a minor downtrend resistance line, stabilizing volume patterns, or emerging bullish candlestick formations, are contributing to this constructive outlook.
Trading Strategy & Key Levels
For traders considering a position based on this potential reversal setup, the current zone appears to offer a favorable risk-to-reward profile for entry.
Entry & Stop-Loss: A strategic stop-loss order is recommended just below the recent swing low, placed at $5.50. This level acts as a critical invalidation point; a breach below it would likely negate the current reversal hypothesis and signal a resumption of the prior downtrend.
Primary Profit Targets: The initial take-profit target is set at $6.00, a level that may have previously acted as resistance. The secondary and more ambitious target is at $6.40, which represents a more significant technical hurdle. Taking partial profits at the first target is a prudent strategy to manage risk.
The Bullish Scenario: A Breakout to Higher Ground
Should the bullish momentum continue to build and the price convincingly breaks above the $6.40 resistance level—particularly on high volume—it would signal a substantial shift in market structure and a confirmation of stronger bullish conviction. In this scenario, the next major resistance zone comes into focus around $7.50, representing a longer-term objective for the reversal pattern.
Conclusion
While the nascent reversal pattern in Nio is technically promising, it is not without risk. The setup suggests a potential long opportunity with a clearly defined invalidation point at $5.50. A disciplined approach, adhering to these key levels, is essential for navigating this speculative yet potentially rewarding trade setup.

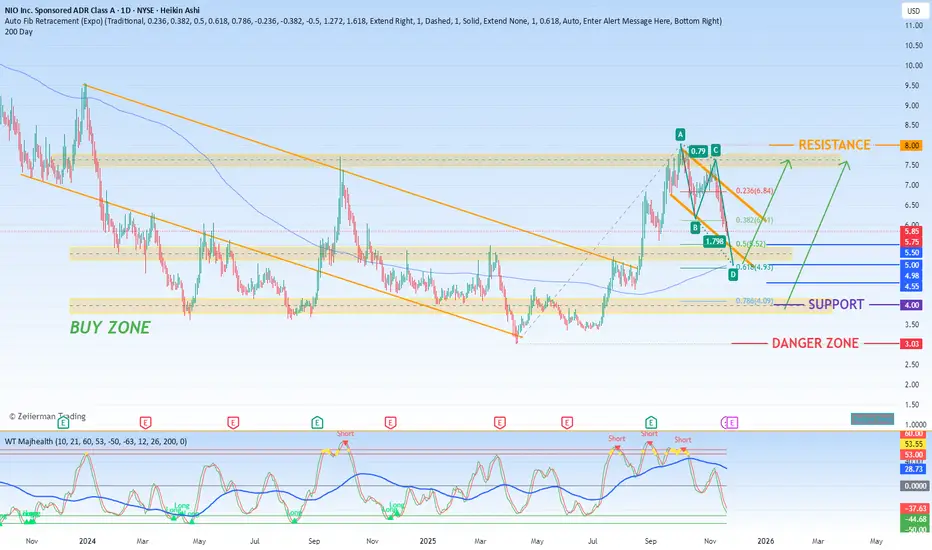
$NIO: The Key Levels to WatchNIO Inc. is a Chinese automotive technology company founded on November 28, 2014, and headquartered in Jiading. Its operations are centered on the electric vehicle market and a unique user-centric ecosystem.
Core Products: Design and manufacture of electric vehicles, including the ES8 7-seater SUV and the high-performance EP9 supercar.
Power Solutions: A comprehensive network of charging options, including home charging, public access, express valet services, mobile charging trucks, and its signature battery swapping technology.
Additional Services: Value-added offerings such as service packages, battery payment plans, vehicle financing, and license plate registration assistance.
Beyond its business as a comprehensive EV and power solutions company, NYSE:NIO 's stock ( NYSE:NIO ) is currently trading within a well-defined range. Here’s a tactical breakdown of the essential levels for your trading plan:
The Ceiling (Resistance): $8.00 is the wall. Until this level is convincingly broken to the upside, the overall bias remains range-bound to bearish. Any approach to this level is a potential area for taking profits or for aggressive traders to consider short positions.
The Floor (Support): $4.00 is the absolute floor. This is the level that must hold to prevent a significant downturn. Long positions become increasingly risky if the price starts to consolidate below $4.50.
The Abyss (Danger Zone): If $4.00 breaks, prepare for a rapid move down to $3.00. This is the "Danger Zone," and a break here could lead to catastrophic losses. All bullish bets should be re-evaluated if this level is tested.
The Buy Zones:
Zone 1 (Cautious Accumulation): $5.00. Start scaling into long positions here, but keep size small.
Zone 2 (High-Conviction Accumulation): $4.50. This is the prime zone to add to positions, as it offers a tighter stop-loss below the $4.00 support and a more favorable risk/reward setup.
12 Stocks to add to your portfolio (Part one)I added these stocks to my portfolio after some research. I believe they may provide good value it the next 1 to 2 years which is normally my horizon.
Disclaimer: not financial advice. Do your own research

NIO | China will Lead the EV BattleNIO, Inc. is a holding company which engages in the design, manufacture, and sale of electric vehicles. Its products include the EP9 supercar and ES8 7-seater SUV. It provides users with home charging, power express valet services, and other power solutions including access to public charging, access to power mobile charging trucks, and battery swapping. It also offers other value-added services such as service package, battery payment arrangement, and vehicle financing and license plate registration. The company was founded by Bin Li and Li Hong Qin on November 28, 2014 and is headquartered in Jiading, China.

NIO — The Spark Before the Storm $10000⚡ NIO: The Spark Before the Storm — A New SuperCycle Is Born ⚡🚗
"The storm that started with Tesla is about to find its next wave."
NIO just finished its deep correction of Wave 2 — and Wave 3 is ready to change everything. 🔥
🌩️ The Setup
From hype to despair — that’s how every SuperCycle begins.
After the 2021 peak, NIO collapsed into silence, grinding through a brutal 0.618 Fibonacci retrace.
But markets don’t die in fear — they reset .
And that reset is complete.
Now, the chart shows what could be the first true SuperCycle ignition for NIO — the same point Tesla stood at a decade ago.
🌊 The Wave Map
1️⃣ Wave 1 (2019–2021) — The hype wave. EV mania, hope, and early adoption.
2️⃣ Wave 2 (2021–2025) — The cleansing wave. Fear, dilution, exhaustion.
3️⃣ Wave 3 (2025–2029) — The expansion wave.
🔥 Projected zone: $450 (1.618)
4️⃣ Wave 4 (2030–2032) — The reset.
5️⃣ Wave 5 (2032–2035) — The final mania.
Every great company survives Wave 2… and dominates in Wave 3.
🧭 The Technical Pulse
Major liquidity sweep below $8 → Smart Money re-entry.
Break of Structure (BoS) confirmation above $10 = start of markup phase.
Fair Value Gap (FVG) near $6–9 = accumulation zone.
Fib geometry + historical rhythm = 3rd wave setup confirmed.
Price is coiling under long-term resistance — the spring before expansion.
⚙️ Macro + Fundamentals
EV market entering mass production maturity.
NIO’s battery swap network gives it an unmatched recurring model.
China’s stimulus & EV subsidies may reignite the sector.
Market cap reset = asymmetric opportunity.
This is where long-term conviction separates traders from investors.
🎯 Projection Timeline
📍 Wave 3 → ~$450
🔄 Wave 4 → $100–150 zone
🚀 Wave 5 → $10,000+
💬 Final Take
⚡ NIO’s not dead — it’s recharging.
When Wave 3 hits, disbelief turns to euphoria.
👇 Drop your take — is this the next EV breakout SuperCycle ?
Follow for deep Elliott + Smart Money confluence setups.
#NIO #EVRevolution #Wave3 #ElliottWave #SmartMoneyConcept #FIBCOS #Fibonacci #MarketStructure #TradingView #StockMarket #MacroCycle #Investing #WaveTheory #ElectricVehicles

NIO HIGH PROBABILITY SETUP SOON!!!🚨 NIO HIGH PROBABILITY BUY SETUP 🚨
* Here We Can See Clearly The Next Potential Moves For NIO Coming Hours/Days.
* Keep Your Eyes Close On Your Trading Positions.
* Happy PIP Hunting Traders.
FXKILLA.

NIO HIGH PROBABILITY BUY SETUP SOON!!!🚨 NIO HIGH PROBABILITY BUY SETUP 🚨
* Here We Can See Clearly The Next Potential Move For NIO Coming Hours/Days.
* Keep Your Eyes Close On Your Trading Positions.
* Happy PIP Hunting Traders.
FXKILLA.
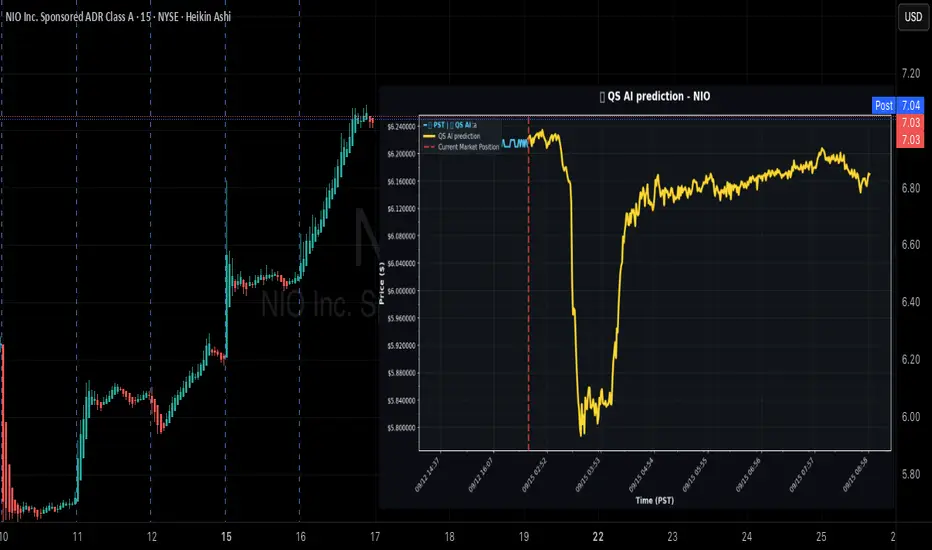
NIO : predicts Intraday Short Setup (Bearish Bias)How AI predicts daily market moves...🚀📈
⚡ NYSE:NIO predicts Intraday Short Setup (Bearish Bias)
📊 Current Market Status
Price: $6.21
Data Quality: ✅ Good
Timeframe: 1-Min K-Line (Intraday)
🎯 Intraday Price Predictions
30-Min → $6.22 (+0.24%)
2-Hr → $6.11 (-1.54%)
End-of-Day → $6.17 (-0.65%)
📈 Extended Outlook
Final Target: $6.17 (-0.65%)
Predicted Volatility: 66.5%
Range: $5.79 – $6.23
⚖️ Trend Analysis
Direction: BEARISH
Confidence: 64%
Bias: 🔻 Leaning downside with volatility expansion
🔑 Key Levels
Support: $5.79
Resistance: $6.23
Range Size: 7.2% of price
🚨 Intraday Trade Signal
Direction: SHORT
Entry: $6.21
Target: $6.18
Stop: $6.30
Confidence: 64%
Expected Move: -0.7%
R/R: 0.34 : 1
Horizon: 390 min (day session)
NIO Share Price Shows Signs of StrengthNIO Share Price Shows Signs of Strength
This week, the media highlighted that the share price of NIO Inc. (NIO), the Chinese smart electric vehicle manufacturer, fell after management announced a $1 billion share offering to raise capital. The funds are intended to finance projects such as the development of EV charging infrastructure.
Indeed, on 10 September, a wide bearish gap appeared on the chart, but by 11 September (yesterday) the bulls had almost entirely recovered the decline. This indicates bullish strength, possibly supported by a solid fundamental backdrop, driven by:
→ the expansion of NIO’s model range (which now includes the budget ONVO brand as well as the premium Firefly series);
→ higher delivery volumes – in the latest reporting quarter the company delivered 72,056 vehicles, up 25.6% compared to the previous period.
The NIO Inc. (NIO) price chart points to further bullish signals.
Technical Analysis of NIO Stock
Price movements are forming an ascending channel (shown in blue), with the following features:
→ The bulls managed to recover from the sharp decline 0→1, after which we observe the 1→6 sequence, typical of a bullish market, as each subsequent low and high is higher than the previous one.
→ Upward impulses are steep, while the subsequent pullbacks (which can be interpreted as a bullish flag pattern, shown in red) look like healthy corrections.
→ Key resistance levels are turning into support. This was the case with $4.40 and $5.30. The black arrow shows that the channel’s median line also acts as support – which led to the price moving above the psychological $6 level.
From a bearish perspective, resistance may be provided by the upper boundary of the current correction zone. However, the third bullish flag could be broken (as were the previous two), which would open the way for NIO’s share price to reach the upper boundary of the blue channel.
This article represents the opinion of the Companies operating under the FXOpen brand only. It is not to be construed as an offer, solicitation, or recommendation with respect to products and services provided by the Companies operating under the FXOpen brand, nor is it to be considered financial advice.
$NIO - $3.40 Price TargetNio is in extremely overbought territory on both the daily and weekly chart all while trending lower on its bearish downward channel. Short at the top of channel for a price objective at first support at $3.40.

NIO HIGH PROBABILITY SETUP SOON!!!🚨 NIO HIGH PROBABILITY BUY SETUP 🚨
* Here We Can See Clearly The Next Potential Move For NIO Coming Hours/Days.
* Keep Your Eyes Close On Your Trading Positions.
* Happy PIP Hunting Traders.
FXKILLA.
NIO HIGH PROBABILITY BUY SETUP SOON!!🚨 NIO HIGH PROBABILITY BUY SETUP 🚨
* Here We Can See Clearly The Next Potential Move For NIO Coming Hours/Days.
* Keep Your Eyes Close On Your Trading Positions.
* Happy PIP Hunting Traders.
£ FXKILLA £
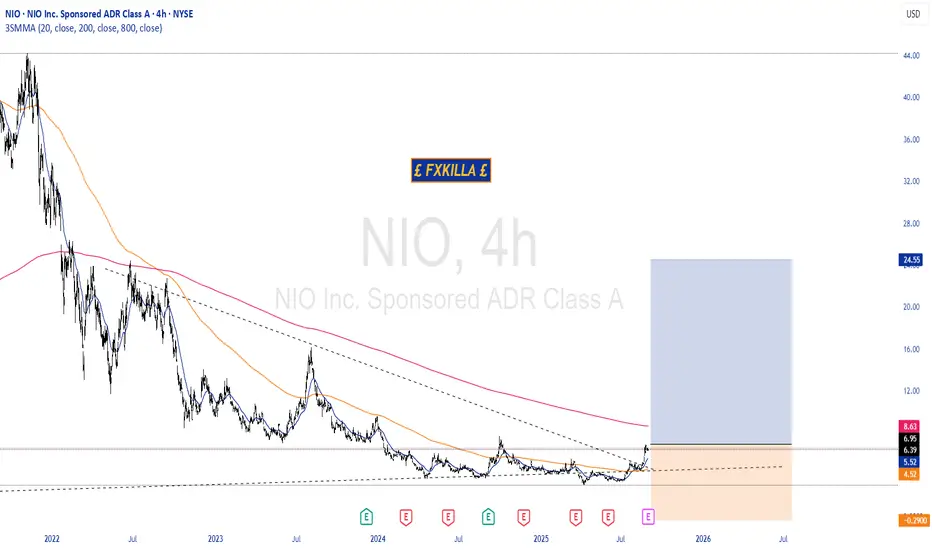
NIO HIGH PROBABILITY SETUP!!🚨 NIO HIGH PROBABILITY BUY SETUP 🚨
* Here We Can See Clearly The Next Potential Move For NIO Coming Hours/Days.
* Keep Your Eyes Close On Your Trading Positions.
*Happy PIP Hunting Traders.
£ FXKILLA £
Is Alibaba entering a stage 2 breakout formation? This video depicts a pure technical summary of Alibaba on multiple different time frames.
We will follow this video up with a fundamental view.
Using previous cycles we believe Alibaba is poised for a 12-24 month explosive move.
Baba looks o be entering the explosive stage 2 formation.
Breaking out and defending monthly chart support...Baba looks great on all time frames.
Many bullish patterns are triggering....Weekly bull flags / inverse head and shoulders.
The minimum upside target if the bullflag completes is around 160 - 165.
We have been long Baba since early July when it kissed the daily 200 MA.

Tesla, Nio, XPEV breakout ahead of NVdA earnings tomorrowTesla is breaking out of a daily chart wedge pattern.
This pattern suggest a move to 400 could occur as long as the indices don't fall on NVDA earnings.
If you look at how some of the China ADR EV companies have performed, Tesla could be well on its way to replicating a move.
All eyes on NVDA earnings tomorrow. Heading into the print with a 58 PE and looking like it wants new highs.
NVDA guidance will once again be crucial for the market. $46B revenue estimate is likely to be beat.
We secured profits on the massive nuclear pop today. SMR calls printed over 100%
