Nvidia loses steam despite exceptional 3Q performance
Nvidia (NVDA) posted a record-breaking 3Q performance, with revenue surging 62% YoY to 57 bln USD. Its 4Q guidance points to another 65% increase, reinforcing optimism that growth momentum will continue to accelerate. CFO Kress noted that the guidance does not include any contribution from China sales, while CEO Huang pushed back against recent AI-bubble concerns raised by Michael Burry.
Nevertheless, AI valuation risks remain elevated. Beyond strong earnings, the scale of AI infrastructure spending and the surge in bond issuance required to fund it continue to dampen investor sentiment.
Goldman Sachs (GS) has warned about the fragility in the private credit market. The firm highlighted that Blue Owl Capital, with more than 295 bln USD in AUM, over half of which is credit-exposed, has seen its share price fall nearly 30% since Sep. Major credit-heavy players such as KKR and Blackstone are also showing signs of pressure, underscoring how AI-driven anxiety is spilling into private credit.
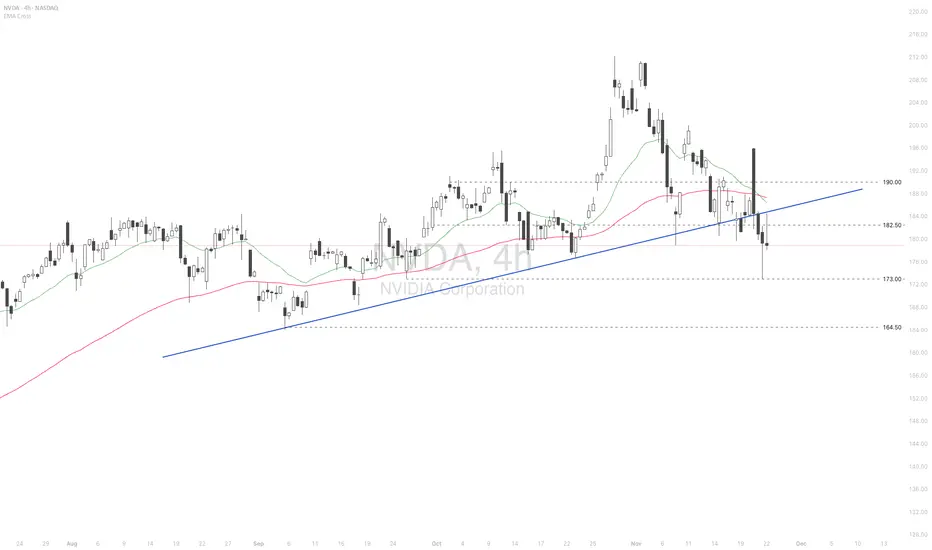
NVDA briefly breached above the psychological level at 195.00 but surrendered all gains, falling back below 182.00. The price remains under the death-crossed EMAs, indicating a potential expansion of the bearish bias.
If NVDA breaks below the support at 173.00, the price could decline further toward the following support at 164.50.
Conversely, if NVDA breaches above the resistance at 182.50 and the ascending trendline, the price may advance toward the subsequent resistance at 190.00.
NVDA
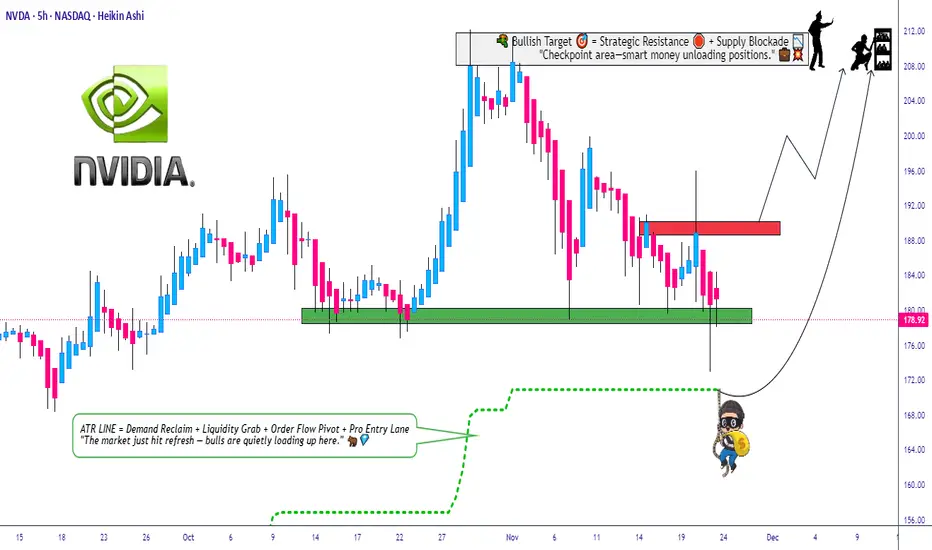
Can NVDA Hold the Pullback Zone and Extend the Uptrend?🔥 NVDA Bullish Pullback Playbook – Thief-Style Swing Setup 🚀🕵️♂️
Hey traders & my fellow Thief OG’s 😎🕶️ — here’s a clean, polished, TradingView-friendly version of my NVDA Swing Trade Playbook with a professional + funny touch. Let’s get to the setup 👇🔥
📌 Asset
NVDA – NVIDIA Corporation (NASDAQ)
Swing Trade | Momentum | Trend-Following Setup
📈 Plan: Bullish Pullback Strategy (Pending Orders Active)
The trend is strong, the buyers are steady, and NVDA is still delivering clean higher-lows. We're waiting for either a breakout continuation or a discounted pullback entry. 📊⚡
🎯 Entry Zones
1️⃣ Breakout Entry – Momentum Thief Mode 🥷⚡
Enter after clearing the nearest resistance at $191.00
• Clean breakout
• Volume confirmation
• Trend continuation strength
2️⃣ Pullback Entry – SuperTrend ATR Sniper Entry 🎯📉
Watch for a discounted pullback near $170.00 around the SuperTrend ATR zone.
• Trend support retest
• Lower-risk entry
• Ideal for swing traders who wait for “patience-pays entries” 😎
🛡️ Stop-Loss (Thief Style – Risk First)
Breakout Entry SL → $180.00
SuperTrend Pullback SL → $160.00
Note: Dear Ladies & Gentlemen (Thief OG’s) ❤️
I’m NOT recommending you use only my SL. Choose your own levels — you make the money, you protect the money. Trade at your own risk 🔐⚠️
🎯 Target (Take-Profit Zone)
Our target → $210.00
Why?
• Strong resistance zone
• Overbought region historically
• Buyer trap zone where police force 🚔👮♂️ usually waits — so escape with profits early 😂💨
Note: Dear Ladies & Gentlemen (Thief OG’s) 🙌
I’m NOT recommending you set my TP only. Choose your own TP — your money, your exit. Trade with responsibility 💼💰
🔍 Related Pairs to Watch (Correlation Insights + Key Notes)
NASDAQ:AMD
• High positive correlation with NVDA
• When AMD shows volume expansion, NVDA often follows
• Good for momentum confirmation 🔥
NASDAQ:SOXX (iShares Semiconductor ETF)
• NVDA is a major weighted component
• ETF direction confirms big-money flow 🧠💸
• Great for spotting sector-wide risk-on / risk-off shifts
NASDAQ:QQQ (NASDAQ 100 ETF)
• NVDA is one of the heaviest weights
• If QQQ trends strongly → NVDA often mirrors
• Macro sentiment index for tech strength 📊⚡
NASDAQ:SMH (VanEck Semiconductor ETF)
• Clean supply/demand signals
• NVDA mirrors SMH breakouts frequently
• Helps confirm breakout validity before taking the trade
All these help you avoid fakeouts and align with overall semiconductor market strength.
✨ “If you find value in my analysis, a 👍 and 🚀 boost is much appreciated — it helps me share more setups with the community!”
⚠️ This is a thief-style trading strategy created just for fun. Trade responsibly.
I guess it is a bubble...When the CEO is selling, the CFO is selling, SoftBank is unloading, Peter Thiel is selling, and Michael Burry is short, you have to stop and ask the only question that matters:
Is it actually smart to buy the dip here?
I didn’t even bother checking the latest SMH holdings, but if anyone wants to post the updated weightings, it would help frame how much passive-flow risk still sits above price.
The real question is whether there’s room left on the downside and whether this is anywhere near a bottom. If you want an example of how low “too low” can go, just study META during its unwinding. Fundamentals didn’t matter. Valuation didn’t matter. Price just kept repricing until forced sellers were done.
The one positive about this environment is volatility. When liquidity thins out and ranges widen, both sides can pull money out — but only if you treat it like a scalp environment, not a swing-long hero trade.
Because think about it rationally:
Do you want to be the one buying while billionaires, insiders, and institutions are selling into strength?
We’re moving into year-end — historically the period where funds clean books, tax-loss harvest, and unwind risk. Pair that with the probability of crypto-liquidation bleed-through, and you can easily get a chain reaction. Markets don’t fall in straight lines; they fall like Jenga blocks, dominoes, or a card tower collapsing from the bottom up.
This isn’t doom posting — it’s just market structure.
Flow dictates direction, and right now the flow is one-directional.

NVDA Cooked!?If you find this information inspiring/helpful, please consider a boost and follow! Any questions or comments, please leave a comment!
NVDA Price Action Update: Key Levels To Watch
NVDA is cooked if it cannot reclaim the key levels overhead. Price is currently testing 178 and this area is critical for determining whether buyers still have any momentum left.
To flip this structure back upward, NVDA needs an impulse through 178 and then 184. Anything that retraces in a choppy or corrective manner within the impulsive range from 195 is suspect and suggests continuation lower.
If buyers fail to generate an impulsive move from here, the downside levels below come back into play. Seller control increases with every failed retest and every weak bounce.
This is a simple structure play. Impulsive strength is required to shift control. Corrective behavior keeps the door open for further decline.
Trade safe and trade clarity.
Stocks Worth Your AttentionI wanted to share a list of high growth, high margin stocks that are worth looking into. This is where I pull a lot of my core positions from.
HIMS is noteworthy as it's also one of the most heavily shorted stocks at the moment and THE best performer on my ranking.
These stocks are essentially cash cows dominating their space. Please do look into each one carefully. This list is algo generated and not combed through by me yet. So make sure the stock's earnings and trend are to your liking.
Enjoy and good luck!

Stock Market Forecast | BTC TSLA NVDA AAPL AMZN META MSFTStock Market Forecast | SP:SPX CME_MINI:NQ1! CME_MINI:ES1! CRYPTOCAP:BTC
Mag 7 | TSLA NVDA AAPL AMZN META MSFT

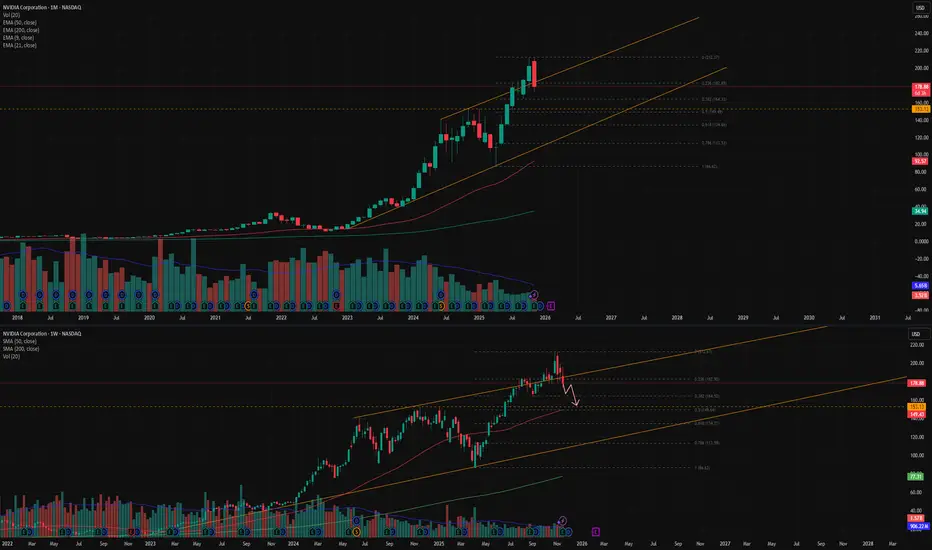
NVIDIA (NVDA): Where Are We in the Cycle?Ticker: NVDA
Category: Market Structure / Elliott Wave Analysis
Author’s note: Educational analysis — not financial advice.
🧠 Market Context
NVIDIA has been one of the strongest growth stories in the last market cycle. However, after such a powerful move, many traders are now asking: Where are we in the broader structure — and what could come next?
From a structural perspective, NVDA appears to have completed its third Elliott Wave, with the fourth wave currently in progress. This phase often reflects a period of consolidation, where the market digests previous gains before potentially starting the fifth wave.
📊 Elliott Wave Structure
Through the lens of Elliott Wave theory:
Wave 3 — likely completed after the parabolic advance that marked NVIDIA’s latest all-time highs.
Wave 4 — a corrective phase, potentially forming a sideways or slightly downward structure.
Wave 5 (ahead?) — may still occur, possibly extending above the upper boundary of the current price channel.
However, once the fifth wave completes, markets typically enter a longer consolidation or corrective phase — often retracing 50–60% of the total move from the highs.
⚙️ Volatility and Price Range
Currently, NVDA is trading within a broad channel, roughly between $100 and $400+.
Volatility remains elevated — which suggests that the sideways phase could persist for several months, or even longer.
Such behavior is common in late-cycle stages when large market participants distribute part of their holdings while retail interest remains high.
📈 Key Takeaways
The main impulsive move seems to have already played out.
The market may enter a range-bound or sideways phase, with local rallies still possible.
Correction risks are gradually increasing, especially if the fifth wave develops and fails to sustain new highs.
In short, this might not be the best time to chase — but rather to observe how price behaves within the current channel.
💬 Final Thoughts
This analysis is purely educational and reflects one possible scenario based on market structure.
No one can predict the exact timing or depth of the next move — the market always decides.
👉 What do you think?
Are we already in the correction phase, or is there still one more leg up left for NVDA?
Share your view in the comments below 👇
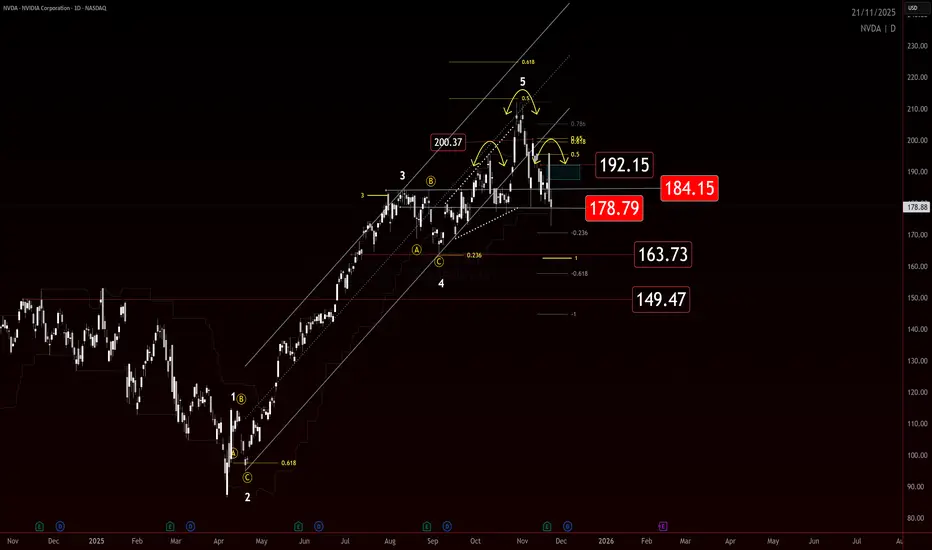
NVDA ALERT: Critical Drop AheadNvidia remains in a broader uptrend, but the chart shows a clear trendline breakout followed by the beginning of a pullback.
Using Fibonacci, a correction typically starts after a red candle forms following a sequence of green candles. In most cases, the pullback continues toward the 0.5 retracement level. In this setup, the 0.5 level aligns with a major key support, increasing its importance.
On the weekly timeframe, the 50 EMA is also converging at the same zone, which often acts like a magnet for price. This creates multiple confirmations pointing toward a potential move downward.
The weekly chart has printed a bearish engulfing , followed by three consecutive red candles, adding another strong confirmation for a continued correction.
Both MACD and RSI are sloping downward, supporting the bearish momentum.
If price reaches the expected zone, monitoring the reaction will be critical. A deeper decline into the global trendline is possible only if the key level is broken, though this scenario appears less likely.
Overall, NVDA shows several aligned signals indicating a move toward the correction zone before any potential recovery.
Stock market will test yearly levels below current supportAs the yearly candle closes and the new one opens, there is an orderflow pattern that is well developed. This will play out again as always 💎

NVDA PUT Trade — QuantSignals Katy High-Conviction ShortNVDA | QuantSignals Katy 1M Prediction (2025-11-21)
Current Price: $178.81
Predicted Close: $173.03 (-3.23%)
30-min Target: $177.19 (-0.91%)
Trend: Bearish
Confidence: 75%
Volatility: 49.6%
Trade Signal
Direction: PUT
Entry: $178.81
Target: $174.18
Stop Loss: $181.49
Expected Move: -3.23%
Summary: 1 trade signal generated from 1 successful analysis.

NVDA Head and Shoulders- Dec Rate Cuts has changed setupNvidia’s setup has shifted. With the Fed signaling a likely rate cut on December 10th, the market will start baking that optimism into asset prices ahead of time. When monetary conditions ease, high-valuation tech often gets an extra tailwind, which means the expected head-and-shoulders pattern on NVDA may fail to play out cleanly. The chart might still roll over, but the macro backdrop now works against a decisive breakdown. Short positions here demand caution.
Original post
Nvidia’s bear case rests on one core idea: the stock price assumes a flawless, world-eating AI future, and markets almost never deliver on “perfection narratives.” NVDA trades at extreme valuation multiples for a hardware-driven, highly cyclical business. Those multiples only hold if AI infrastructure spending keeps compounding at its current breathtaking pace for years. But that demand is dangerously concentrated in a handful of hyperscalers who are spending now and rationalizing later. Michael Burry’s recent argument sharpens this point: he claims true end-demand for AI horsepower is vastly overstated, and that much of the current GPU frenzy is a self-reinforcing loop of capital, hype, and accounting gimmicks rather than broad, organic need. If boards pause to question real ROI, or if the circular funding loop breaks Nvidia’s revenue curve can flatten quickly, dragging the valuation down with it.
Competition, long dismissed by NVIDIA bulls, is another structural headwind. AMD is now shipping accelerators that hyperscalers are actually integrating, and every major cloud provider is building in-house silicon to reduce dependence on NVDA’s margins. Even if Nvidia maintains leadership, it doesn’t need to lose the crown to lose the multiple, slight shifts in workload allocation or a handful of missed design wins are enough to pressure margins. And Burry’s critique deepens this point: he argues Nvidia’s reported profitability is flattered by depreciation assumptions and massive stock-based compensation that buybacks have failed to offset, meaning the “true” economic profit is less bulletproof than headlines suggest. Add to that the fact that U.S. export controls have effectively erased the China data-center market, once 20–25% of revenues and expectations of a seamless global TAM look increasingly unrealistic.
Technically, NVDA is doing exactly what a euphoric, overowned stock does when gravity starts tugging: momentum is fading, the price is slipping under short-term moving averages, and reactions to spectacular earnings have been strangely sluggish. That’s often the early signature of distribution rather than accumulation. And this lines up directly with Burry’s broader thesis: when a narrative becomes crowded and reflexive, the slightest wobble triggers violent air pockets. NVDA has become the ultimate proxy for the AI boom, the most crowded long in the market, meaning it’s the first thing funds sell when risk appetite cools, and the last thing buyers chase during corrections.
Put simply, Nvidia is a phenomenal company priced as if nothing can ever go wrong, while Burry is arguing that much of what looks “perfect” is not what it seems. The bear case isn’t that Nvidia collapses. It’s that the AI boom normalizes, competition accelerates, accounting realities catch up, margins slip toward something earthbound, and investors recalibrate how much they’re willing to pay. In that world, NVDA doesn’t need bad news to fall. It only needs the news to arrive slightly less euphoric than the fantasies currently baked into the price.
#NVDA #Bearish #HeadandShoulders #MichaelBurry

Looking to long CRWV at $60Previously I was bearish on coreweave, and wow did that cause some strife in the comments, but I've closed my short yesterday and now looking to long $60.
Good luck!

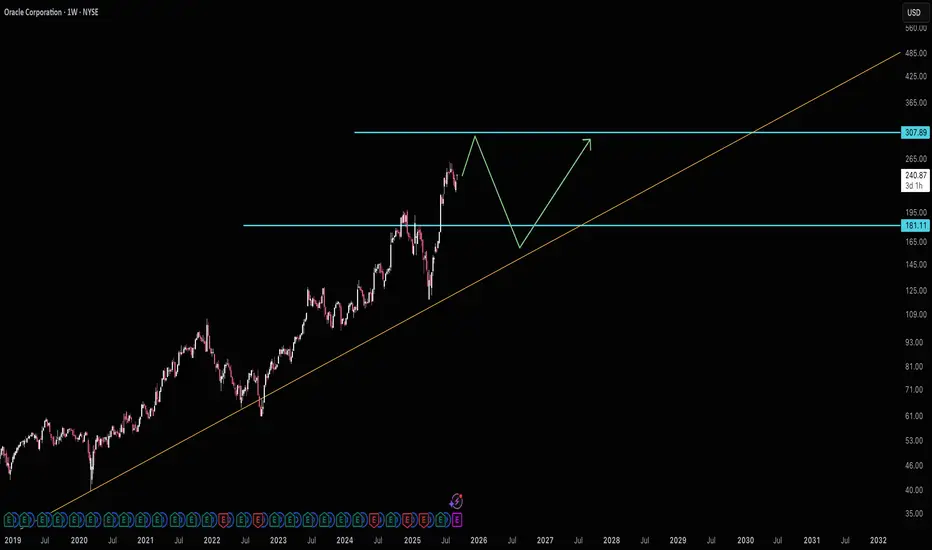
Oracle wants $181Oracle is well off it's long term average and accelerating growth by around 4 years if it hits $307. If it makes it there I would *highly* suggest selling and even potentially a short position. A fair price for ORCL would be $181.
Good luck!
Daily QQQ (US100-NQ) Outlook - Prediction (20 NOV)Daily QQQ (US100-NQ) Outlook - Prediction
📊 Market Sentiment
Market sentiment appears neutral to bullish right now, in my opinion. The FED may pause rate cuts in December, which previously contributed to selling pressure and hedging flows. However, with the U.S. government reopening last week, updated economic data will begin to flow again. If employment data weakens and CPI comes in low or stable, it could support renewed bullish momentum.
NVDA beat earnings expectations and addressed AI bubble concerns clearly. AI demand remains strong, and their revenue growth continues to accelerate. U.S. tech firms turned notably green after the release, further boosting bullish sentiment.
📈 Technical Analysis
Price is currently rising toward 613.5 following NVDA’s earnings results. A strong bullish candle close has appeared on NQ, indicating solid upward momentum heading into today’s session.
📌 Game Plan – Prediction
I will be buying calls at the opening, targeting 613.5 first. After that, I will be targeting 625. If I see a 1H bearish close below the opening price, I will exit my positions, as I expect strong bullish momentum after the market opens.
💬 For detailed insights and broader market context, please check my Substack link in profile.
⚠️ For educational purposes only. This is not financial advice.

XRP HOLIDAY SALE!The overall crypto market has been sliding off recent highs since late September. This was after crypto markets created gap structures on the October 10th sell off. The gap left on XRP was priced in near $1.99-$1.98. We have just reached this liquidity zone. I expect fear to boost and bears to be trapped as the crypto season approaches the holidays, this should be an early Black Friday sale to new highs toward $4 and higher.
Happy Thanksgiving and Early Christmas
-This is not financial advice, R2C.

Breaking: Nvidia ($NVDA) Crush Q3 Earnings Nvidia ( NASDAQ:NVDA ) stock saw a noteworthy uptick of 5% in early Thursday premarket trading albeit market turmoil. The asset reported earnings yesterday after market close sparking bullish sentiment.
The asset is approaching the $200 resistant as the RSI is at 47 giving room for massive upside.
The Shares of Nvidia popped in premarket trade after the U.S. firm beat expectations in third-quarter results after the closing bell on Wednesday.
Shares were last trading 5.5% higher at 4:15 a.m. ET.
Nvidia topped forecasts for revenue, which jumped 62% to $57.01 billion year-on-year, and issued stronger-than-expected fourth-quarter sales guidance.
“There’s been a lot of talk about an AI bubble,” Nvidia CEO Jensen Huang told investors on an earnings call, as the firm set out its view of the industry. “From our vantage point, we see something very different.”
Financial Performance
In 2024, NVIDIA's revenue was $130.50 billion, an increase of 114.20% compared to the previous year's $60.92 billion. Earnings were $72.88 billion, an increase of 144.89%.
Financial Performance
In 2024, NVIDIA's revenue was $130.50 billion, an increase of 114.20% compared to the previous year's $60.92 billion. Earnings were $72.88 billion, an increase of 144.89%.
About NVDA
NVIDIA Corporation, a computing infrastructure company, provides graphics and compute and networking solutions in the United States, Singapore, Taiwan, China, Hong Kong, and internationally. The Compute & Networking segment includes its Data Centre accelerated computing platforms and artificial intelligence solutions and software; networking; automotive platforms and autonomous and electric vehicle solutions; Jetson for robotics and other embedded platforms; and DGX Cloud computing services.

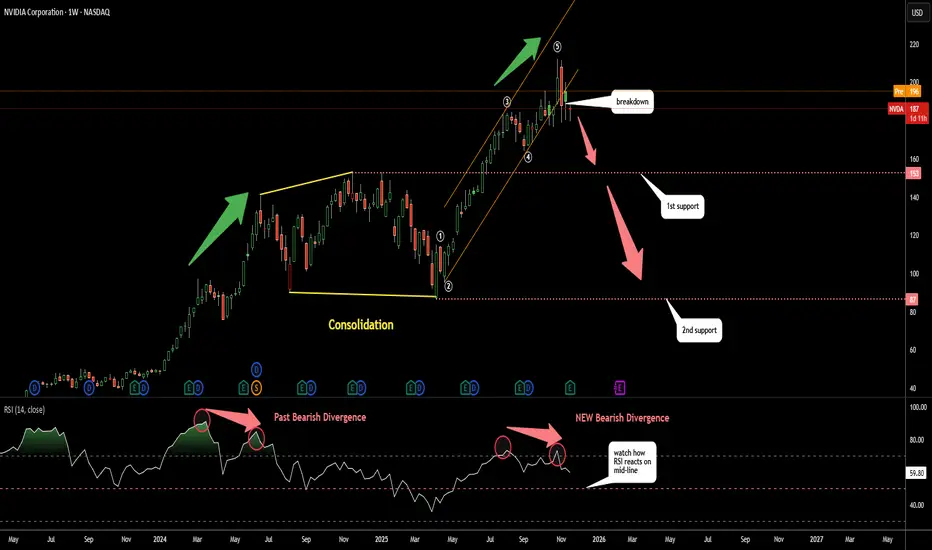
Nvdia (NVDA): How Deep It Can Dip?The RSI is not buying the hype as it shows clear Bearish Divergence
This aligns with the current impulse wave count suggesting the 5 wave structure may now be complete and the orange uptrend has been broken
Last year a similar Bearish Divergence triggered a large consolidation phase marked in yellow
It may repeat again
First support is at 153 the top of the previous consolidation
Second support is at 87 the bottom of that consolidation
Nvidia Earnings Finally Ease Market Jitters. Are AI Bulls Back?It’s confirmed. This is Nvidia’s stock market and we all live in it.
Nvidia NASDAQ:NVDA reported yet another record-breaking quarter, instantly soothing market nerves after a week filled with talks of “AI bubble,” “valuation fever,” and “maybe Michael Burry is right again.” It was the cherry of the earnings season .
The chipmaking giant announced $57 billion in sales during the most recent quarter.
The figure is up 62% year-over-year and way above estimates. In other words, Nvidia didn’t just calm the market. It kicked the door open and shouted: “Get in losers, we’re going shopping.”
CEO Jensen Huang was even more enthusiastic, declaring that “AI is going everywhere, doing everything, all at once.” In classic Huang fashion, you could almost smell the leather jacket.
💽 Data Center Demand: Still Insatiable
Let’s cut to the headline number: $51.2 billion in data-center revenue. Analysts expected $49 billion. Nvidia delivered more.
The company’s new Blackwell GPUs, described by Huang as “off the charts” when it comes to demand, continue to fly off the production line the moment they’re made.
Quarterly net income hit a whopping $31.9 billion, up 65% from the year prior. At a time when most companies celebrate single-digit percentage growth, Nvidia is casually stacking double and triple digits.
📈 Markets Exhale, Futures Soar
The relief was immediate and widespread. You could say that Nvidia’s earnings are not just earnings anymore, but a macro signal.
Here’s what the picture looked like after the release:
CoreWeave NASDAQ:CRWV jumped 10%
Futures tied to the Nasdaq NASDAQ:IXIC climbed 2%
Every Magnificent Seven stock flashing green
Investors had been waiting for confirmation that the AI boom still had room. And Nvidia delivered enough reassurance to light up the entire tech complex.
“Okay. Maybe we don’t need to rotate into utilities just yet,” every tech bro, probably.
😬 The Stakes Were High. Really High.
The reaction, though, must be taken within the current context. Over the past few weeks, tech stocks were hit by deep selloffs as markets fretted over the same question: “Is AI too expensive?”
Between skyrocketing capital expenditures, absurdly ambitious data-center budgets, and the kind of spending plans that would make even sovereign wealth funds blush, investors wondered whether Big Tech was building an AI future or an AI money pit.
Even Michael Burry stepped in, revealing positions betting against Nvidia NASDAQ:NVDA and Palantir NASDAQ:PLTR . That move alone sent pockets of the market into a philosophical crisis.
After all, that’s the guy from “The Big Short” and he’s hedged against your favorite trade.
🤖 So… Are the Bulls Back?
Maybe. For now at least. But with conditions.
Nvidia’s stock more than doubled between April and late October, only to slide in recent weeks as bubble fears thickened. Year to date, the stock is still up about 30%.
Nvidia’s numbers prove that AI spending is still accelerating. But the broader question remains: Can companies actually turn those massive AI investments into profit?
Nvidia’s blowout quarter just reset the narrative:
AI demand is still real
Spending is justified
The cycle is still “virtuous,” in Huang’s words
After this earnings print, the bull case has something it desperately needed: momentum.
And momentum is a powerful thing, especially in a market that had started to doubt its favorite story.
Off to you : Do you still see room for growth in the AI space? Or is that rebound a short-term reflex? Share your views in the comments!

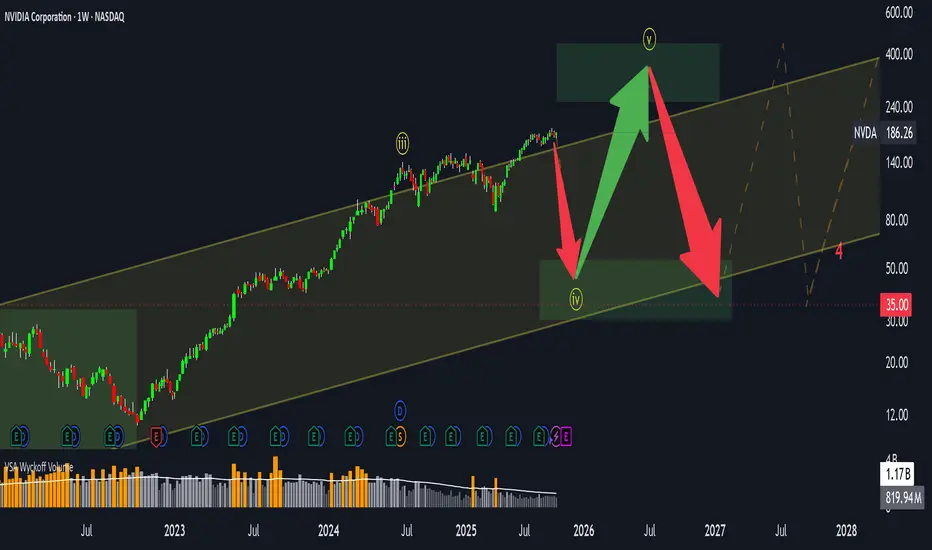
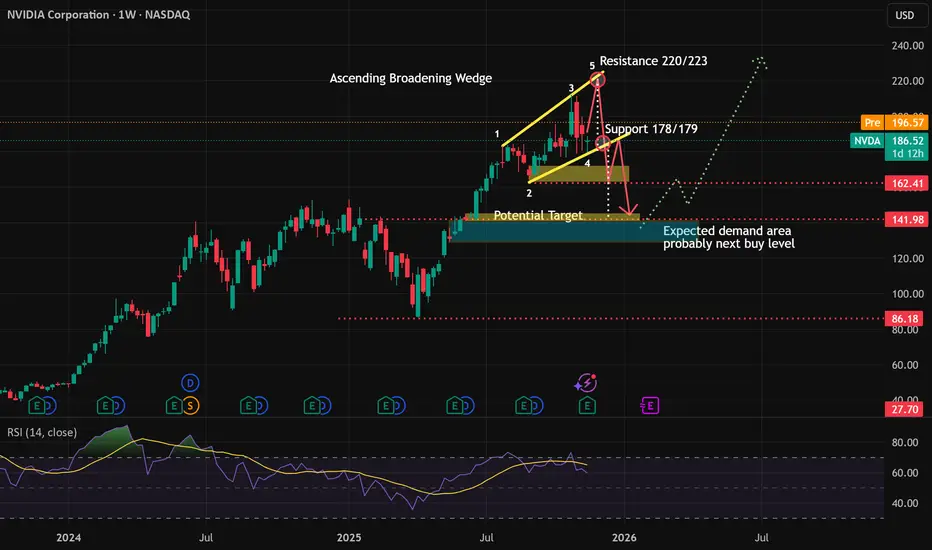
Ascending Broadening Wedge for NVIDIA Weekly ChartThe downtrend probably won't be happen in the near term, but the rebound alson have limited upside. But at least there are 2 possibilities ahead of the price.
I suspect Ascending Broadening Wedge is in process in weekly chart for Nvidia. The concern is the potensial downtrend pressure, especially if support trendline break.
I devide it on 2 scenario :
1. Rebound to 220/223 first. This mean no immediate breakout support anytime soon based on the count. The price will have to raise first with maximum target 220/223 before followed with rejection. But the raise don't have to be exactly 220/223. It can also retest the previous high (3) before rejected and fall.
2. No rebound, support 177/178 immediately broken, the downtren continues to the target area.
There area possibilities to go up first if Santa Claus Rally succeed to push the price above or near resistance, then after the seasonal trade for Santa Claus or January effect will face the profit taking and underpressure through the supportline.
After the pressure, we probably will see some demand on blue area to push the price back on the uptrend..that ofcourse..if no "AI-buble" coming in coming months
DISCLAIMER
Do with your own risk!
This is not suggestion! This is my personal view on the opportunities that could happen to Nvidia.
BTC: 2021 playbook. People expect a V shape bounce, when I think the odds favor more of a 2021 type of long correction (death cross swing). Reason being, the break of a strong momentum log trend, lower lows in BTC/SPX.
If we are on the bottom --> it took 2 months , before next break out. (20 May -> 20 July).
I think most momentum stocks, like NASDAQ:PLTR , NASDAQ:HOOD should lose their momentum and form tops (people who didnt sell the top, should take profit next time it's at ATH). Stage cycle.
BTC is a risk on indicator. TVC:DXY dollar has broke out, indicating demand for cash.
//November is usually a strong month. Good news - stocks drop is a sign of top.

Nvidia: Downside Pressure Nvidia has recently faced notable downward pressure, but so far has managed to hold above the support level at $176.21. As a result, we continue to anticipate an imminent rally as part of the beige wave V, which should lift the stock into the now-red Target Zone between $227.38 and $260.60. However, if the stock immediately drops below the $176.21 mark, we would expect a new low for the beige wave alt.IV, with the lower $145.50 level still likely to hold.

NVDA Earnings Play: Bullish Calls Despite Katy Neutral BiasNVDA QuantSignals V3 — Earnings Play (2025-11-19)
Direction: BUY CALLS
Confidence: 68% (Medium Conviction)
Risk Level: Moderate
🎯 Trade Setup
Strike: $180
Expiry: 2025-11-21
Entry Range: $9.30 – $9.40
Target 1: $18.60
Target 2: $27.90
Stop Loss: $4.65
Position Size: 3%
📈 Key Metrics
Current Price: $185.06
Implied Move: $13.15 (7.1%)
PCR: 0.46 (Bullish)
24h Move: +0.48%
RSI: 31.3
Support: $180.52
🧠 Analysis Snapshot
Katy AI Prediction: Neutral → slight bearish drift toward $183.56–184.20
Technical Indicators: Mixed (MACD bullish, ROC bearish)
News Sentiment: Strongly Bullish
$100B AI infra deal w/ Brookfield
Presidential endorsement
AI chip testing breakthroughs
Options Flow: Heavy call activity; institutional size at higher strikes
Volatility: VIX 23.25 — elevated
⚡ Why This Trade Works
Bullish news + strong call flow overpowers Katy’s neutral/slightly bearish modeling
Earnings volatility + catalysts create a favorable upside skew
0.63 delta strike gives balanced risk/reward
⚠️ Notes
Moderate confidence → consider smaller sizing
Expect heavy volatility due to 7.1% implied earnings move
Low pre-earnings volume → scale entries if possible

NVDA Earnings, FOMC Minutes, US Non-Farm OH MY!!!All eyes on NVDA and earnings - they matter (a lot)
More important than a beat or miss is the price action around NVDA earnings
-bulls have a long ways to go to reclaim all-time highs
-bears have pressured NVDA enough that it seems like major support could break
FOMC Minutes today
-CME Fed Watch Tool is literally 50/50 on the December rate cut outlook
-if the FED doesn't cut in December, they will likely be cutting in early 2026
US Employment Data
-Remember Non-Farm Payroll? Well it's back with a Thursday release
-58k forecasted, 4.3% unemployment forecasted
-let's see how the release is taken by the markets
Although it feels like "the brink" in many ways, my thoughts as expressed in the video
are I believe the market can win both ways and just provide wild volatility but no real direction or follow through. Negative sentiment is truly awful and it rarely rewards the bears with a sustainable down move. Seasonality is expected but perhaps bulls have grown too complacent. Therefore, the market is comfortable making everybody uncomfortable
More to come later this week when the smoke clears or the dust settles
Thanks for watching!!!
CP
