Stock Market Forecast | TSLA NVDA AAPL AMZN META MSFTStock Market Forecast | CME_MINI:NQ1! CME_MINI:ES1! SP:SPX NASDAQ:NDX
Mag 7 | TSLA NVDA AAPL AMZN META MSFT GOOGL
NVDA

NASDAQ 100 (NDX)-The Grand Super Cycle Journey🧠 The Grand Super Cycle Journey of NASDAQ 100 (NDX)
Here's a comprehensive, narrative-style description of NASDAQ 100 (NDX) INDEX based on Elliott Wave Theory , Smart Money Concepts (SMC) , Fibonacci Retracements/Extensions , Price Action , and Fundamentals across Super Cycle , Macro , and Micro Waves 🔍📈:
🌱 Super Cycle Wave 1: The Birth of Tech (1986–2000)
The journey begins with Wave 1 , ignited by the early tech boom — Microsoft, Intel, and the rise of Silicon Valley 🚀. This impulsive leg spans over a decade, culminating in the dot-com bubble peak in 2000.
🔹 Smart Money Insight: Early accumulation started in the '80s, followed by massive markup into the 1990s. Retail entered late, leading to the euphoric climax in 2000.
🔹 Price Action: Parabolic rallies, breakouts through historical resistance, ending in a massive overextension.
🔹 Fundamentals: Era of growth, innovation, low inflation, and initial internet adoption.
🌪️ Super Cycle Wave 2: The Great Correction (2000–2009)
The bursting of the dot-com bubble triggered a complex correction labeled as W-X-Y. This 9-year structure ends in the 2008–09 financial crisis low. The market retraced to the 0.382 Fibonacci level , a classic deep correction in a strong long-term bull market.
🔸 Smart Money: Distribution at the top → manipulation through global uncertainty (9/11, housing bubble) → reaccumulation near the 2009 lows 🧠📉.
🔸 Fundamentals: Enron scandal, 9/11, housing collapse, Lehman bankruptcy — a decade of fear and instability 🏚️.
🚀 Super Cycle Wave 3: The Exponential Phase (2009–2029)*
The most powerful leg — Wave 3 — is unfolding, targeting an eventual 2.618 Fibonacci extension (~85,000) . This wave is subdivided into 5 Macro Waves , each composed of 5 Micro Waves . Here's how the structure progresses:
⚙️ Macro Wave 1 (2009–2012)
Started at the GFC low, this wave marked the beginning of recovery, finishing with 5 orange micro waves .
🟠 Micro Waves: A clean 5-wave impulse showing the early stages of structural strength.
📊 Price Action: Break of structure (BoS) confirms bullish reversal.
🏦 Fundamentals: QE1/QE2, low interest rates, tech stabilization, birth of FAANG era 💻.
📈 Smart Money: Institutions started accumulating in late 2009–2010, reflected in tight consolidations and sharp rallies.
🔁 Macro Wave 2 (2012)
A brief and shallow correction within the bullish context — a classic bullish flag in terms of price action. Quickly ended with higher lows.
🧠 SMC: Short manipulation phase to shake weak hands.
📉 Price Action: Pullback respected prior structure — no trend break.
💥 Macro Wave 3 (2012–2021)
This was the largest and most explosive wave , extending over 9 years and forming 5 purple micro waves.
🟣 Micro Waves: Clean impulsive structure, confirming a classic Elliott wave fractal.
💡 Fundamentals:
Rise of cloud computing
Mobile-first economy
AI, semiconductors, and social media explosion
COVID-19 crash and rebound — the fastest recovery in history
🔹 Fibonacci: No deep retracements — sign of a healthy, powerful wave 3.
🧠 Smart Money: Deep accumulation during COVID crash → massive expansion post-March 2020 📈.
🧱 Macro Wave 4 (2021–2022)
A healthy correction that reset the structure — completed around the 2022 low. This wave maintained market structure integrity.
🔻 SMC: Liquidity sweep of previous lows + mitigation of demand zones.
📊 Price Action: Range-bound, bearish to neutral.
🌍 Macro Headwinds:
Interest rate hikes
Inflation fears
Global instability (Russia-Ukraine, energy crisis)
🧬 Macro Wave 5 (2022–2029) – Now Unfolding*
This is the final thrust of the Super Cycle Wave 3 , subdivided into 5 micro waves (current count in progress):
🔸 Micro Wave 1 ✅
Initial rally from 2022 lows, showing strong impulsive behavior.
🧠 Smart Money: Confirmed shift from reaccumulation to expansion.
🔸 Micro Wave 2 ✅
Pullback formed higher low — acted as final reaccumulation.
🔴 Micro Wave 3 – In Process (2025–2026)
This is expected to be the strongest wave within Macro Wave 5, projected to peak near 36,000 (2.618 extension of micro 1–2).
📈 Price Action: Aggressive higher highs and shallow pullbacks.
🧠 SMC: Expansion with little liquidity left below — institutions pushing price up.
💡 Fundamentals:
AI hypergrowth
US tech dominance
AI chips, quantum computing, tokenization
Renewed bullish risk appetite 🌐
🟠 Micro Wave 4 (Expected 2026–2027)
A corrective wave likely to retest the macro structure — forming a flag or triangle.
📉 Price Action: Sideways to downward chop, retracing 0.382–0.5 of wave 3.
🧠 SMC: Inducement setup before final rally.
🌍 Macro: Possible geopolitical or monetary tightening phase.
🔵 Micro Wave 5 (Expected Top in 2029)
The final leg of Macro Wave 5 and Super Cycle Wave 3. Expected to top near 85,000 , a 2.618% Fibonacci extension of Super Cycle Waves 1–2.
🎯 Final Parabolic Blow-Off
📊 Price Action: Euphoria, exponential rally, low-volume melt-up
📈 Smart Money: Final distribution phase — retail FOMO peaks
🧨 Fundamentals: Mania phase — “everything AI/metaverse/tokenized” narrative, record valuations, IPO booms.
🔮 Looking Beyond: Super Cycle Wave 4 (Post-2029)
Once the 85K target is met, a multi-year correction is expected — possibly deep and drawn out. Historically, Wave 4s retrace 0.236% to 0.382% and take years to unfold.
🧠 Expect:
Systemic debt pressure
Currency shifts
Economic reset themes
Potential Fed policy overcorrection
Liquidity crunch
🌧️ Super Cycle Wave 4 may retest previous demand zones around 30–36K.
📚 Final Thoughts
Our analysis represents an extraordinary blend of Elliott Wave fractals , institutional behavior (SMC) , and macro-fundamental alignment . We are in the late phase of a historical Super Cycle rally — but Wave 3 still has room to run 📈.
✅ Wave Count Aligned
✅ Fibonacci Extensions Respected
✅ SMC Structure Intact
✅ Macro-Fundamentals in Sync
📌 2025–2029 could be the final push before a generational correction. Smart investors must watch for distribution signs post-36K 📊.
"Trust the waves, not the noise." – FIBCOS 🌊
📘 Disclaimer: This is a structural, educational market outlook. Not financial advice. Please do your own due diligence and risk management.
#FIBCOS #ElliottWave #SmartMoneyConcept #MarketAnalysis #NASDAQ #XAUUSD #SuperCycle #MacroTrend #SmartMoney #Fibonacci #PriceAction #Commodities #Stocks #TechnicalAnalysis #LongTermOutlook

$NVDA - $215 Near Term TargetNvidia Stock is setting up what appears to be a bull flag. Watch for an imminent break out of its descending wedge flag for a measured move to $215. Remember, the flag pole equaling the measured extension move from the breakout.

480 soon, then 900?It's a buy if it hits 480. Most likely it will reach 900.
Happy trading!!
Not a financial advice.

S&P 500 Elliott Wave Analysis: Approaching the End of Wave 5I believe the S&P 500 is nearing the end of wave 5, possibly complete already or very soon, based on ES future and SPX charts. The wave 4 low from April 2025 (~5000) should be retested in a 3-wave ABC pullback, targeting late 2026 to early 2027, aligning with Fibonacci time frames. RSI divergence and ending patterns support this. Thoughts?

Stock Market Forecast | TSLA NVDA AAPL AMZN META MSFTStock Market Forecast | CME_MINI:NQ1! CME_MINI:ES1! SP:SPX NASDAQ:NDX
MAG 7 | TSLA NVDA AAPL AMZN META MSFT GOOGL

Nvidia - The next rally of +33% started!🚀Nvidia ( NASDAQ:NVDA ) just broke out:
🔎Analysis summary:
Over the past couple of months, Nvidia has been rallying an expected +100%. However, just objectively looking at the chart, this rally is not over yet. After the confirmed all time high breakout, Nvidia can rally another +33% until it will retest a substantial resistance level.
📝Levels to watch:
$250
SwingTraderPhil
SwingTrading.Simplified. | Investing.Simplified. | #LONGTERMVISION

Bullish Pullback Attack – NVIDIA Heist Plan for Escape Loot!🚨💻 NVIDIA (NVDA) Stock Heist Plan 🎭 | Swing & Day Trade Robbery 💰⚡
🌟 Hey Money Makers & Market Robbers! 🌟
Welcome back to the Thief Trading Den where we don’t trade… we steal from the market vaults! 🏦💸
🔥 Asset: NVIDIA (NVDA)
🎭 Heist Type: Swing / Day Trade
🔑 Plan: Bullish Pullback Robbery
🗝️ Entry (Breaking into the Vault)
First lockpick entry above 167.00+ 🔓
Retest & pullback = perfect robbery spot
Thief layering strategy: stack multiple buy limit orders (layered entry like robbers tunneling from multiple sides 🛠️).
Any price level? Yes, thieves adapt—grab loot wherever the window cracks open! 🏃♂️💨
🛑 Stop Loss (Escape Route 🚪)
Official Thief SL: @ 161.00 ⚠️
But dear Thief OG’s, adjust based on your risk appetite, loot bag size & startergy 🎭
Remember, no thief survives without an escape route! 🚁
🎯 Target (The Electric Fence Escape ⚡)
The High Voltage Electric Shock Fence is guarding the treasure @ 196.00 ⚡⚡
Snatch your profits before the fence fries the loot 🔥
Escape fast, spend faster, rob smarter 💸🍾
⚠️ Thief Alert 🚨
The market guards (short sellers) are patrolling heavy—don’t get caught in their traps 🕵️♂️
Use layered limit orders, scale out profits, and keep your SL tight!
A true thief never overstays at the crime scene 👀
💥 Boost this Robbery Plan 💥
Every like & comment powers the Thief Trading Family 🏆
Stay sharp, stay sneaky & let’s rob NVIDIA together! 🤑🎭

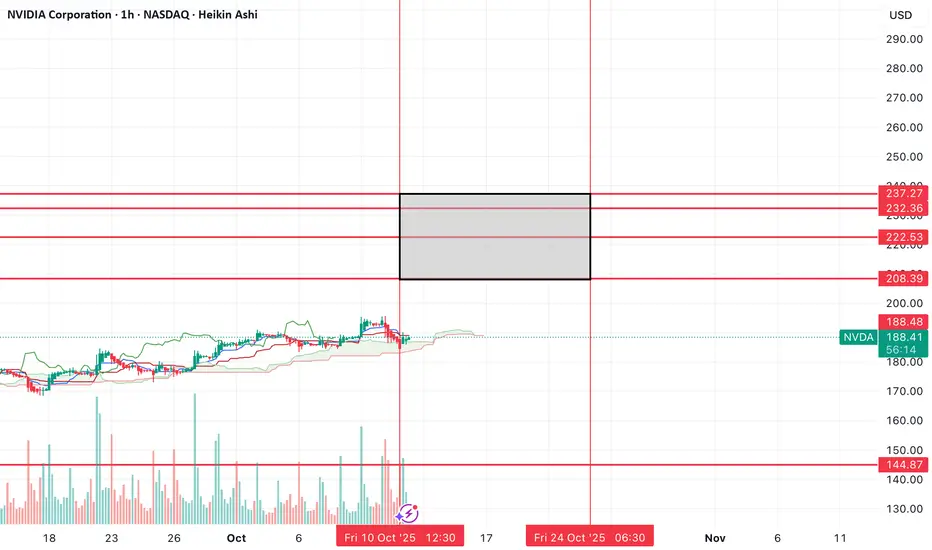
$NVDA final leg higher? Over $200?The move down on Friday looks like it marked a low to me and that we could see our final move higher from here.
It's been my idea that we see a blowoff top over the next couple of weeks, so I think these levels in the box will mark the top.
I think it's most likely that we get somewhere between the $222 level and $232 level, but I've marked off other levels just incase.
I've taken some calls, let's see how the move plays out from here.
Stock Market Forecast | TSLA NVDA AAPL AMZN META MSFTStock Market Forecast | CME_MINI:NQ1! CME_MINI:ES1! SP:SPX NASDAQ:NDX
Mag 7 | TSLA NVDA AAPL AMZN META MSFT GOOGL

NVDA Showdown:Will Bulls Charge to $204 or Bears Drag Us to $163If NVDA falls under $179, it might quickly drop to $176.70. If it keeps falling, the next stop could be $163. But if NVDA goes up and closes above $188, we could see it reach $199 or even $204.
Why do these levels matter? Because a big move could happen soon; either a big fall or a strong jump up. What would you do if NVDA hit these prices? Have you seen this happen before?
If you’re wondering what these moves could mean for you, or if you have questions, just send me a message. Sometimes one good question leads to your best trade ever. What would you ask if you could get a clear answer?
Mindbloome Exchange/ Trade What You See

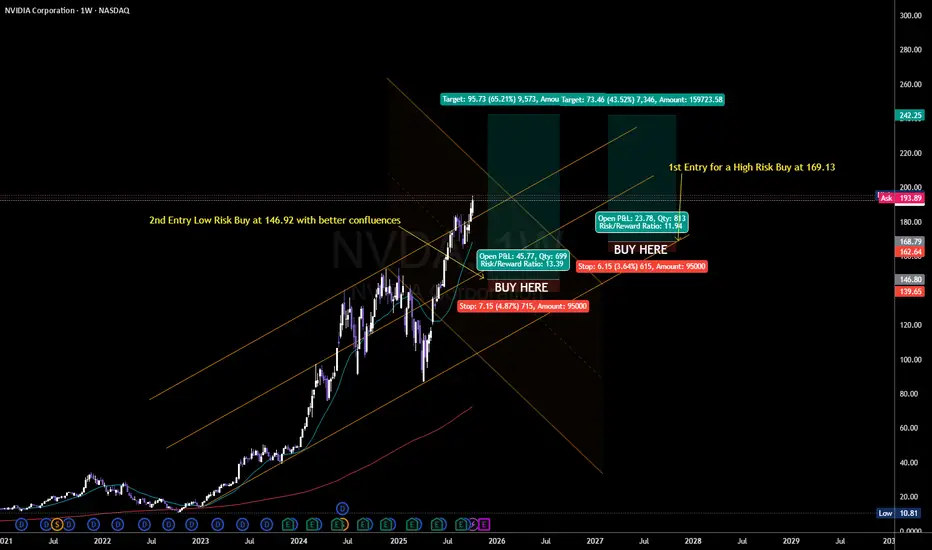
NVDA : The Engine of Robotic Intelligence More BUYSNvidia's chips and AI platforms power the nervous system of modern robotics, enabling real-time processing, deep learning, and autonomous decision-making for next-gen machines.
Nvidia - Starting a clear +20% rally!🧲Nvidia ( NASDAQ:NVDA ) rallies higher now:
🔎Analysis summary:
About one decade ago, Nvidia broke out of a major bullish triangle pattern. Following this remarkable breakout, Nvidia continued with a rally of about +35.000%. But looking at all these previous cycles, Nvidia remains bullish with another potential +20% move towards the upside.
📝Levels to watch:
$200, $250
SwingTraderPhil
SwingTrading.Simplified. | Investing.Simplified. | #LONGTERMVISION

$NVDA : The Rally’s Writing Its Own Headline! 10/9/2025NASDAQ:NVDA is making steady strides toward its wave C target of $235, following a challenging 13-month correction that found its bottom at $95 in April.
The bullish momentum could push prices even higher, eyeing a potential $321.
Sit tight and enjoy the ride! 🚀👌

NVIDIA Next stop.. $200For a long time we've been calling for a $200 Target on NVIDIA Corporation (NVDA). That was our main Target for the Bull Cycle that started in November 2022. The stock is very close to this level and the short-term pattern that can get to it is this Channel Up.
Supported by the 1H MA100 (green trend-line), NVIDIA has been posting Bullish Legs of around +10% since the September 05 Low. The confirmation signal for those Legs has been a 1H MACD Bullish Cross.
Given that we formed one yesterday, we expect the price to be on such a Bullish Leg already. The 'weakest' of those sequences has been +9.58%, which if repeated, lands marginally above the $200 psychological level.
Time to hit it?
-------------------------------------------------------------------------------
** Please LIKE 👍, FOLLOW ✅, SHARE 🙌 and COMMENT ✍ if you enjoy this idea! Also share your ideas and charts in the comments section below! This is best way to keep it relevant, support us, keep the content here free and allow the idea to reach as many people as possible. **
-------------------------------------------------------------------------------
💸💸💸💸💸💸
👇 👇 👇 👇 👇 👇

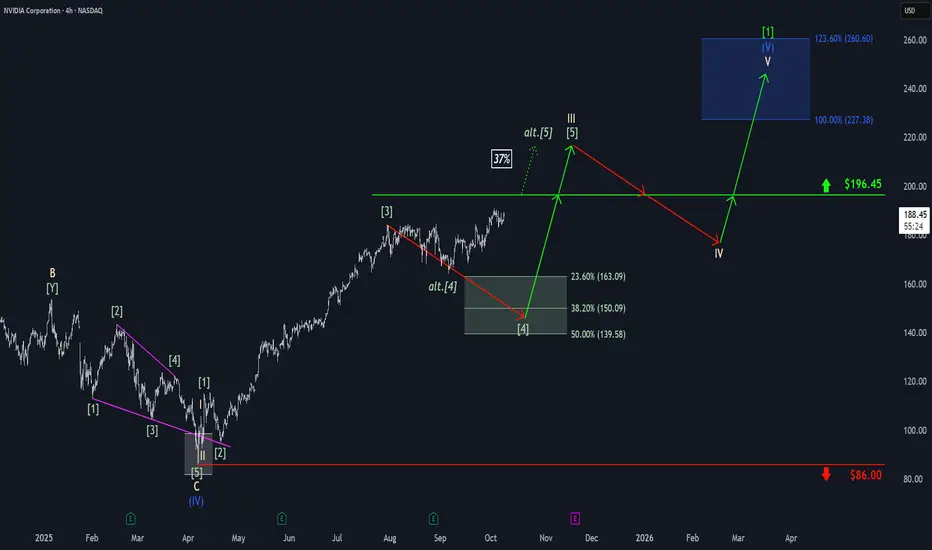
Nvidia: Bullish DistractionAmid bullish momentum, Nvidia edged closer to resistance at $196.45 before settling into sideways action late last week. As a result, there remains a 37% probability that the stock will bypass a new low and instead break directly above the $196.45 level. However, our primary expectation is for the stock to turn lower, targeting our green Target Zone between $163.09 and $139.58 to complete green wave . Only after this move do we anticipate a sustained advance above $196.45, which would mark the completion of beige wave III. Following a wave IV pullback below this threshold, we ultimately expect gains into the blue Target Zone between $227.38 and $260.60, where beige wave V should complete not only blue wave (V), but also the larger neon green wave .
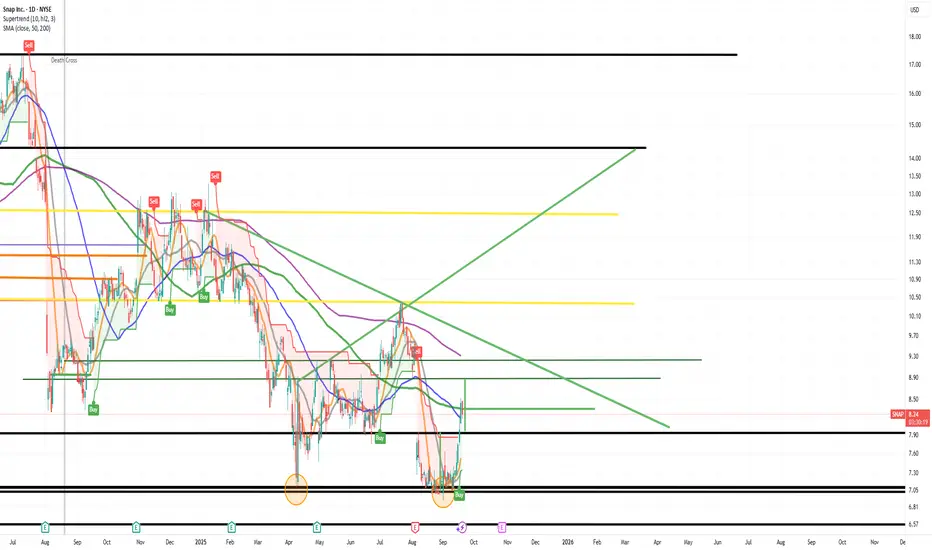
The King of $SNAP is back, with a price target of at least $13As a seasoned multimillionaire trader, I’ve navigated countless market cycles, and few trades have been as straightforward and profitable as Snapchat. Historically, NYSE:SNAP has offered clean technical setups and predictable momentum, making it one of the easiest gains in my portfolio.
Currently, I see a compelling opportunity unfolding:
Initial Target: $9.25 – This represents a gap-fill level that I consider virtually guaranteed based on historical price action and volume profile.
Breakout Potential: $11.00 – Once NYSE:SNAP clears the $9.25 threshold, I expect a rapid move toward $11, driven by momentum and short-covering.
Major Resistance: $13.00 – This is where I anticipate the next significant pause or consolidation.
1) Cup and Handle
2) Doulbe Bottom
Given the current setup, this is an ideal time to initiate a long position. The risk/reward ratio is highly favorable, and the technical indicators support a bullish continuation.
And yes, I’m sharing this publicly — not because I expect anyone to listen (let’s be honest, most won’t), but because I like receipts. When NYSE:SNAP hits these levels, I want the record to show: I called it first.
Strong buy recommendation. But hey, ignore it if you want — I’ll be too busy counting gains.
70 SOON?It might have topped for now with a double top. Looks bearish and it may hit 70 in couple of months. Short term analysis only.
Not a financial advice.

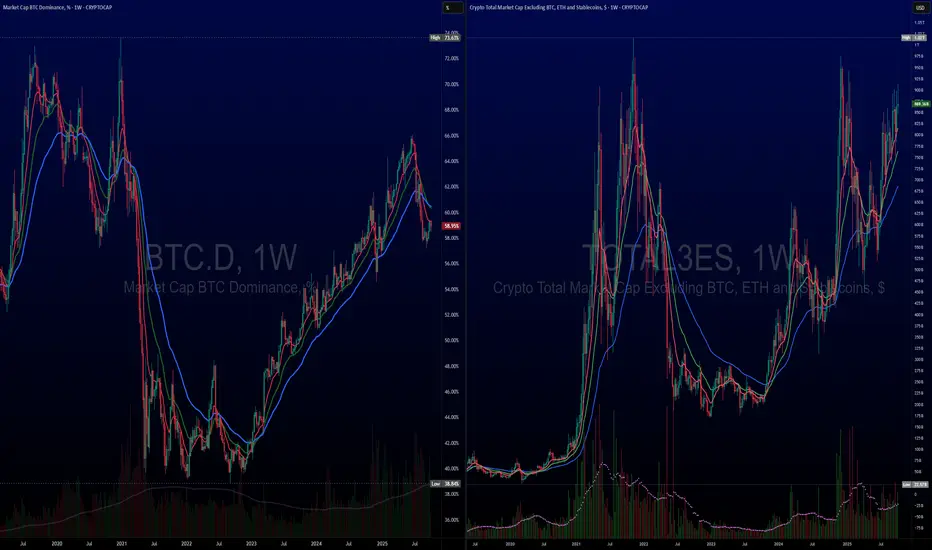
Crypto = Stocks, saying this since 2021Sorry for not posting as much
Want more? A lot more? See profile for more info.
Until we see a significant shift and change to our theses since 2021 >Crypto = Stocks. People were clamoring institutions. When big boys come to the party things change. Deal with that now. It is not the same game.
Since 2021 we've been saying that Crypto was no longer the same and that it turned into a similar asset as stocks.
Since then the top 10 have done well & most coins, especially after top 25, have suffered.
See the following charts to compare. Not in any order.
It's kind of like NASDAQ:NDX index vs CRYPTOCAP:BTC index.
Then the largest tech companies vs the largest Crypto.
NASDAQ:META NASDAQ:MSFT NASDAQ:NVDA = CRYPTOCAP:SOL CRYPTOCAP:XRP CRYPTOCAP:BNB Capish?
ANDREW «LEFT» GOES ANDREW «UP» AS PALANTIR CELEBRATES 5YRS ANNIVAndrew Left from "Citron Research" made his name writing shrewd short-seller reports on companies he deemed troublesome. In mid-August, Left called high-flying Palantir "overvalued".
Since that the stock turned down nearly 17% but resistently printed "Double Top" technical figure after. Now Left is excited about the bullish perspectives.
Palantir shares have jumped more than 1,700% since the data analytics company opened on the New York Stock Exchange 5 (five) years ago on Spetember 30, 2020.
During that time, revenue has roughly quadrupled as the company inked more deals with the U.S. government and benefitted from advancements in artificial intelligence.
Palantir’s steep valuation and reliance on government contracts have raised concerns.
The stock price has surged more than 1,700%, closing on Monday nearly at $180 for a market cap of over $430 billion. That puts it among the 20 most-valuable U.S. companies, and above tech stalwarts like Cisco and IBM.
Last year, Palantir joined the S&P 500, replacing American Airlines NASDAQ:AAL .
Quarterly revenue surpassed $1 billion for the first time last quarter, and is expected to reach $4.2 billion this year, according to analysts surveyed by LSEG, up almost sixfold from 2019. The company’s roster of customers grew from 125 in the first half of 2020 to 849 at the end of June. During that time, Palantir has added 1,500 full-time employees.
CEO Alex Karp, who founded the company in 2003 alongside notable investors like Peter Thiel and Joe Lonsdale, was exerting optimism on day one of Palantir’s life on the public market.
“We’ve reached a base where our company is very significant,” Karp, who holds a law degree from Stanford and PhD in neoclassical social theory from Goethe University in Frankfurt, Germany, told in an interview on listing day.
“Being in the public space will help us with our clients and help us grow.”
In a report in August 2025, Citron Research’s Andrew Left, a noted above ex-short-seller, called Palantir “detached from fundamentals and analysis.” When compared to OpenAI’s recent $500 billion valuation, he said Palantir should be priced at $40, or less than one-quarter of its current price, if it was assessed the same revenue multiple as the artificial intelligence startup.
“Karp and his team should be proud. But for investors, that’s where discipline kicks in,” Left wrote. “Comparison is the enemy of happiness, and when measured against true AI leaders, Palantir’s price already reflects success beyond its fundamentals.”
Karp, who doesn’t shy away from a dispute, recently told detractors to “exit” if they “don’t like the price.”
“We are going to be the most important software company in the world, and people will figure out what that’s valued over a long period of time,” Karp said on the day of the company’s NYSE debut.
For now, i.e. over the past 5 years since IPO debut, Palantir is among Top 3 S&P500 index performers, alltogether with Supermicro NASDAQ:SMCI (#1 rank) and Nvidia shares NVDA (#3 rank).
Over the past twelve months, Palantir stock has added nearly +350 %, and this is the 2nd return over all components, just after new kid on the block, Robinhood Markets NASDAQ:HOOD stock that entered S&P500 index earlier this year.
--
Best wishes,
@PandorraResearch Team

AMD Best Level to BUY/HOLD 300% gains SWING TRADE🔸Hello traders, today let's review recent price chart for AMD.
Well defined swings in progress, expecting further downside before
the tide finally turns for AMD bulls. Currently it's recommended to stay out.
🔸AMD is trailing behind NVDA massively, so eventually AMD will to the
mean reversion trade and start to catch up with NVDA, however currently
pullback/correction mode in progress.
🔸Well defined swings - 160 to 58 65% correction, then 58 to 210 280% gains,
210 to 75 represents 65% correction, 75 to 290 is a 280% pump.
🔸Recommended strategy bulls: Bulls wait for correction to complete at/near 75 usd in January 2025 and get ready to BUY/HOLD low, this is a swing trade setup, so will take longer to hit target, patience required. final TP is 290 USD, 280% upside off the expected lows. good luck traders!
🎁Please hit the like button and
🎁Leave a comment to support our team!
RISK DISCLAIMER:
Trading Futures , Forex, CFDs and Stocks involves a risk of loss.
Please consider carefully if such trading is appropriate for you.
Past performance is not indicative of future results.
Always limit your leverage and use tight stop loss.

Will AMD recover and catch up with NVDA? updated/Revised Outlook🔸Hello traders, today let's review 2days/candle price chart for AMD.
Price contained within bullish channel since 2021, however currently
pullback/correction in progress.
🔸65% correction in progress, based on previous swings expected to complete at/near 88/90 USD in Q1 2025. Until then it's recommended to stay out.
🔸Once we bottom out near 90 USD in Q1 2025, expecting bullish swing 265% gains off the lows, so projected high is 310/320 USD.
🔸Recommended strategy bulls: Bulls wait for correction to complete at/near 85 usd in Q1 2025 and get ready to BUY/HOLD. Bullish impulse / reversal off the lows price target based on measured move projection is 310/320 USD. patience required, do not expect miracle/overnight gains in this market. good luck!
🎁Please hit the like button and
🎁Leave a comment to support our team!
RISK DISCLAIMER:
Trading Futures , Forex, CFDs and Stocks involves a risk of loss.
Please consider carefully if such trading is appropriate for you.
Past performance is not indicative of future results.
Always limit your leverage and use tight stop loss.

Direxion Semiconductor 3x Bull | SOXL | Long at $30.00So many semiconductor companies... which one to choose? Enter AMEX:SOXL - not for the faint of heart. Losses and gains triple compared to most semiconductor ETFs, so stay away if high-risk plays aren't your thing. The top three holdings are NASDAQ:AMD , NASDAQ:AVGO , and NASDAQ:NVDA - two of which are at all-time highs...
I wouldn't be shocked if AMEX:SOXL enters the low $20's to test the base of my historical simple moving average area, but I don't think we are done hearing about AI and the semi demand. There are large gaps to fill above and below the current price and we are at the 50/50 stage (i.e. historical simple moving average zone) for a price move up or down.
My bet is up, especially with the new presidential administration. If politicians start dumping semis, I'm out. Thus, at $30.00 AMEX:SOXL is in a personal buy zone.
Target #1 = $35
Target #2 = $40
Target #3 = $50
Target #4 = $60
