Analysis of the Nvidia (NVDA) Share ChartAnalysis of the Nvidia (NVDA) Share Chart
Last week, we published a post titled “Ahead of Nvidia’s (NVDA) Earnings: How the Price Could Move”, in which we:
→ Drew an ascending channel (shown in blue);
→ Suggested that market participants’ overly high expectations would likely not be met when earnings were released, leading to a decline in NVDA’s price towards the lower boundary of the ascending channel, where support lies at $165.
In reality, the earnings report turned out to be very strong:
→ Gross revenue: actual = $57bn, forecast = ~$54.9bn.
→ Earnings per share (EPS): actual = $1.30, forecast = $1.26 (previous quarter = $1.05).
The surge in price with a bullish gap towards point A reflected the initial reaction to the strong figures, but the share price then began to fall (reaching a two-month low), thereby confirming our expectations.
Technical Analysis of the Nvidia (NVDA) Chart
An analysis of NVDA’s price action suggests that the current situation can be viewed as a correction (shown with red lines), forming within an expanded ascending channel.
If NVDA’s share price declines towards the $165 level, where the lower boundary of the channel lies, this could encourage the bulls to attempt to resume the 2025 uptrend and mount a new push towards the psychological $200 mark.
This article represents the opinion of the Companies operating under the FXOpen brand only. It is not to be construed as an offer, solicitation, or recommendation with respect to products and services provided by the Companies operating under the FXOpen brand, nor is it to be considered financial advice.
Nvidia

Nvidia loses steam despite exceptional 3Q performance
Nvidia (NVDA) posted a record-breaking 3Q performance, with revenue surging 62% YoY to 57 bln USD. Its 4Q guidance points to another 65% increase, reinforcing optimism that growth momentum will continue to accelerate. CFO Kress noted that the guidance does not include any contribution from China sales, while CEO Huang pushed back against recent AI-bubble concerns raised by Michael Burry.
Nevertheless, AI valuation risks remain elevated. Beyond strong earnings, the scale of AI infrastructure spending and the surge in bond issuance required to fund it continue to dampen investor sentiment.
Goldman Sachs (GS) has warned about the fragility in the private credit market. The firm highlighted that Blue Owl Capital, with more than 295 bln USD in AUM, over half of which is credit-exposed, has seen its share price fall nearly 30% since Sep. Major credit-heavy players such as KKR and Blackstone are also showing signs of pressure, underscoring how AI-driven anxiety is spilling into private credit.
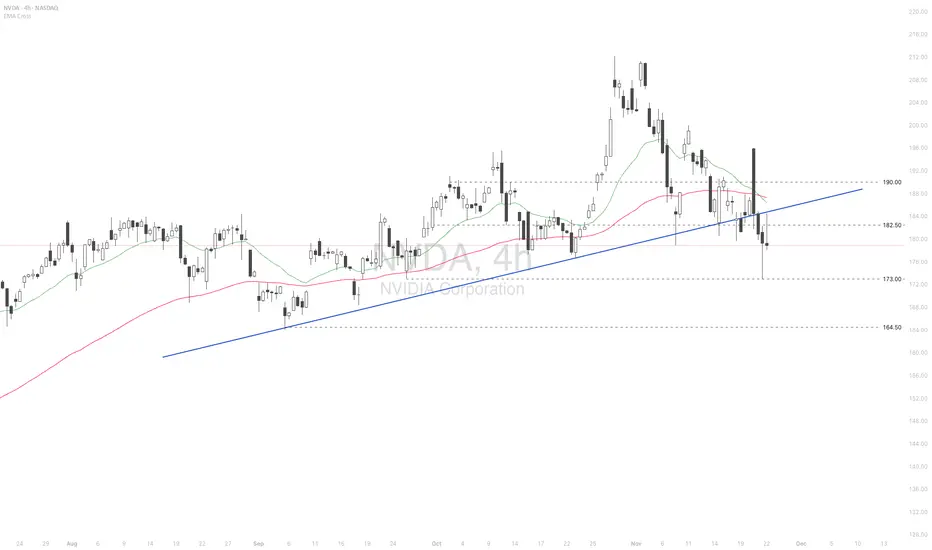
NVDA briefly breached above the psychological level at 195.00 but surrendered all gains, falling back below 182.00. The price remains under the death-crossed EMAs, indicating a potential expansion of the bearish bias.
If NVDA breaks below the support at 173.00, the price could decline further toward the following support at 164.50.
Conversely, if NVDA breaches above the resistance at 182.50 and the ascending trendline, the price may advance toward the subsequent resistance at 190.00.
I guess it is a bubble...When the CEO is selling, the CFO is selling, SoftBank is unloading, Peter Thiel is selling, and Michael Burry is short, you have to stop and ask the only question that matters:
Is it actually smart to buy the dip here?
I didn’t even bother checking the latest SMH holdings, but if anyone wants to post the updated weightings, it would help frame how much passive-flow risk still sits above price.
The real question is whether there’s room left on the downside and whether this is anywhere near a bottom. If you want an example of how low “too low” can go, just study META during its unwinding. Fundamentals didn’t matter. Valuation didn’t matter. Price just kept repricing until forced sellers were done.
The one positive about this environment is volatility. When liquidity thins out and ranges widen, both sides can pull money out — but only if you treat it like a scalp environment, not a swing-long hero trade.
Because think about it rationally:
Do you want to be the one buying while billionaires, insiders, and institutions are selling into strength?
We’re moving into year-end — historically the period where funds clean books, tax-loss harvest, and unwind risk. Pair that with the probability of crypto-liquidation bleed-through, and you can easily get a chain reaction. Markets don’t fall in straight lines; they fall like Jenga blocks, dominoes, or a card tower collapsing from the bottom up.
This isn’t doom posting — it’s just market structure.
Flow dictates direction, and right now the flow is one-directional.

NVDA Cooked!?If you find this information inspiring/helpful, please consider a boost and follow! Any questions or comments, please leave a comment!
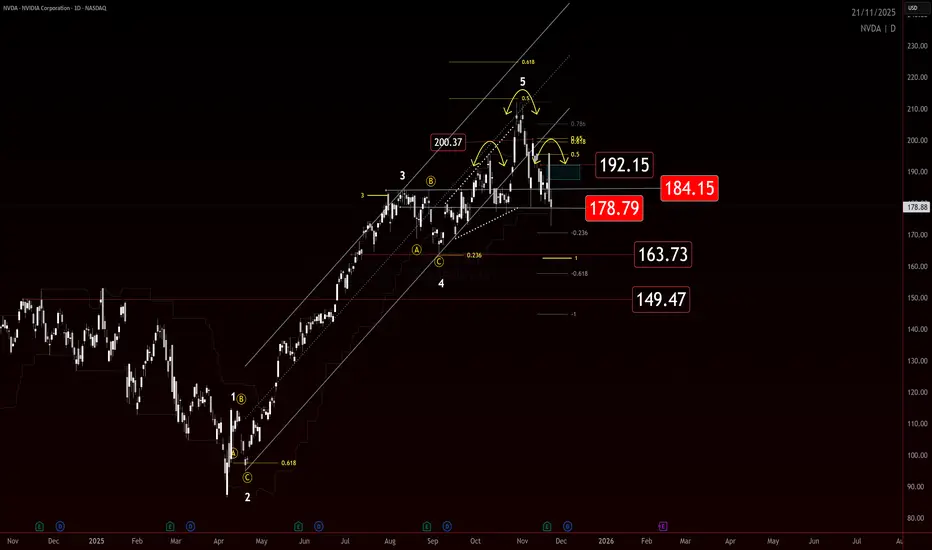
NVDA Price Action Update: Key Levels To Watch
NVDA is cooked if it cannot reclaim the key levels overhead. Price is currently testing 178 and this area is critical for determining whether buyers still have any momentum left.
To flip this structure back upward, NVDA needs an impulse through 178 and then 184. Anything that retraces in a choppy or corrective manner within the impulsive range from 195 is suspect and suggests continuation lower.
If buyers fail to generate an impulsive move from here, the downside levels below come back into play. Seller control increases with every failed retest and every weak bounce.
This is a simple structure play. Impulsive strength is required to shift control. Corrective behavior keeps the door open for further decline.
Trade safe and trade clarity.
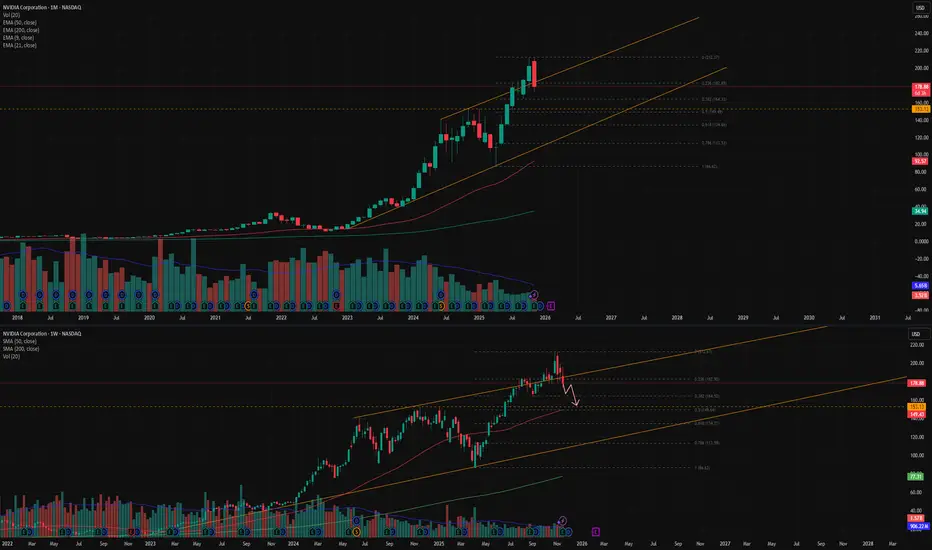
NVDA ALERT: Critical Drop AheadNvidia remains in a broader uptrend, but the chart shows a clear trendline breakout followed by the beginning of a pullback.
Using Fibonacci, a correction typically starts after a red candle forms following a sequence of green candles. In most cases, the pullback continues toward the 0.5 retracement level. In this setup, the 0.5 level aligns with a major key support, increasing its importance.
On the weekly timeframe, the 50 EMA is also converging at the same zone, which often acts like a magnet for price. This creates multiple confirmations pointing toward a potential move downward.
The weekly chart has printed a bearish engulfing , followed by three consecutive red candles, adding another strong confirmation for a continued correction.
Both MACD and RSI are sloping downward, supporting the bearish momentum.
If price reaches the expected zone, monitoring the reaction will be critical. A deeper decline into the global trendline is possible only if the key level is broken, though this scenario appears less likely.
Overall, NVDA shows several aligned signals indicating a move toward the correction zone before any potential recovery.
S&P500 crashes! Due relief rally or further pain?Nvidia delivered impressive earnings, but the stock reversed and closed nearly 3% lower, triggering heavy selling across tech and risk assets as odds for a December rate cut have collapsed to just 34%, with policy uncertainty amplified by the cancelled October NFP report. Despite a strong market and rising unemployment in September's NFP report, traders remained defensive and fuelled the declines.
Key drivers:
Nvidia beat earnings, but post-report selling intensified sector losses.
The Fed’s odds for a December rate cut have dropped to 34%, amplifying caution.
The abrupt cancellation of the October NFP means the market lacks fresh labour data, fuelling defensive positioning.
S&P 500, Nasdaq, and Bitcoin broke major supports, confirming risk-off conditions.
Right now, the S&P 500 has broken below channel support near 6,600 and failed to climb back in. If prices stay below this threshold, expect another sharp move lower targeting 6,500 and possibly 6,350. There’s potential for upside, given momentum divergence on the RSI 4-hour chart. If we see a short-term bounce and a return to the channel, a move toward 6,682 is possible, which sets up a tactical short opportunity.
Trade idea:
Entry: Midpoint of 23.6/38.2 Fibonacci (6,655–6,682 area)
Stop-loss: Above 61.8% Fib (6,775)
Take Profits: TP1 6,500 (recent low/support), TP2 6,440 (major support), TP3 trail stop to 6,170 (long-term support)
Risk-off drivers are in control. Earnings reversals, Fed uncertainty, and cancelled NFP data are fuelling this price action. Technically, it comes down to whether we see a return inside the channel for a relief bounce or a sharp continuation downward.
Watch your levels, remain nimble, and let fundamentals and technicals, not emotions, guide your trade.
Let me know your setups in the comments, and follow for more high-action technical and macro trade ideas.
This content is not directed to residents of the EU or UK. Any opinions, news, research, analyses, prices or other information contained on this website is provided as general market commentary and does not constitute investment advice. ThinkMarkets will not accept liability for any loss or damage including, without limitation, to any loss of profit which may arise directly or indirectly from use of or reliance on such information.

Nvidia Erases Post-Earnings RallyShortly after publishing its earnings, shares of tech giant Nvidia jumped more than 5% at the start of the session; however, a new bearish sentiment quickly took hold of the market, and the stock fell over 7% in the final trading hours, wiping out the gains seen after the results. The company reported strong figures, with revenue of $57 billion, above the expected $54 billion, and projected fourth-quarter sales near $65 billion.
Despite the positive numbers, selling pressure began weighing on the price, mainly because the optimism was likely already priced in, prompting short-term profit-taking. In addition, growing concerns about emerging competition have fueled ongoing weakness in the stock. If market confidence fails to recover soon, selling pressure could intensify in the coming sessions.
Uptrend Losing Momentum
Since November 11, indecisive price action has led to a break of the long-standing upward trendline that had been guiding the stock’s movement. This uncertainty has created a short-term sideways range, with a ceiling at $196 and a floor at $179 per share. As long as these levels hold, a neutral and sideways phase is likely to dominate, indicating lack of clear direction in the short term.
RSI
The RSI remains slightly below the neutral 50 level, suggesting that selling momentum slightly outweighs buying pressure, though not strongly enough to establish a consistent short-term trend. As long as the RSI stays near 50, neutrality in price movement is likely to persist.
TRIX
The TRIX indicator shows a downward slope, moving closer to the zero line, indicating a balance in the strength of the exponential moving averages. This reinforces the indecision in the stock’s short-term behavior.
Key Levels to Watch:
$196 – Main Resistance: Corresponds to the most recent upward retracement zone. A break above this level could revive the bullish bias and reactivate the long-term uptrend.
$188 – Nearby Barrier: Area aligned with the 50-period simple moving average. Price moves near this level could support the formation of a more defined sideways range.
$179 – Key Support: Represents the lowest area from the past two months and serves as the most critical bearish barrier. A drop below this level could trigger a stronger selling bias and mark the start of a short-term downtrend.
Written by Julian Pineda, CFA, CMT – Market Analyst

Nasdaq 100 drops to a new low on the weekWhat a sell-off! The Nasdaq 100 (-2%) has now dropped almost 1,000 points from earlier high, to relinquish its entire gains related to Nvidia (-1.6%) and some to hit a new low on the week. How much more selling in there to come? Judging by price action in the crypto space, I would say a fair bit more.
By Fawad Razaqzada, market analyst with FOREX.com

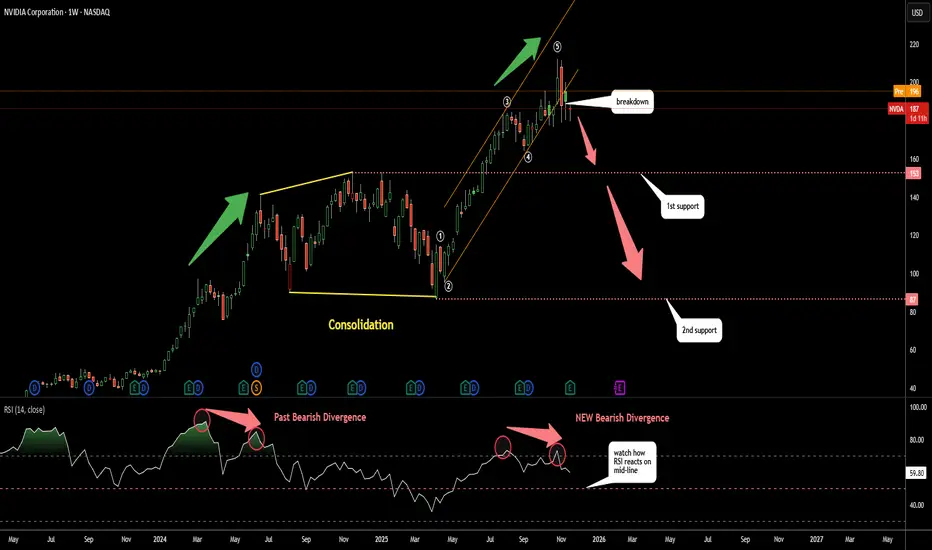
Nvdia (NVDA): How Deep It Can Dip?The RSI is not buying the hype as it shows clear Bearish Divergence
This aligns with the current impulse wave count suggesting the 5 wave structure may now be complete and the orange uptrend has been broken
Last year a similar Bearish Divergence triggered a large consolidation phase marked in yellow
It may repeat again
First support is at 153 the top of the previous consolidation
Second support is at 87 the bottom of that consolidation
Nvidia Earnings Finally Ease Market Jitters. Are AI Bulls Back?It’s confirmed. This is Nvidia’s stock market and we all live in it.
Nvidia NASDAQ:NVDA reported yet another record-breaking quarter, instantly soothing market nerves after a week filled with talks of “AI bubble,” “valuation fever,” and “maybe Michael Burry is right again.” It was the cherry of the earnings season .
The chipmaking giant announced $57 billion in sales during the most recent quarter.
The figure is up 62% year-over-year and way above estimates. In other words, Nvidia didn’t just calm the market. It kicked the door open and shouted: “Get in losers, we’re going shopping.”
CEO Jensen Huang was even more enthusiastic, declaring that “AI is going everywhere, doing everything, all at once.” In classic Huang fashion, you could almost smell the leather jacket.
💽 Data Center Demand: Still Insatiable
Let’s cut to the headline number: $51.2 billion in data-center revenue. Analysts expected $49 billion. Nvidia delivered more.
The company’s new Blackwell GPUs, described by Huang as “off the charts” when it comes to demand, continue to fly off the production line the moment they’re made.
Quarterly net income hit a whopping $31.9 billion, up 65% from the year prior. At a time when most companies celebrate single-digit percentage growth, Nvidia is casually stacking double and triple digits.
📈 Markets Exhale, Futures Soar
The relief was immediate and widespread. You could say that Nvidia’s earnings are not just earnings anymore, but a macro signal.
Here’s what the picture looked like after the release:
CoreWeave NASDAQ:CRWV jumped 10%
Futures tied to the Nasdaq NASDAQ:IXIC climbed 2%
Every Magnificent Seven stock flashing green
Investors had been waiting for confirmation that the AI boom still had room. And Nvidia delivered enough reassurance to light up the entire tech complex.
“Okay. Maybe we don’t need to rotate into utilities just yet,” every tech bro, probably.
😬 The Stakes Were High. Really High.
The reaction, though, must be taken within the current context. Over the past few weeks, tech stocks were hit by deep selloffs as markets fretted over the same question: “Is AI too expensive?”
Between skyrocketing capital expenditures, absurdly ambitious data-center budgets, and the kind of spending plans that would make even sovereign wealth funds blush, investors wondered whether Big Tech was building an AI future or an AI money pit.
Even Michael Burry stepped in, revealing positions betting against Nvidia NASDAQ:NVDA and Palantir NASDAQ:PLTR . That move alone sent pockets of the market into a philosophical crisis.
After all, that’s the guy from “The Big Short” and he’s hedged against your favorite trade.
🤖 So… Are the Bulls Back?
Maybe. For now at least. But with conditions.
Nvidia’s stock more than doubled between April and late October, only to slide in recent weeks as bubble fears thickened. Year to date, the stock is still up about 30%.
Nvidia’s numbers prove that AI spending is still accelerating. But the broader question remains: Can companies actually turn those massive AI investments into profit?
Nvidia’s blowout quarter just reset the narrative:
AI demand is still real
Spending is justified
The cycle is still “virtuous,” in Huang’s words
After this earnings print, the bull case has something it desperately needed: momentum.
And momentum is a powerful thing, especially in a market that had started to doubt its favorite story.
Off to you : Do you still see room for growth in the AI space? Or is that rebound a short-term reflex? Share your views in the comments!

Nvidia (NASDAQ: $NVDA) Smashes Q3 Expectations on AI Demand Nvidia (NASDAQ: NASDAQ:NVDA , XETRA:NVD) posted another blockbuster quarter as its fiscal Q3 results exceeded Wall Street expectations, powered almost entirely by explosive demand for its AI-focused data center chips. Revenue reached $57.01 billion, beating the $55.19 billion consensus and climbing 62% year-over-year. Adjusted EPS came in at $1.30, up 60% from last year and 24% sequentially.
The data center division once again carried the quarter with $51.2 billion in revenue, outperforming analyst estimates of $49.34 billion and rising 66% from a year ago. Nvidia highlighted record demand for its Blackwell platform, which delivers industry-leading performance and 10x throughput per megawatt compared to previous generations. CEO Jensen Huang said AI compute demand continues to accelerate across both training and inference, calling it a “virtuous cycle of AI.”
Other business segments posted mixed results. Gaming revenue grew 30% year-over-year to $4.3 billion but dipped slightly from the previous quarter. Professional visualization revenue increased 56% to $760 million, and automotive revenue rose 32% to $590 million, reflecting steady diversification outside core AI markets.
Nvidia reported adjusted operating income of $37.75 billion and adjusted net income of $31.77 billion, both well above expectations. Free cash flow hit $22.09 billion, and the company returned $37 billion to shareholders through dividends and buybacks in the first nine months of fiscal 2026.
For Q4, Nvidia guided revenue of $65 billion, well above the $61.98 billion consensus, and projected gross margins around 75%. The company expects global AI adoption to accelerate further as more startups, enterprises, and countries ramp up model development.
Shares rose 3.7% in after-hours trading following the earnings release.

Nvidia: Downside Pressure Nvidia has recently faced notable downward pressure, but so far has managed to hold above the support level at $176.21. As a result, we continue to anticipate an imminent rally as part of the beige wave V, which should lift the stock into the now-red Target Zone between $227.38 and $260.60. However, if the stock immediately drops below the $176.21 mark, we would expect a new low for the beige wave alt.IV, with the lower $145.50 level still likely to hold.

AI Valuation TechnicallyThese are the three largest market-cap listed companies on the Nasdaq.
If we are concerned about an AI bubble, I’m going to show you how I perform a quick glance at some top companies and their index to determine the likelihood of an upcoming short-, mid-, or long-term correction.
In 2017, Microsoft’s P/E reached its highest at 45 — and it continued to rise after that.
In 2023, Nvidia’s P/E reached its highest at 147 — and it continued to rise after that.
In 2024, Apple’s P/E reached its highest at 40 — and it continued to rise after that.
Video version:
Micro E-mini Nasdaq-100 Index
Ticker: MNQ
Minimum fluctuation:
0.25 index points = $0.50
Disclaimer:
• What presented here is not a recommendation, please consult your licensed broker.
• Our mission is to create lateral thinking skills for every investor and trader, knowing when to take a calculated risk with market uncertainty and a bolder risk when opportunity arises.
CME Real-time Market Data help identify trading set-ups in real-time and express my market views. If you have futures in your trading portfolio, you can check out on CME Group data plans available that suit your trading needs tradingview.com/cme/

NVDA: 1 week before earnings effect. Supply-demand imbalance.Parretto principle (20-80): small important things can have great influence in grand scheme of things. Some events have greater weight, than say 80-90% of daily events.
Stocks move based on Supply-demand dynamics (disbalance etc), patterns or trends are just a feedback.
The problem with using charts as a feedback for strength (or feedback for S-D strength) is that: (1) on a expensive market, with extended prices (with high supply too), (2) during important NVDA earnings, it's almost predictable how markets would sink, or at least be volatile.
Demand stalls. Supply gets worried. Price down.
//People are risk averse. Hence.. predictable.

Nvidia (NVDA) Price Action Statistics Around EarningsWith Nvidia set to release earnings after the US close on Wednesday, I take a look at recent price action around past reports, the Nvidia chart and the Nasdaq.
Matt Simpson, Market Analyst at City Index.

BTC corrective map: cluster buys vs 95.7k supply__________________________________________________________________________________
Market Overview
__________________________________________________________________________________
BTC remains in a corrective phase just above 93k after a sequence of lower highs, sitting on stacked demand while overhead supply caps bounces. Momentum is cautious and event-driven; treat key zones like checkpoints in a tough dungeon.
Momentum: Bearish-to-neutral drift with sellers fading bounces under 95.7k; 1D holds uptrend but 12H remains down.
Key levels:
- Resistances (3D/1D/4H): 95,700 (3D), 98,300 (1D), 100,400 (4H pivot zone).
- Supports (1D/12H/2–6H/3D): 93,900 (12H–1D floors), 92,900–93,400 (Cluster A, 2H–6H), 90,950 (3D pivot low).
Volumes: Moderate overall; notable very high spikes on 15m selloffs.
Multi-timeframe signals: 1D Up vs 12H/6H/4H/2H Down; average trend Down. Longs are tactical until 12H flips Up and price reclaims 93,900.
Harvest zones: 93,400 (Cluster A) / 93,915–93,924 (Cluster B) — ideal dip-buy zones for inverse pyramiding when ≥2H reversal confirms.
Risk On / Risk Off Indicator context: Neutral sell — risk-off tilt that tempers long follow-through, aligning with the corrective momentum.
__________________________________________________________________________________
Trading Playbook
__________________________________________________________________________________
With a corrective regime and mixed MTF, stay tactical: favor reactive buying at defined demand with confirmation and fading into first HTF resistance.
Global bias: Neutral sell while below 93,900–95,700; invalidation of bearish bias on strong reclaim and hold above 98,300.
Opportunities:
- Tactical buy: 92,900–93,400 reaction (≥2H reversal) aiming 93,900 → 95,700.
- Breakout buy: Acceptance above 93,900 opens 95,700; continuation through 98,300 targets 100,400.
- Tactical sell: Fade 95,700 or 98,300 rejections back toward 93,900/93,200.
Risk zones / invalidations:
- A sustained close below 92,400 hands control to sellers; a break below 90,950 invalidates the long thesis and exposes lower supports.
Macro catalysts (Twitter, Perplexity, news):
- FOMC Minutes, US jobs, and NVDA earnings could drive acceptance/rejection around 93k clusters.
- ETF outflows act as a headwind to durable breakouts.
- ECB balanced tone, Japan tax/policy shifts constructive medium term but not immediate.
Harvest Plan (Inverse Pyramid):
- Palier 1 (12.5%): 93,400 (Cluster A) + reversal ≥2H → entry
- Palier 2 (+12.5%): 89,700–87,800 (-4/-6% below Palier 1)
- TP: 50% at +12–18% from PMP → recycle cash
- Runner: hold if break & hold first R HTF (95,700)
- Invalidation: < HTF Pivot Low (90,900) or 96h no momentum
- Hedge (1x): Short first R HTF (95,700) on rejection + bearish trend → neutralize below R
__________________________________________________________________________________
Multi-Timeframe Insights
__________________________________________________________________________________
Across timeframes, HTF support is dense near price, but LTFs lean down and supply is heavy overhead.
1D: Still Up structurally; sitting on higher-timeframe demand with 93,900 as the nearby reclaim that improves odds toward 95,700/98,300.
12H/6H/4H/2H: Downtrends intact; bounces sold below 95,700; key support cluster at 92,900–93,400 for potential reversals.
1H/30m/15m: Weak intraday structure with sell spikes; liquidity magnets at 92,900 and 91,100–91,300; need strong wick rejections for tactical longs.
Major confluence: ISPD Cluster A (92,900–93,400) over AGG ≈ price with 3D pivot low at 90,950 below; together they frame asymmetric long attempts if ≥2H confirms.
__________________________________________________________________________________
Macro & On-Chain Drivers
__________________________________________________________________________________
Macro is mixed-to-risk-off: ETF outflows, policy/event risk, and stronger USD tone cap upside until reclaimed levels prove persistence.
Macro events: FOMC Minutes, US labor data, and Flash PMIs set the near-term volatility path; NVDA earnings can sway risk appetite; ECB is balanced but flags correction risk; Japan’s tax/policy headlines constructive medium term.
Bitcoin analysis: Sub-100k/102k regime with 97,500–100,000 as key reclaim to improve structure; below 92,000 opens deeper supports cited by multiple desks.
On-chain data: Not provided; flows narrative leans risk-off via ETFs, dampening sustained rallies.
Expected impact: Event-driven two-way trade; until 97,500–100,000 is reclaimed, respect downside tails and use confirmed reactions at clusters.
__________________________________________________________________________________
Key Takeaways
__________________________________________________________________________________
BTC trades in a corrective environment with dense support beneath and strong supply above.
- Trend is neutral-to-bearish short term while 12H remains Down; 1D resilience allows tactical bounces if 93,900 is reclaimed.
- Best setup: Confirmed ≥2H reversal in 92,900–93,400, scale out at 93,900 → 95,700; fade 95,700/98,300 if rejection.
- Key macro factor: ETF outflows plus FOMC/Jobs/NVDA volatility may decide the next leg.
Stay patient, define risk at 90,900, and harvest volatility only on confirmed signals.

Ahead of Nvidia’s (NVDA) Earnings: How the Price Could MoveAhead of Nvidia’s (NVDA) Earnings: How the Price Could Move
On Wednesday, after the close of the main US trading session, Nvidia will release its quarterly results — a report seen not merely as another batch of corporate data but as a crucial test for the entire AI-driven bull run.
NVDA shares are up more than 40% since the start of the year, and the company must now prove that this surge is justified and that the AI revolution is still accelerating. According to media reports, Wall Street analysts remain optimistic:
→ Revenue: forecast around $54.9bn, implying roughly 56% year-on-year growth.
→ Earnings per share (EPS): about $1.25 (previous quarter: $1.05).
What should investors focus on?
Of particular importance will be:
→ data on Data Centre revenue, a key indicator of whether the AI boom remains intact;
→ forward guidance, as the market is looking for reassurance that Big Tech will continue to spend heavily on AI.
Technical Analysis of the Nvidia (NVDA) Chart
Recent price action in NVDA points to a sequence that can be interpreted as bearish:
→ 28 October: a strong rally above the psychological $200 level;
→ a failure to hold above that barrier;
→ a pullback on rising volumes (Nasdaq data) with expanding candles in early November.
In the broader market context, it is notable that early November has seen NVDA underperforming major equity indices, signalling firm resistance from sellers around $200.
From a bullish perspective, the decline from the all-time high resembles a correction pattern (shown in red) within a larger uptrend.
However, there is a risk that the market’s high expectations will not be met when the earnings report is published. If that happens, NVDA could extend its decline towards the lower boundary of the rising channel, where support lies near $165.
This article represents the opinion of the Companies operating under the FXOpen brand only. It is not to be construed as an offer, solicitation, or recommendation with respect to products and services provided by the Companies operating under the FXOpen brand, nor is it to be considered financial advice.

NVDANVIDIA is still in an uptrend. Last week, the price hit a new high of $210, but the price was unable to break through this level, so it adjusted down. It is expected that the price will likely test the important support zone at $167-155. If the price cannot break through $155, the price still has a chance to rise.
However, if the price continues to rise in the near future, a correction may also occur.
Long-term trading plan: Wait for the correction to complete before buying.
** This is not financial advice.
🔥Trading futures, forex, CFDs and stocks carries a risk of loss.
Please consider carefully whether such trading is suitable for you.
>>GooD Luck 😊
❤️ Like and subscribe to never miss a new idea!

Continuation of the "AI Bubble" A chart for NVDA that illustrates the parabolic curve on this very large timeframe
To expect a curve like this to break is unlikely
AI will have huge implications
The potential of AGI aswell is huge for humanity in general. I don't see a bubble at all.
Weekly timeframe

Do you want to be a Millionaire ?Hi Guys,
This bull run has been very unusual with Bitcoin reaching record highs while the altcoins are watching from the sidelines, considering Gold,Stocks, and pretty much every other assets are
At ATH and the current AI bubble (ticking time bomb) I think all markets are due to crash very soon!
So I've been comparing current BTC chart with all types of other assets and I came to the conclusion that Nvidia 2000-2010 chart looks very similar to what we have in Bitcoin right now!
Is Bitcoin following Nvidia's (Dot Com) bubble crash ? Both charts looks extreamly similar
And Bitcoin has already broke below the weekly 50MA and the current chart pattern looks like a huge Head & shoulders are forming on the monthly period.
Even Michel Burry is shorting the AI bubble right now and the crypto community detected a suspiciouse activity on Microstrategy's Bitcoin wallets!
So I think this is it boys ..its the opportunity of the century to achieve financial freedom and
I refuse to live in denial and "HODL" like what most of us did in the previouse bear markets.
Feel free to leave a comment and let me know what you think about this idea !

Nvidia - Squeezing every single bear!🧯NVidia ( NASDAQ:NVDA ) is finally breaking out:
🔎Analysis summary:
Over the course of the past couple of months, Nvidia has been rallying +125%. Considering the market cap of Nvidia, this is already an insane move but clearly not the end. We can still see another +25% from here, before Nvidia will then retest the next resistance.
📝Levels to watch:
$250
SwingTraderPhil
SwingTrading.Simplified. | Investing.Simplified. | #LONGTERMVISION

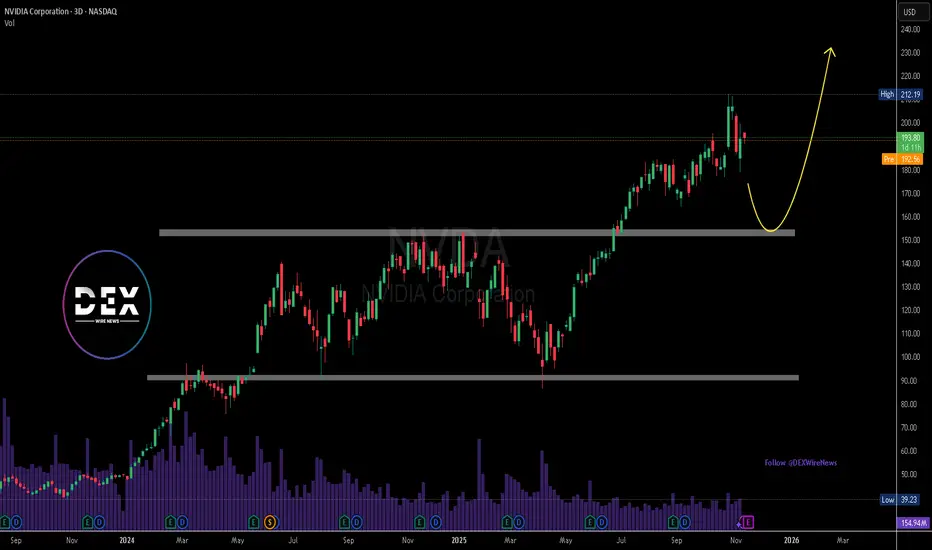
Nvidia Denies $1B Mexico Plan, Eyes Key SupportNvidia Corporation (NASDAQ: NASDAQ:NVDA ) came under brief scrutiny on Wednesday after reports suggested a $1 billion investment in a new data center project in Nuevo León, Mexico. The tech giant has since denied any financial involvement, clarifying that its role in Latin America remains limited to collaborative initiatives, research, and talent development, not direct infrastructure spending.
The confusion began when the state’s governor, Samuel García, publicly announced the investment alongside individuals presented as Nvidia representatives. However, later corrections confirmed that the green hydrogen data center would actually be built by CIPRE Holding, utilizing Nvidia’s technology rather than capital.
Despite the miscommunication, the news had little fundamental impact on Nvidia’s long-term growth narrative. The company remains the dominant force in AI semiconductors, with global demand for GPUs powering everything from data centers to generative AI models. However, short-term volatility persists amid global tech supply pressures, tighter U.S.–China chip export controls, and broader market repricing ahead of potential U.S. interest rate cuts in December.
From a technical perspective, NVDA recently hit resistance near the $212 high before retracing. The chart suggests potential for a healthy correction toward the $155 support range, which coincides with a strong accumulation zone from mid-2025. A rebound from this level could fuel a continuation toward $230–$240, resuming Nvidia’s dominant uptrend.
Investors remain focused on upcoming quarterly earnings and the broader market’s reaction to monetary easing expectations. A confirmed rate cut could renew institutional appetite for high-growth tech names, keeping Nvidia positioned as one of the most favored equities in the AI sector.
Monitoring AI Valuation - Precision on Upcoming CorrectionThese are the three largest market-cap listed companies on the Nasdaq.
If we are concerned about an AI bubble, I’m going to show you how I perform a quick glance at some top companies and their index to determine the likelihood of an upcoming short-, mid-, or long-term correction.
In 2017, Microsoft’s P/E reached its highest at 45 — and it continued to rise after that.
In 2023, Nvidia’s P/E reached its highest at 147 — and it continued to rise after that.
In 2024, Apple’s P/E reached its highest at 40 — and it continued to rise after that.
Micro E-mini Nasdaq-100 Index
Ticker: MNQ
Minimum fluctuation:
0.25 index points = $0.50
Disclaimer:
• What presented here is not a recommendation, please consult your licensed broker.
• Our mission is to create lateral thinking skills for every investor and trader, knowing when to take a calculated risk with market uncertainty and a bolder risk when opportunity arises.
CME Real-time Market Data help identify trading set-ups in real-time and express my market views. If you have futures in your trading portfolio, you can check out on CME Group data plans available that suit your trading needs www.tradingview.com
