NVIDIA (NVDA): Bullish Structure vs. Secondary Support ZoneDescription:
NVIDIA (NVDA) is currently pulling back on the daily timeframe and testing a critical support zone around the Fib 0.786 Daily level (~$202) and the upper Weekly Order Block ($197 – $190), which also aligns with the 200 Daily EMA.
🔑 Key Technical Scenarios:
Scenario A: Bullish Continuation (Order Block Holds)As long as this current support zone ($197 – $190) holds, the overarching overall bullish market structure remains intact. If buyers defend this level and trigger a r
Nvidiatrading
NVIDIA Forecast | Breakout or Pullback? Key Trading LevelNVIDIA has just delivered a sharp upward move after a prolonged period of intraday weakness. But here is the big question: Is this the beginning of a fresh bullish leg, or are buyers about to run into a wall of selling pressure?
NVDA is trading around $215.31 on the 15-minute chart, approaching a key supply zone that could determine its next move.
Let's decode the levels that matter.
The Battle Zone: $216.25–$216.65
This is the immediate supply zone to watch. How price behaves here could rev
Nvidia - Preparing the ultimate +100% breakout!🏅Nvidia ( NASDAQ:NVDA ) will double in the near future:
🔎Analysis summary:
For the entire past year, Nvidia has not been able to break the previous all time high resistance. But looking at the monthly candle of October, Nvidia is now attempting the bullish breakout. If the breakout is confirmed, Nvidia could head for a +100% bullrun.
📝Levels to watch:
$220
Keep your #LONGTERMVISION🙏
— Phil (@TheTraderPhil)
NVIDIA (NVDA) Trading Plan | POC $215.64 Is the Deciding LevelCurrent Price: $216.22
Chart Timeframe: 15-minute
NVIDIA is trading above the Point of Control (POC) at $215.64, but the latest candles show selling pressure. The next move depends on whether buyers defend the POC or sellers push price below it.
🟢 Bullish Scenario
Trigger: A 15-minute candle closes above $215.64 and holds on a retest, supported by volume and buying strength.
Upside targets: $218.95 → $221.51 → $224.09
Confirmation: Price sustains above the POC and breaks nearby resistance.
NVIDIA (Nvda) Outlook | Sell-off Or Buying Opportunity💻 15-Minute Technical Analysis | Globus Capitas
NVIDIA has faced fresh selling pressure, with price slipping below the key $224.40 POC (Point of Control) after trading in a relatively tight range. The next move depends on whether buyers can reclaim this level or sellers extend the decline.
🔑 KEY LEVELS TO WATCH
⚪ POC / Key Pivot: $224.40
🟢 UPSIDE SCENARIO | Bulls Regain Control
A sustained 15-minute close back above $224.40, followed by confirmation, could open the way towards:
🎯 Target 1:
NVIDIA ($NVDA) – Ascending Triangle Decision Point!NVIDIA is approaching a critical juncture on the daily chart (1D). Price action is consolidating directly below a key resistance line while continuing to print higher lows along a well-defined ascending trendline.
📊 Technical Setup
Current Price: ~$230.79
Resistance Level (Red Line): ~$232 - $235
Ascending Support (Green Line): Dynamic trendline holding the higher lows.
🟢 Bullish Scenario (Breakout)
If NASDAQ:NVDA breaks and holds above the $232 - $235 resistance zone on a daily closing ba
Nvidia - Setting up for another textbook swingtrade!🏅Nvidia ( NASDAQ:NVDA ) is once again heading for support:
🔎Analysis summary:
This month, Nvidia once again tried to create a new all time high but failed. And looking at the higher timeframe, Nvidia could soon drop about -20% back to the next major support. If Nvidia creates this correction very soon, we can enter another textbook swingtrade.
📝Levels to watch:
$170 and $225
Keep your #LONGTERMVISION🙏
— Phil (@TheTraderPhil)
Nvidia - This bullrun is simply not over!🏅Nvidia ( NASDAQ:NVDA ) might finally break out soon:
🔎Analysis summary:
After the major bullish breakout back in 2015, Nvidia entered into a super bullish channel pattern. But recently, Nvidia has just been consolidating in a very narrow bullish range. With earnings coming up, Nvidia could finally create this next major bullish breakout.
📝Levels to watch:
$220 and $170
Keep your #LONGTERMVISION🙏
— Phil (@TheTraderPhil)
NVIDIA (NVDA) – Key Levels to Watch | 15-Min ChartNVDA is currently trading around $215.49, sitting right on an important support zone after a sharp rejection from the higher levels.
🔴 Immediate Resistance: $216.21–$216.49
🟢 Immediate Support: $215.49
📈 Bullish Scenario
A sustained 15-min close above $216.49 could trigger an upside move toward:
🎯 $217.84
🎯 $219.27
🎯 $220.50
📉 Bearish Scenario
If $215.49 breaks decisively, weakness could extend toward:
🎯 $214.11
🎯 $212.99
🎯 $211.49
⚠️ Key takeaway:
The $215.49–$216.49 zone is the immedia
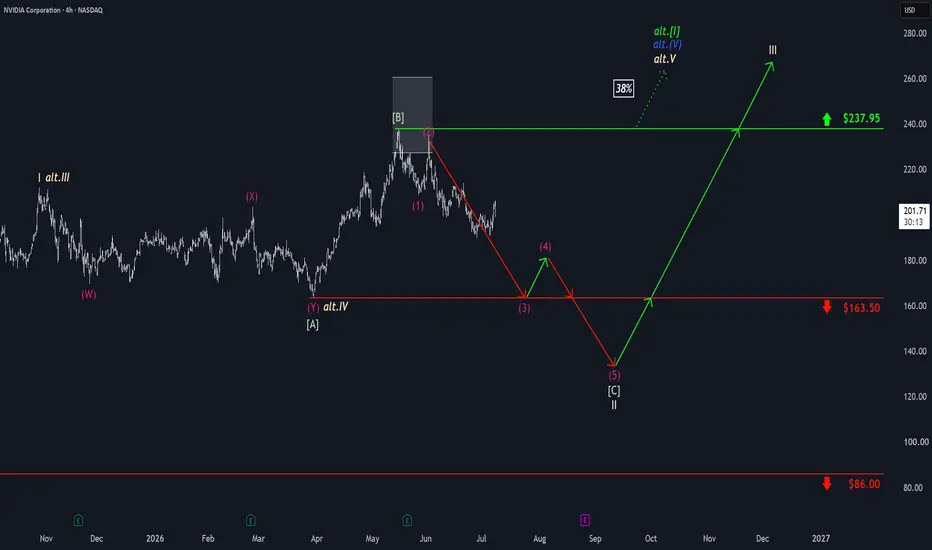
Nvidia: Corrective Top EstablishedNvidia has now clearly turned lower and has already dropped below our red Target Zone ($219.37–$232.33). We now believe a (corrective) top has formed within this range as anticipated, and we are primarily preparing for further declines. Currently, we see NVDA in the third wave of a downward impulse and expect additional significant sell-offs below support at $188.78. In our alternative scenario, there could be gains above resistance at $237.95, where an early long-term cycle top would then be ex
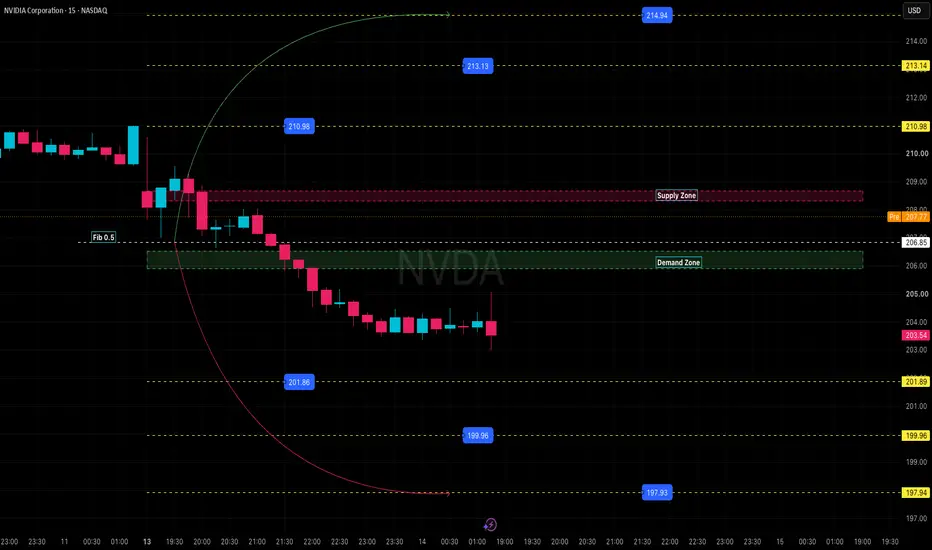
NVDA — The Compression Before the Next MoveNVIDIA | 15-Minute Trading Plan
NVDA is currently trading around $225.18, with price compressed between a well-defined Demand Zone ($224.60–$225.10) and Supply Zone ($226.85–$227.50).
🎯 The Setup
1️⃣ Bullish Breakout
A sustained 15-minute close above $227.50 would signal that buyers have absorbed the supply.
Upside roadmap:
→ $228.16
→ $229.04
→ $229.96
A breakout + retest of $227.00–$227.50 would offer stronger confirmation than chasing the initial candle.
2️⃣ Bearish Breakdown
If NVDA lo
NVDA 1H: Crucial Retest at Premium Supply ZoneAfter a period of consolidation and a deep pullback to the high $180s, NVIDIA (NVDA) has staged a powerful V-shaped recovery. Price action has now returned to a major overhead supply zone. The 1H chart shows we are in a 'premium' pricing area, where substantial institutional selling has previously occurred. This presents a high-probability decision point.
Technical Breakdown
1. Primary Support/Accumulation Zone (Bottom - Green Box):
Location: ~$185.00 – $189.00
Chart Note: This area was ide
Nvidia - Preparing a new all time high!🎯Nvidia ( NASDAQ:NVDA ) remains bullish either way:
🔎Analysis summary:
Literally since 2015, Nvidia has been trading in a textbook rising channel pattern. And with the recent consolidation, Nvidia is getting quite close to a major confluence of support. Either we see a retest of this levle first or Nvidia is already heading for new all time highs.
📝Levels to watch:
$170 and $230
Keep your #LONGTERMVISION🙏
— Phil (@TheTraderPhil)
NVIDIA | Momentum or DistributionAI Leadership Faces a Critical Test – Momentum or Distribution?
NVIDIA begins the week at a pivotal technical level as markets assess whether institutional investors continue accumulating AI leaders or begin rotating into other sectors. While the long-term AI narrative remains intact, short-term price action is likely to be driven by earnings expectations, valuation sentiment, and overall Nasdaq strength.
The first hour of trading could provide valuable insight into institutional positioning
NVIDIA | AI Momentum vs Profit Booking | Trading PlanNVIDIA at a Decision Point | Will AI Momentum Drive the Next Breakout?
NVIDIA remains one of the strongest leaders in the AI sector, but price is approaching a zone where institutional profit booking and fresh accumulation will determine the next move. While the long-term AI narrative remains intact, short-term volatility is likely to be driven by earnings expectations, semiconductor demand, and macroeconomic developments.
Market Drivers
🤖 Continued global investment in AI infrastructure.
💻 St
Nvidia - Preparing a textbook swingtrade!🏅Nvidia ( NASDAQ:NVDA ) is heading for a major support:
🔎Analysis summary:
For almost 12 months now, Nvidia has overall been moving completely sideways. But looking at the higher timeframe, Nvidia is approaching a major confluence of support. If we see the retest and bullish confirmation, this will simply be another textbook setup.
📝Levels to watch:
$170
Keep your #LONGTERMVISION🙏
— Phil (@TheTraderPhil)
NVIDIA (NVDA) | Price Action AnalysisNVIDIA is approaching a key technical decision zone where momentum could accelerate in either direction. With AI optimism, institutional participation, and broader Nasdaq sentiment driving the stock, today's strategy is simple: wait for confirmation before committing to a trade.
🟣 Bullish: Buy only after a confirmed breakout above resistance.
🟣 Bearish: Sell only after a confirmed breakdown below support.
🔑 Market Drivers
🤖 Continued global demand for AI infrastructure and data center ex
NVIDIA (NVDA) | Trading Prediction | Friday, July 10, 2026NVIDIA remains one of the market's strongest AI-driven growth stocks, with price action heavily influenced by AI infrastructure spending, semiconductor demand, institutional fund flows, and overall Nasdaq sentiment. While the long-term trend remains constructive, short-term volatility is expected around key technical levels.
Key Themes
🤖 Continued AI investment and enterprise adoption.
💻 Strong semiconductor demand and data center growth.
📊 Institutional positioning and earnings expectations.
🌍
Nvidia: CountermovementNvidia shares recently saw a notable move higher, temporarily halting further bearish momentum. However, we believe this is just a short-term countertrend move, and expect renewed downside pressure to resume soon. At this stage, we see NVDA in the final major leg of a broader correction, and anticipate a stepwise sell-off below support at $163.50 as part of an internal downward impulse. The ultimate correction low is expected to form well above the $86 level, after which a new uptrend toward rec
Nvidia - Initiating new all time highs!🧸Nvidia ( NASDAQ:NVDA ) is heading for new highs again:
🔎Analysis summary:
Nvidia still remains in a clear underlying bullrun. And while everyone was waiting for an all time high break and retest, Nvidia formed new structure. With the major horizontal level holding price, it seems like Nvidia is now just really rallying towards fresh all time highs.
📝Levels to watch:
$175
🙏🏻Trusting the Trading Gods
Nvidia: Testing Key ResistanceNvidia shares have continued to gain, recently climbing above $212.16. However, after this initial attempt to break through that level, the stock saw a pullback. Overall, we expect further upside, though in our alternative scenario, we’d view the recent high as part of a smaller corrective (and overshooting) upward move. Primarily, we see NVDA in the final upward phase of a larger bullish cycle and anticipate further gains into our red Target Zone ($227.38–$260.60). The cycle top is likely to fo
Nvidia - Starting the final bearish drop!💩Nvidia ( NASDAQ:NVDA ) can drop a final -20%
🔎Analysis summary:
A couple of months ago, Nvidia perfectly retested the major channel resistance trendline. Thus we already witnessed a clear rejection of about -20%. And looking at the higher timeframe, Nvidia can still drop another -20% before it will retest a major support level.
📝Levels to watch:
$150
SwingTraderPhil
SwingTrading.Simplified. | Investing.Simplified. | #LONGTERMVISION
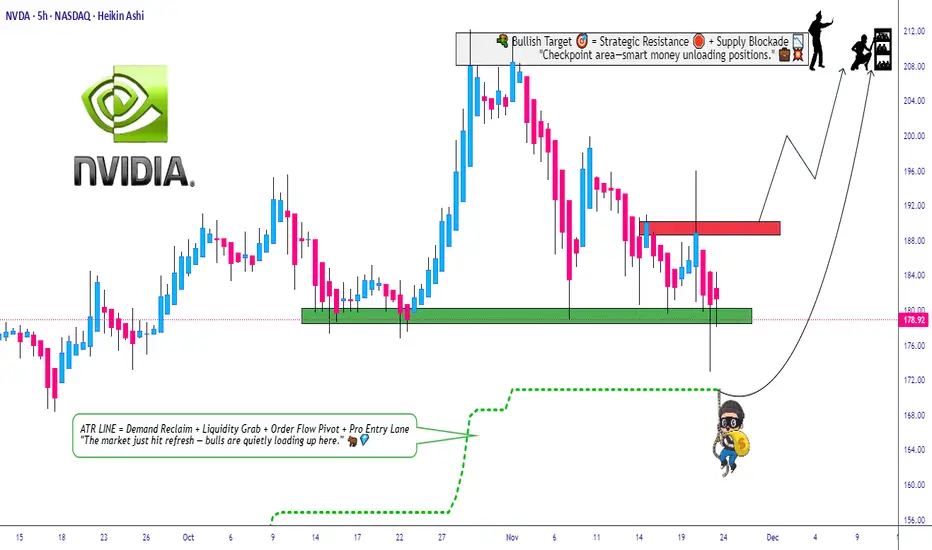
Can NVDA Hold the Pullback Zone and Extend the Uptrend?🔥 NVDA Bullish Pullback Playbook – Thief-Style Swing Setup 🚀🕵️♂️
Hey traders & my fellow Thief OG’s 😎🕶️ — here’s a clean, polished, TradingView-friendly version of my NVDA Swing Trade Playbook with a professional + funny touch. Let’s get to the setup 👇🔥
📌 Asset
NVDA – NVIDIA Corporation (NASDAQ)
Swing Trade | Momentum | Trend-Following Setup
📈 Plan: Bullish Pullback Strategy (Pending Orders Active)
The trend is strong, the buyers are steady, and NVDA is still delivering clean higher-lows. We'r
Nvidia: Correction CompleteNvidia recently showed a clear move to the upside, leading us to view the previous correction as complete and to prepare for further gains in the near term. Currently, we see NVDA in the final upward stage of a broader bullish cycle and are looking for further gains into our red Target Zone ($227.38–$260.60). The cycle top is expected to form within this range. In our alternative scenario, NVDA may have already completed the upward cycle with the peak at $212.16. If so, the stock would now be in