Global trend continuation on Philip Morris Int. (Ticker PMI)NYSE:PM
Fundamentals:
- recent yearly and quarterly reports of PMI were pretty nice due to the art of bussiness (comsumer staples) as well as specification of the product - tabak-related items, and we all know that whatever happens people will continue smoking. Their business with electronic cigarettes improves, erobers the market and brings revenue and earnings. And this is de-facto one of the main reasons why investors would hold money in the business and even buy more - because of reccuring dividends and more or less stable earnings. Even the current lower than expected earnings for Q4 of 2025 are completely overblown by positive 2026-2028 earnings expectation report. I personally saw new production factories the company builds near the existing company buildings in the country I am living in, and that only means that they have money and they have demand on their product which makes it reasonable to continue expanding
- as the market sentiment remains unstable and is the reason for worries of most of traders, the consumer industry has historically played a role of a safe harbor for the times of instability and as regular cash flow during bullish times
- these factors do speak more for possible existence of further investors interest in the company, which may lead to further growth
- but dont forget that there are financial reports every 3 months, and situation can always change and smart money might decide to take out money from an asset which is definetly on its local or global highs
Technicals:
- the negative factor is the possible upside W-formatted double-top pattern on the global picture which in case of negative news can push the price down
- there are stop-losses directly above recent high in June 2025, so if price reaches that level a lot of short squeezes can be triggered
- in case of positive scenario and move forward I expect the price to retest the closest zone which has not yet acted as support
- but this will only happen if the further upward movement is weak
- if the price continues the upward movement straight from the place it is now (182.00-183.00) it can mean a strong trend continuation
- nevertheless if the "not-really-good-one support zone" does not hold the price at 173.00, a next target on 163.00 can be taken into account
Conclusion:
- due to market sentiment and technical upside W-formation it is recommended to follow the price action on Friday 6 Feb., but enter the trade on Monday 9 Feb.
- if price shows strengh and moves forward the recent high, I will look for medium-term trend continuation
- but in case there are no significant changes today on 6 Feb and bearish news over weakend, the short-term downside correction scenario to 173.00 or 163.00 will be taken under loop, but decission met on spot
- sometimes it is better to wait than to hurry
# - - - - -
WAIT UNTIL 9 February for decission
⚠️ Short-term Signal - Sell ⬇️
✅ Entry Point - Stop-limit on 182.00
🛑 SL - 187.24
🤑 Partial TP 50% - 171.36
🤑 Final TP 100% - 163.79
⚙️ Risk/Reward - 1 : 2 and 1 : 3.5👌
⌛️ Timeframe - 1 week 🗓
# - - - - -
Only if short trade succeeds
⚠️ Long-term Signal - Buy ⬆️
✅ Entry Point - 173.24
🛑 SL - 158.53
🤑 TP - 223.54
⚙️ Risk/Reward - 1 :3.44 👌
⌛️ Timeframe - 1 month 🗓
# - - - - -
Alternative HIGH RISK
⚠️ Long-term Signal - Buy ⬆️
✅ Entry Point - Stop-limit 184.80
🛑 SL - 17.34
🤑 TP - 223.54
⚙️ Risk/Reward - 1 : 2.9 👌
⌛️ Timeframe - 2 weeks 🗓
Good Luck! ☺️
# - - - - -
DISCLAIMER: Not financial advice. Everyone must make trading decisions at their own risk, guided only by their own criteria and strategy for opening or not opening a trade
Nyse-x

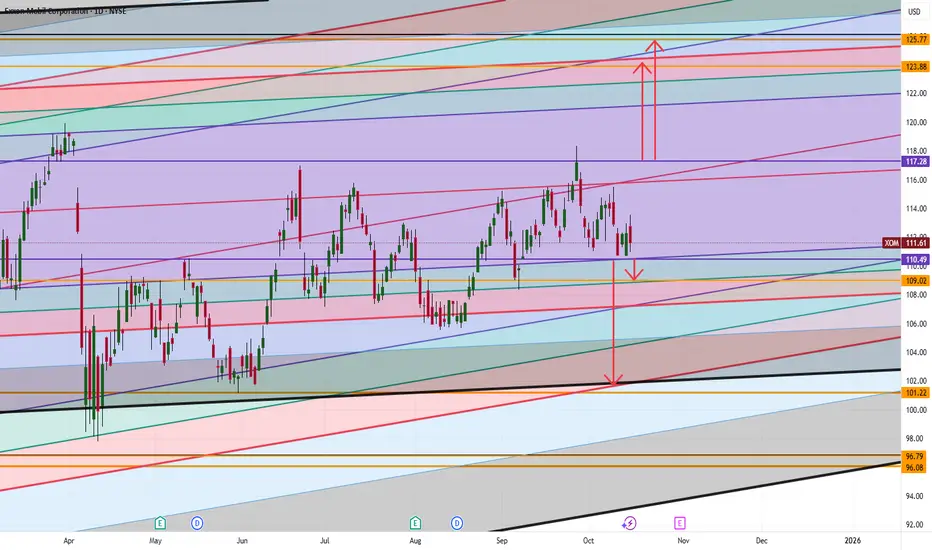
Exxon Mobil (XOM) Simple Market Breakdown!XOM’s sitting at a key level right now; momentum could go either way depending on the next breakout ⚡
Here’s what I’m watching:
📈 If we break above 117.28, that could open the door for a push up toward 123–125; that’s our next major target zone.
📉 But if we drop below 110.49, then we could see a move down toward 109, and possibly even 101 if selling pressure continues.
💡 So, short-term watch those breakout and breakdown levels closely.
Long-term ; whichever side breaks first will likely set the direction for the next big move.
Want to see how I’m tracking these levels and the signals I’m using to confirm the breakout?
💬 DM me “XOM” and I’ll share my private chart breakdown directly.
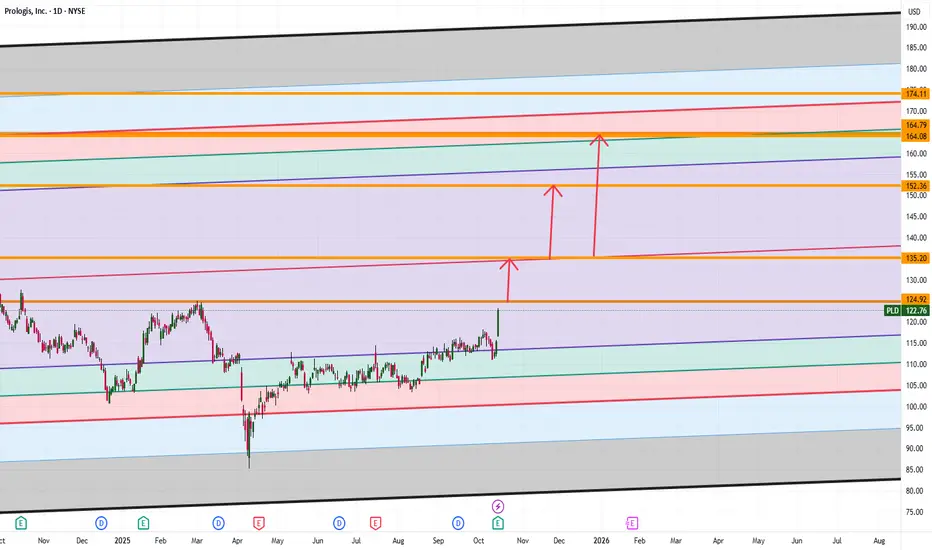
Prologis (PLD) Simple Market Breakdown!PLD’s been showing solid momentum lately 📈 and here’s the key zone I’m watching:
✅ If we break and hold above 124.92, the next target zone is around 135.20.
⚠️ At that level, we could see some correction or sideways movement (a bit of rest before the next move).
🚀 But if PLD breaks above 135.20 and holds, that could set up the next big leg toward 152, and possibly 164.
💡 So short-term; watch for a small pause. Long-term; momentum still looks strong if we keep closing higher.
Want to see how I’m mapping out the next levels and what signals I’m tracking for confirmation?
💬 DM me “PLD” and I’ll send you the full chart breakdown directly.
Mindbloome Exchange
Trader Smarter Live Better
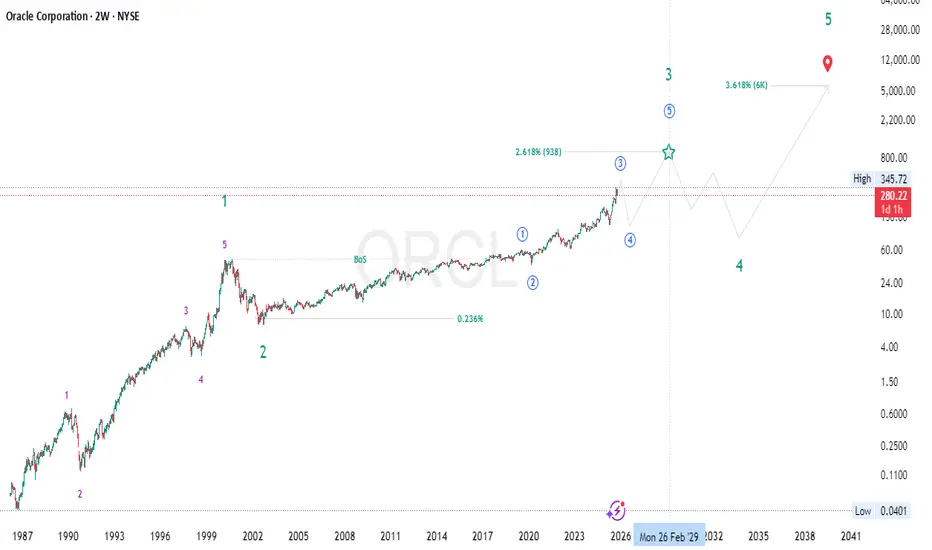
ORACALE (ORCL) Rally! Cycle 3 → $400, Eyes on Supercycle $6,000🌀 ORACLE (ORCL) – Elliott Wave Supercycle Analysis | Smart Money & Fibonacci Confluence
🔭 Macro Perspective
Oracle’s long-term chart (NYSE: ORCL) showcases a powerful Supercycle (III) wave in motion — a multi-decade expansion phase fueled by institutional participation, structural growth, and technological innovation.
The internal Cycle waves (1–5) are clearly defined, with current price action positioned deep within Cycle Wave (3) — the strongest segment of this major bullish leg.
🟢 Supercycle Wave (I) (1987 – 2000)
Elliott Behavior: The first grand impulsive advance, representing Oracle’s rise during the early software and database revolution.
Fibonacci Structure: Wave (3) extended toward the 2.618× of Wave (1), typical of an early institutional growth wave.
SMC Dynamics:
Breaks of structure (BoS) at each impulsive stage.
Liquidity sweeps before rallies — consistent smart money accumulation patterns.
Fundamentals: Explosive earnings growth through enterprise software adoption and global market expansion.
💥 Conclusion: The dot-com peak in 2000 completed Supercycle (I).
🔵 Supercycle Wave (II) (2000 – 2002)
Nature: The sharp, emotion-driven retracement following the tech bubble.
Fibonacci Retracement: Retraced into the 0.236 zone of (I), providing the long-term discount region for accumulation.
SMC Characteristics:
Liquidity grab beneath 1998–1999 structure.
Long accumulation base confirming institutional re-entry.
Fundamentals: Oracle streamlined operations and built the groundwork for enterprise-level solutions.
🧱 Bottom: Wave (II) ended around 2002 — the base of today’s decades-long uptrend.
🟣 Supercycle Wave (III) (2002 – 2030s, ongoing)
This ongoing macro impulsive wave contains five internal Cycle Waves (1–5) .
⚪ Cycle Wave (1) (2002 – 2019)
Elliott Context: A powerful, sustained impulsive leg lasting nearly two decades.
Structure: Clean five-wave advance with strong extensions during 2010–2019.
Fibonacci Note: The move achieved near the 1.618× extension relative to its starting point.
SMC Insight:
Consistent higher highs and higher lows throughout the period.
BoS continuation patterns confirming institutional markup.
Fundamentals: Expansion of Oracle’s business model — cloud transition, data analytics, and enterprise software dominance.
📈 End: Cycle (1) peaked near 2019 , completing the first internal impulsive leg of Supercycle (III).
🔵 Cycle Wave (2) (2019 – 2020)
Nature: A sharp yet shallow correction that coincided with the global market decline (COVID crash).
Fibonacci Retracement: Retraced around the 0.236–0.382 zone of Wave (1).
SMC Dynamics:
Liquidity sweep under 2018–2019 structure.
Fast accumulation pattern — strong re-accumulation footprint.
Fundamentals: Short-term market shock, but Oracle’s fundamentals remained intact and rebounded swiftly.
🧭 Conclusion: Cycle (2) ended in 2020, setting the foundation for the explosive ongoing Cycle (3) rally.
🟢 Cycle Wave (3) (2020 – ~2026, in progress)
Elliott Context: The most powerful internal impulsive wave — currently unfolding.
Target Zone: Projected to complete near $380–$400 , expected around late 2025 to early 2026 .
Fibonacci Extension: The 2.618× extension of Wave (1) perfectly aligns near $400.
SMC & Market Structure:
Continuous BoS and HH–HL formations — clear institutional control.
No macro distribution yet; structure remains intact.
Liquidity inducements near highs suggest ongoing markup phase.
Price Action: Aggressive impulses, shallow retracements, and orderly continuation patterns.
Fundamentals:
Rapid expansion in Cloud Infrastructure (OCI), AI-driven services, and recurring revenue models.
Sustained EPS growth and improved margin performance support wave maturity.
🚀 Expectation: Completion near $400 will likely trigger a Cycle (4) corrective structure before the final impulsive push.
🟠 Cycle Wave (4) (Projected: 2026 – 2028)
Elliott Behavior: A corrective phase — retracing part of the strong Cycle (3) run.
Fibonacci Retracement: Expected correction into the 0.236–0.382 zone of Wave (3), roughly $200–$280.
SMC Insight:
Break of structure (BoS) near top zones to induce liquidity.
Re-accumulation base forming after liquidity sweep below key supports.
Market Psychology: Cooling from euphoria, consolidation, and rebalancing of valuations.
Fundamentals: Period of stabilization after several years of aggressive expansion.
📉 Outlook: Likely forms the structural foundation for the next rally phase (Cycle 5).
🟢 Cycle Wave (5) (Projected: 2028 – early 2030s)
Elliott Context: The final impulsive leg completing Supercycle (III).
Target Zone: Fibonacci 3.618× extension (~$900–$950) of Cycle (1).
SMC Structure:
Final markup phase with strong BoS continuation patterns.
Climax rallies as retail sentiment peaks.
Price Action: Parabolic trend, thin retracements, and expanding volatility.
Fundamentals: Oracle could cement its dominance in global data, AI, and enterprise infrastructure markets.
💎 Completion: Cycle (5) will mark the end of Supercycle (III), leading into the long-term corrective Supercycle (IV).
🔶 Supercycle Wave (IV) (Projected: 2030s – 2040s)
Nature: Major macro correction after decades of expansion.
Fibonacci Depth: Likely retraces into the 0.382–0.5 zone of (III).
SMC Behavior: Distribution → liquidity sweep → re-accumulation.
Market Context: Could align with macroeconomic tightening or sectoral rotation.
📊 Purpose: To reset valuations and build energy for the final Supercycle (V).
🟩 Supercycle Wave (V) (Projected: 2040s – 2050s)
Elliott Context: The final impulsive wave of Oracle’s century-long trend.
Fibonacci Target: 3.618× expansion (~$6,000).
SMC Behavior: Final institutional markup followed by distribution and secular reversal.
Fundamentals: Could coincide with Oracle’s role as a global AI–data infrastructure leader.
🚀 Legacy Wave: The culmination of decades of innovation and expansion.
⚙️ Macro Summary
Accumulation (1980s–1990s) – Smart money foundation.
Expansion (2000s–2020s) – Institutional markup phase.
Distribution (2030s) – Macro correction and rotation.
Re-accumulation (Post-2040s) – Long-term reset for future cycles.
🧠 Technical & Fundamental Alignment
✨ Elliott Structure: Clear impulsive (I–V) sequence with macro rhythm.
✨ Fibonacci Confluence: $400 (2.618× of Wave 1) & $900 (3.618× of Wave 1).
✨ SMC: Institutional control with clean BoS → reaccumulation → continuation.
✨ Price Action: Aggressive bullish order flow with no macro distribution yet.
✨ Fundamentals: Oracle’s AI + Cloud strategy drives sustainable growth.
🌍 Conclusion
Oracle (ORCL) continues to trend within Supercycle (III) — the most powerful long-term wave.
Cycle Wave (3): In progress, targeting $380–$400 by end of 2025 / early 2026.
Cycle Wave (4): Anticipated retracement toward $200–$280 zone.
Cycle Wave (5): Final impulsive run toward $900+ into the early 2030s.
📈 Macro Bias: Long-term bullish — institutional structure intact.
📊 Short-term Outlook: Momentum strong but nearing Cycle 3 completion; prepare for corrective rotation.
💬 Summary: Oracle’s price evolution beautifully mirrors its technological growth story — a near-perfect alignment of Elliott Wave symmetry , Smart Money structure , and fundamental strength . The completion of Cycle 3 near $400 will open the door to an ideal re-entry opportunity for the next macro leg higher.
#ORCL 📈 #Oracle 💼 #ElliottWave 🌊 #WaveAnalysis 🔹 #Supercycle 🚀 #Fibonacci 📊 #SmartMoney 💎 #PriceAction 🕯️ #MarketStructure 🏗️ #LongTermBull 🟢 #StockAnalysis 💹 #TechnicalAnalysis ⚙️ #Investing 💰 #TradingViewIdeas 💡
💬 Respected traders and analysts!
Your insights matter. Share your views, confirmations, or constructive criticism in the comments below. Let’s discuss ORCL’s structural evolution, Elliott Wave setup, and long-term Supercycle potential 🚀📈.
— Team FIBCOS 💎
OKLO 1D: Transition phase after declineOn the daily chart OKLO has shifted from a prolonged downtrend into a basing phase. After a sequence of lower highs and lower lows, price broke out of a falling wedge and pulled back into a demand zone. Selling pressure failed to resume and recent lows remain intact.
From a structural perspective, price action reflects a complex base following the decline. The 80–90 area remains pivotal, aligning with the 200-day moving average and the 0.786 Fibonacci retracement. This confluence has already produced multiple reactions, reinforcing its relevance. Momentum indicators confirm stabilization rather than trend continuation, with MACD exiting negative territory while ADX remains subdued.
The primary structural reaction level sits near 115, marking the upper boundary of the current base. Acceptance above this area would open the door for structural expansion toward the 160 region. Failure to hold the 80–90 zone would invalidate the basing scenario and return price to a neutral structure.
From a fundamental standpoint the company remains early stage. EPS TTM stands at −9.68, with Q4 2025 EPS estimated at −0.17. Revenue remains absent, while cash flow stays negative, with operating cash flow at −62.2M and free cash flow at −68.5M. Liquidity remains strong, with cash per share at 6.13 and minimal debt, supported by recent capital inflows. Enterprise value is currently estimated at 13.8B.
At this stage the market is pricing structure and expectations rather than earnings. Price behavior within the base will define the next directional phase.
Price action leads before fundamentals follow.

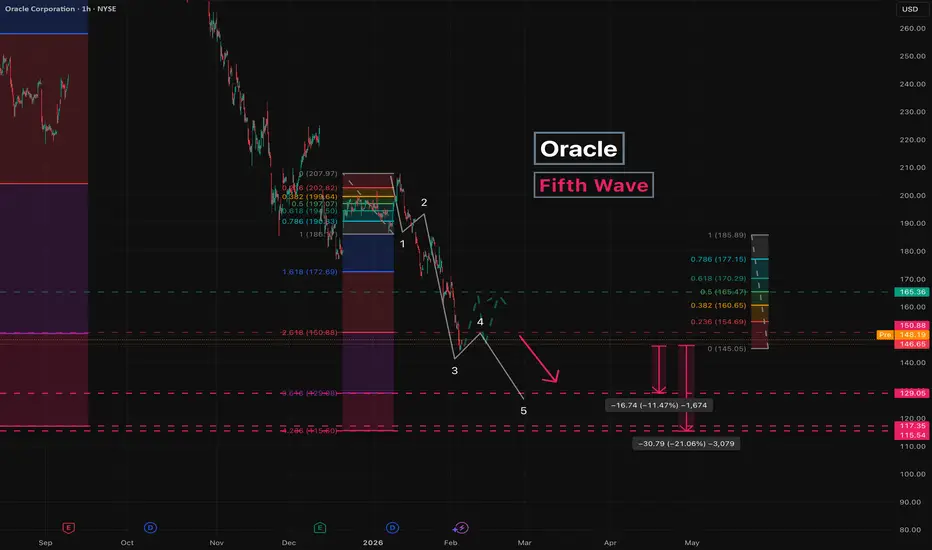
Oracle - Fifth WaveWe continue to analyze the decline in Oracle stock.
In the previous idea, we reached the first target at 150 , with price moving exactly along the projected path.
Wave 5 doesn’t look complete yet, so we expect further downside.
Before the next leg down, the price may pull back to around 165 or slightly lower.
Key targets:
129
117 / 115
Potential move from the current level: 11-21% .
A move below 100 is possible, but it’s too early to consider and seems unlikely for now.
Let’s focus on executing the current idea first.
---
Subscribe and leave a comment.
You’ll get new ideas faster than anyone else.
---
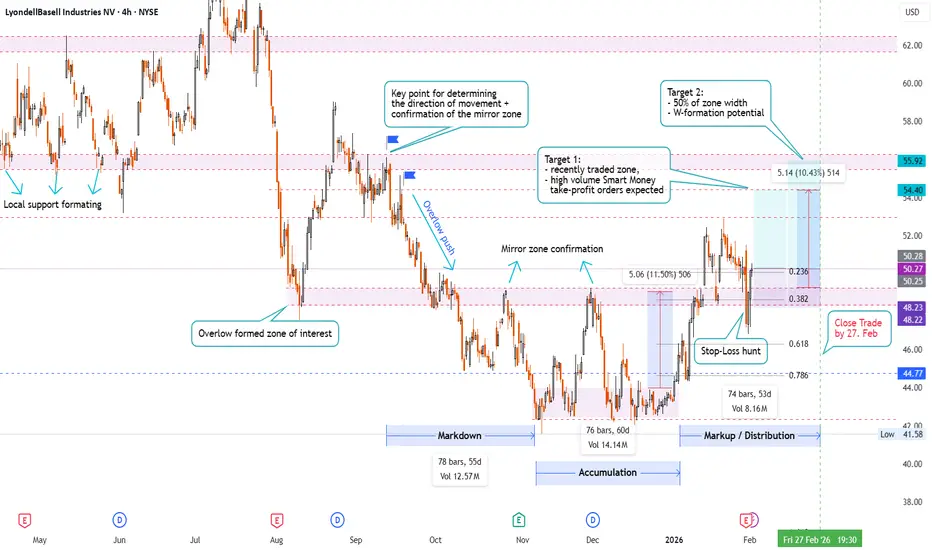
1-Month Long Trade on LyondellBasell Industries NV (Ticker LYB)NYSE:LYB
Technicals:
- price consolidated 60 days after new low formation, letting Smart Money accumulate position
- price diapason formed W-formation with peaks confirming ressistance
- after breaking out the ressistance it became mirror zone with currently proving if it can act as support, having shown resilience on recent retests (20 Jan., 30 Jan., 2 Feb.)
- due to Smart Money manipulations and HFT impact the stop-losses got hunted recently throwing out the early passengers and significantly bounced back to recent consolidation levels
- be aware that price double penetration on 30 Jan, 2 Feb show that the zone is still instable and further close below 20 Jan. may lead to short movement targeting the current Low retest
- scenario invalidated if 2 bars close below 48.35
Fundamentals:
- company held quarterly financial results during conference call on 30 Jan.. Despite there was a strong short candle on that day it is presumed to be the fault of whole market backstep
- the strong buyout on 2 Feb. speaks for at least "not dissapointing financial results"
- despite long-term market sentiment seems to be cloudy, their product remains (under circumstances) pretty demanded for consumer production, so the company may keep balacing on the edge at least for some time before falling under the bear
Conclusion:
- as the markdown and accumulation lasted around 60 days each it is assumed that both the markup and distribution phases may last equal time. Therefore it is recommended to close the trade by 27 Feb.
# - - - - -
⚠️ Signal - Buy ⬆️
✅ Entry Point - 50.25
🛑 SL - 48.22
🤑 TP 1 - 54.40
🤑 TP 2 - 55.92
⚙️ Risk/Reward - 1 : 2.8 👌
⌛️ Timeframe - 1 month 🗓
# - - - - -
Good Luck! ☺️
DISCLAIMER: Not financial advice. Everyone must make trading decisions at their own risk, guided only by their own criteria and strategy for opening or not opening a trade.
Oracle - Seeking SymmetryLet’s examine the corrective impulsive move that began in September 2025.
When breaking this movement down into waves and sub-waves, we can observe multiple waves that are roughly equal in size at both the beginning and the end of the structure, marked in red .
If the wave count is correct, one final wave is still missing - its projected size is marked in blue .
This becomes especially evident if we extend a flat correction from the last completed fifth wave and take into account that it typically retraces 50–60% of the prior wave. Under these assumptions, the structure aligns well.
Additionally, when applying Fibonacci levels from the first impulsive wave, they converge with the projected completion area of the move.
Conclusion:
The move is targeting the 150 level. From that area, a new phase of price action is expected to begin.
---
Please subscribe and leave a comment.
You’ll get new information faster than anyone else.
---

BlackRock - Coming Down from the TopFrom April to October 2025, a five -wave impulsive move to the upside was formed.
Since October 2025, the stock has been in correction, forming the final wave C .
The correction type is flat .
Key targets:
984 - local correction
909
863
The potential move from the current level is 7-18% .
We assess this move as the beginning of a larger wave C , meaning that the downside move is likely to continue.
---
Subscribe and leave a comment.
You’ll get new ideas faster than anyone else.
---

GME Bulls Reloading? MA Breakout Strategy Explained🎮 GAMESTOP (NYSE: GME) — "THIEF HEIST LAYERING STRATEGY" 💰
Multi-Entry Breakout Accumulation Playbook | Day/Swing Trading
🔥 "THE GRAND THEFT PROFIT OPERATION" — Executive Setup
Current Market Data ✅ Feb 4, 2026 — Real-Time Feed
Price: $24.52 | Range: $23.84 - $26.09 (Today) | Trend: Bullish Momentum 📈 | Volume: Above Average | Bias: LONG
🎯 THE HEIST BREAKDOWN
What's the Setup? 🎪
Think of this like a professional heist crew approaching a vault. We're using a moving average breakout + retest strategy combined with multi-layer limit orders (Thief layering technique) to accumulate positions at discounted levels. When price pulls back to confirm support on the MA line, that's our signal to stack the bags like a seasoned criminal! 😎
Technical Foundation: 🛠️
Indicator: Double Exponential Moving Average (DEMA) — acts as dynamic support on pullbacks
Pattern: Breakout + Retest continuation (classic bullish reversal pattern)
Timeframe: 3-Hour candles (optimal swing trade window)
Risk Profile: Moderate-High (GME volatility = 8.43%) ⚡
💎 ENTRY STRATEGY — "BUILDING THE HEIST CREW"
Multi-Layer Buy Limit Orders (The Thief Layering Method) 🔓
Instead of YOLO'ing into one entry, we deploy MULTIPLE limit orders at strategic price levels. This is how professionals steal profits! 🏴☠️
🔴 ENTRY LAYER 1: $23.00 ← Scout Position (Risk Capital)
🔴 ENTRY LAYER 2: $23.50 ← Core Accumulation (Main Position)
🔴 ENTRY LAYER 3: $24.00 ← Momentum Confirmation
🔴 ENTRY LAYER 4: $24.50 ← Final Entry (Breakout Confirmation)
🎓 PRO TRADER NOTES:
You can CUSTOMIZE YOUR LAYERS based on:
💰 How much capital you're willing to deploy
📊 Your risk tolerance & position sizing
⚡ Volatility conditions (add more layers if IV is high, fewer if calm)
📈 Support/resistance levels on your chart
This is YOUR game — set 2 layers, 5 layers, 10 layers — whatever matches YOUR plan!
🎯 PROFIT TARGET — "THE GREAT ESCAPE WITH LOOT"
Primary Target: $28.00 🚀💵
Why $28?
✅ +14.3% Upside from current $24.52 entry zone
✅ EMA Resistance Cluster — where previous rallies stalled (Police Barricade) 🚓
✅ Overbought Zone Approaching — RSI signals caution above 70
✅ Natural Profit-Taking Level — institutions dump here historically
The "Trap Alert" 🪤
Price often tricks retail into holding too long after touching resistance. When you see RSI > 70 + price touching MA resistance + volume declining, that's the escape signal! Take profits, don't get greedy.
⚠️ CRITICAL DISCLAIMER ON PROFIT TARGETS:
🎤 Dear Thief OG's & Trading Fam, this $28.00 target is just a suggestion based on technical analysis. YOU control your exits! Taking profits at $26, $27, $27.50, or $29 is 100% YOUR choice. Different market conditions = different exits. Risk-reward ratios matter more than hitting exact levels. Do NOT blindly follow my target — adapt like a professional.
🛑 STOP LOSS — "THE EMERGENCY ESCAPE PLAN"
Hard SL: $22.00 🚨
Why $22?
✅ -8.25% Risk/Position — acceptable loss for swing trade framework
✅ Below Key Support Zone — breaks here = downtrend confirmed
✅ Protects Your Capital — if fundamentals shift, you're protected
⚠️ CRITICAL DISCLAIMER ON STOP LOSS:
🎤 Dear Thief OG's, your stop loss is YOUR responsibility! Setting it tighter ($21.50), wider ($21.00), or using trailing stops is your discretion. Position sizing matters more than SL placement. Protect capital first, chase profits second. This is education, not financial advice.
📊 FUNDAMENTAL CATALYSTS — "THE REAL TREASURE MAP"
🔥 GAME-CHANGING EVENTS (Next 2-3 Months)
1. TRANSFORMATIONAL M&A MEGA-DEAL 🏢💰
CEO Ryan Cohen announced plans for a "very, very, very big" acquisition of a publicly traded consumer company. This is potentially 10x market cap expansion! He's targeting a Berkshire Hathaway-style holding company model. Timeline: Q1 2026 announcement possible. Impact: Could trigger 20-100% rally if deal announced. Capital: $9B war chest ready to deploy.
2. SHAREHOLDER VOTE — COHEN PERFORMANCE AWARDS ⏰📅
Event: Special meeting March/April 2026
Details: 171.5M share options at $20.66 strike
Vesting: Full payout if $100B market cap + $10B cumulative EBITDA achieved
Signal: Cohen is 100% aligned with shareholders — "skin in the game" = bullish psychology
3. INSIDER BUYING ACCUMULATION 💼📈
Ryan Cohen personally bought 500K shares on Jan 20-21 at $21.11 average. He now owns 9.2% of company (41.58M shares). When insiders buy heavy, smart money follows. This is real capital at risk from the CEO himself.
4. MICHAEL BURRY BACKING THE PLAY 🎯
Famous "Big Short" investor Michael Burry disclosed he's BUYING GME shares! Burry stated: "I believe in Ryan... the setup, governance, and strategy are compelling." This adds institutional credibility to the transformation narrative. Burry doesn't make casual bets.
💹 POSITIVE ECONOMIC TAILWINDS
✅ Q1 2026 Earnings Beat — Last quarter surprised 20% above estimates (EPS: $0.24 vs $0.20 expected)
✅ Next Earnings: March 31, 2026 (estimated $0.37 EPS)
✅ Free Cash Flow Positive: $130-160M annually — company is self-sustaining
✅ $9B+ War Chest: Fortress balance sheet for aggressive expansion
✅ Retail Sector Sentiment: Improving as Fed signals spring rate cuts
⚠️ RISK FACTORS TO MONITOR
❌ Execution Risk: M&A integration historically difficult in retail
❌ Macro Slowdown: Consumer discretionary vulnerable to recession
❌ Valuation Risk: Requires flawless execution to hit $100B target
❌ Bitcoin Exposure: $368M holdings could be liquidated (creates uncertainty)
❌ Inflation Persistence: Weak consumer spending in lower-income brackets
🔗 CORRELATED PAIRS TO WATCH — "THE CREW'S RELATED PLAYS"
Consumer Discretionary Sector Movers 📊
Strong Correlation Pairs:
🔵 BBY (Best Buy) — $65.57 — Electronics retailer, benefits from Fed rate cuts
Key Correlation: +0.67 correlation to GME (positive tech trend moves together)
Watch: Q1 earnings, consumer electronics demand trends
🔵 HD (Home Depot) — Furniture/Home Focus — Consumer discretionary bellwether
Key Correlation: +0.54 (macro consumer health indicator)
Watch: Housing starts, mortgage rate movements
🔵 TJX (TJMaxx) — $90+ range — Value retail leader with strong fundamentals
Key Correlation: +0.48 (bargain-hunting consumer sentiment)
Watch: Discount retailer strength = weakness in full-price retail
🔵 XRT (Retail Sector ETF) — Broad retail exposure
Key Correlation: +0.61 (sector momentum indicator)
Watch: If XRT breaks above 50-day MA, GME tailwinds strengthen
Inverse Correlation (Risk Monitor):
🔴 VIX (Volatility Index) — Stock market fear gauge
Watch: If VIX spikes above 25, expect sector rotation OUT of retail
Key Points on Correlations:
🎯 When consumer discretionary sector rallies (interest rate cuts expected spring 2026), GME typically follows higher. If Fed holds rates "higher for longer," discretionary plays face headwinds.
🎯 GME has lower beta (0.54) than broader market = more stable than sector peers, but higher than S&P 500.
🎯 If BBY or HD earnings disappoint, GME could face sympathy selling despite strong fundamentals.
🎓 TRADER'S MINDSET — "THE THIEF CODE"
💪 Rule #1: Never bet what you can't afford to lose — this is speculation, not investment
💪 Rule #2: Your entry layers = YOUR choice, not mine
💪 Rule #3: Your exit price = YOUR choice, not mine
💪 Rule #4: Position size = YOUR responsibility
💪 Rule #5: Enjoy the journey, respect the risk 🎯
✨ If you find value in my analysis, a 👍 and 🚀 boost is much appreciated — it helps me share more setups with the community!
📌 DISCLAIMER — "THIEF STYLE TRADING STRATEGY — ENTERTAINMENT ONLY"
This analysis is created purely for educational entertainment purposes using the "Thief Strategy" concept for creative flair. This is NOT financial advice, and I am not a registered financial advisor. GameStop (GME) is a volatile, speculative stock with significant risk. Past performance does not guarantee future results.
Your Capital, Your Responsibility:
Do not trade with money you can't lose
Always conduct your own due diligence
Consult a licensed financial advisor before making investment decisions
GME remains a high-risk speculation — position size accordingly
The acquisition thesis is unproven; execution risk is real
Trade with intelligence, trade with discipline, trade with respect for risk. 🎯

#GBPJPY , a CRAZY Pair at CRAZY MODE of market📊 Morning Market Brief | London Session Prep
🔎 Instrument Focus: #GBPJPY
⚠️ Risk Environment: High
📈 Technical Overview:
a Risky and Not a Quality setup .
Don't rush
Buy Side of it , is at my watchlist as well
🚀 Trading Plan:
• Need Valid momentum Structure Close
• LTF ENTRY NEEDED ‼️
• Just and Only for QuickScalp
🧠 Stay updated with real time news and macro events, visit 👉 @News_Ash_TheTrader_Bot
#Ash_TheTrader #Forex #EURUSD #MarketInsight #PriceAction #TradingPlan #RiskManagement #LondonSession #Scalping #Futures #NQ #Gold

JNJ - The Growth ContinuesA long-term steady uptrend with minor pullbacks.
Price is currently in wave 5 and approaching its completion.
Let’s outline the potential completion and reversal zones.
Key targets:
Most probable:
243
261
Maximum scenario:
307
Estimated upside potential:
7-15%
Up to 35% in an extended scenario
---
Please subscribe and leave a comment!
You’ll get new information faster than anyone else.
---

CRM - Time to SellSince December 2024, a five -wave impulsive decline has been developing.
We are now entering the fifth wave.
At the moment, a minor pullback is possible before the decline continues, so caution is advised.
A return to the 367 level from current prices appears unlikely.
Key targets:
173
139
Estimated downside potential from current levels:
18–35%
---
Please subscribe and leave a comment!
You’ll get new information faster than anyone else.
---
Carvana - Wave CWe are analyzing the move starting from November 2025.
The five-wave upward structure has been completed.
We are now in the corrective phase, which we consider a r egular flat.
Waves A and B are already in place, and wave C has started to develop.
Wave C is expected to unfold as an impulse to the downside.
Key targets:
411 - local correction level
387 / 372 - potential reversal zones
---
Please subscribe and leave a comment!
You’ll get new information faster than anyone else.
---

DISNEYI felt the need to look into this particular stock since they're not only burning through cash, but they're also losing it by loyal customers jumping ship.
My analysis is hopeful thinking, but anything is possible nowadays. 🤷🏿♂️

$NET: The $464 Vision - Betting on the Edge AI Supercycle🌐🚀
Most analysts are looking at $249, but they are missing the forest for the trees.
Cloudflare isn't just protecting websites anymore; it’s the operating system for global AI inference.
The Setup: We are currently consolidating after a massive 3X run from the April 2025 lows.
I’m looking for a reclaim of $215 to confirm the move back to the ATH $260 range.
The Target: If the $5B ARR target is pulled forward by AI demand, a $464 price point represents a realistic 2027/2028 'blue sky' valuation.
Entry: $185 - $195 zone. Invalidation: A weekly close below $168 (200-day SMA).
#NET #Cloudflare #AIStocks #Breakout #TechStocks #CloudComputing

Boeing - Lowering HeightsWe are analyzing the move since November 2025, identifying two main impulses, which can be viewed as a three -wave structure of a larger five -wave move.
At this stage, it’s not critical whether this impulse is considered wave 5 or wave B of a larger move.
Currently, a downward move is expected. The exact corrective type will clarify the structure of the larger move.
Holding altitude above 207 would keep the flight on course and support continuation of the impulsive move.
Main targets:
240
232
225
219
---
Please subscribe and leave a comment!
You’ll get new information faster than anyone else.
---

Coca-Cola - Slowly Moving HigherWe are analyzing the move from March 2020 to the present.
We assume this is the fifth wave of the larger move, and we are currently forming the fifth sub-wave within the fifth wave.
One of the key targets is at the 85 level.
Estimated upside potential from current levels:
Approximately 17%
---
Please subscribe and leave a comment!
You’ll get new information faster than anyone else.
---

United Microelectronics Corp. (UMC) Is Gearing For A BreakoutShares of United Microelectronics Corporation (NYSE; NYSE:UMC ) saw a noteworthy uptick of 15.91% in Tuesday's trading session constricting in a bullish symmetrical triangle. A breakout above the ceiling of the triangle could resort to a bullish continuation pattern.
With RSI at 83, the asset might cool off albeit general market downturn.
Earnings are set for January 28th, 2026.
In recent news, United Microelectronics Corporation (NYSE: UMC; TWSE: 2303) reported unaudited net sales for the month of December 2025.
About UMC
United Microelectronics Corporation operates as a semiconductor wafer foundry in Taiwan, China, Hong Kong, Japan, Korea, the United States, Europe, and internationally. The company manufactures and sells integrated circuits. It offers backend and design support services for mobile and wireless communications, IoT and wearables, computing and data processing, and automotive markets.

SPY WEEKLY 20 JAN 2026Spy weekly is here, feel free to leave a comment if you have any doubt and I will try to revert back asap.
I have analyzed in depth price action here discussing all sectors as well
NOTE:ALWAYS USE SL

CCL - Proceed with CautionAt the end of August 2025, CCL completed its upward move.
Until the end of November, it formed a corrective wave A .
Current Situation:
Since late November, a full five-wave impulsive move upward has developed.
If the first wave is correctly identified, a fast correction is likely next - around 50% of the move, targeting 28 .
As this is wave B , after the correction, the upward move could continue toward 33 or slightly higher.
---
Please subscribe and leave a comment.
You’ll get new information faster than anyone else.
---

Will Verizon (VZ) Extend Higher After This Bullish Pullback?📊 VZ — Bullish Pullback Playbook | NYSE Swing Strategy 🛡️📈
🧠 Market Thesis
VZ (Verizon Communications Inc.) is showing a clean bullish pullback setup supported by:
✔️ Moving Average Pullback Confirmation
✔️ Re-Accumulation Zone Formation
✔️ Buyers regaining strength and stepping back in with momentum
Price behavior shows buyers dominating key levels, keeping the trend constructive and ready for continuation 📈💪
🎯 Entry Plan
🔓 Entry: Any valid price-level confirmation entry based on your strategy.
(Everyone has their own method — trade what fits your risk profile.)
🛑 Stop Loss
⚠️ Stop-Loss: “Thief SL” @ 39.00
(This is a personal reference point only. Not a recommendation — manage risk your way.)
🎯 Target Zone
🚓 Target: “Police force waiting at the Triangular Moving Average Barricade”
— A zone acting as strong resistance, combined with:
Overbought signals
Possible liquidity trap
Sellers waiting to react
📌 TP Level: 43.00
(Again — personal target. Trade responsibly and exit at your comfort level.)
📝 Notes to All Ladies & Gentlemen (Thief OGs)
I am not recommending you follow my SL or TP.
Your money → your rules → your trade → your responsibility 💼📌
This is a thief-style trading narrative made for fun, not financial advice.
🔎 Correlated Assets / Related Pairs to Watch
Keeping an eye on correlated telecom + defensive sector tickers strengthens conviction:
📡 $T (AT&T)
Moves similarly to VZ due to shared telecom sector flows
Similar defensive-sector inflows during risk-off periods
Can confirm or warn about momentum shifts
📶 NASDAQ:TMUS (T-Mobile)
Sometimes inversely reacts when capital rotates between telecom competitors
Relative strength comparison helps spot leadership shifts
🏦 AMEX:XLC (Communication Services ETF)
Sector ETF that often amplifies or confirms directional bias
Watching ETF flows helps validate whether buyers truly control the space
🧲 Key Correlation Notes:
Telecom sector = slow, steady movers with defensive qualities
When VZ, T, and XLC all align → trend continuation signals strengthen
Divergence between these pairs may warn early about losing momentum
🚀📈 Final Thief-Style Summary
We have a confirmed bullish pullback, re-accumulation strength, and a clear resistance barricade for TP planning.
Trade safely, protect profits, and don’t get caught by the “police” at resistance 🚓😂🔥
✨ “If you find value in my analysis, a 👍 and 🚀 boost is much appreciated — it helps me share more setups with the community!”
⚠️ Disclaimer
This is a thief style trading strategy just for fun.
Not a recommendation, not financial advice — purely educational and entertainment-oriented.
#VZ #Verizon #SwingTradeSetup #BullishPullback #TradingPlaybook #StockAnalysis #NYSE #MarketStructure #Reaccumulation #TelecomStocks #XLC #ATT #TMUS #ThiefStyleTrading #RiskManagement #ChartAnalysis #EditorsPickHunt

Lilly - Clean Chart StructureWe are analyzing the move starting from August 2025.
So far, four out of five waves have been drawn.
The structure of the fourth wave is an expanded flat (with measured moves):
A = 134 -> five-wave move (impulse)
B = 156 -> three-wave move
C = 120 -> five-wave move (zigzag, internal impulses ≈60)
The correction appears complete in both structure and proportions.
Similar to the second wave, the fourth wave retraced 0.382 of the prior move.
Even if price dips slightly, the main targets remain unchanged.
Additionally, we seem to have caught the very start of the next move, and the fifth sub-wave should now begin.
Key targets:
1,171
1,263 (aligns with the higher time frame)
or somewhere within this range
The upside potential from the current level is estimated at 14 - 22 %.
---
Please subscribe and leave a comment!
You’ll get new information faster than anyone else.
---
