51Talk Online Education Group ($COE) Set for Earnings Report51Talk Online Education Group (NYSE; AMEX:COE ) is slated to release her earnings results today Monday, December 8, 2025, before market open.
The stock price has increased by +207.76% in the last 52 weeks setting the coast for the $50 resistant that connotes to the 1-month high of the stock. However, to achieve that stunt, the stock has to break the 50% fib retracement level and failure to break that level might resort to consolidation to the 1-month low axis.
News coming in now confirms that the company has announced the earnings report.
The company today announced that its board of directors has authorized a new share repurchase program under which the Company may repurchase up to US$10 million worth of its shares (including American Depositary Shares) over the next 12 months, ending on December 7, 2026.
The share repurchases may be effected from time to time on the open market at prevailing market prices, in privately negotiated transactions, in block trades and/or through other legally permissible means, depending on market conditions, and will be implemented in accordance with applicable rules and regulations. The Company expects to fund the repurchases out of its existing cash balance.
Financial Performance
In 2024, COE's revenue was $50.69 million, an increase of 86.98% compared to the previous year's $27.11 million. Losses were -$7.24 million, -51.87% less than in 2023.
About COE
51Talk Online Education Group, through its subsidiaries, engages in providing online education platform with English language education services to students in the People's Republic of China, Hong Kong, the Philippines, Singapore, Malaysia, and Thailand.
Nysession

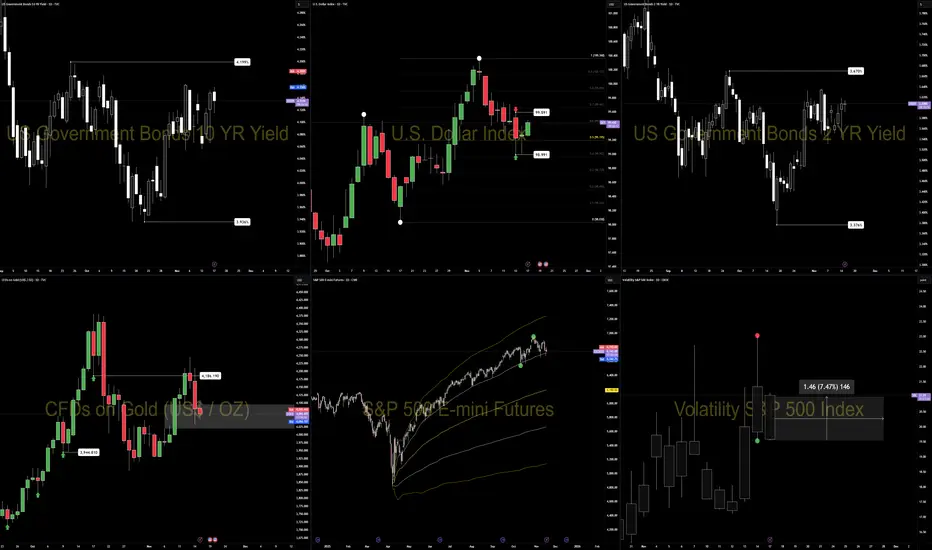
PRE-NY CONDITIONS — 17 November 2025New York inherits a defensive London session: steady Dollar, firm short-end yields, weaker equities, and rising volatility.
1. Market Environment (London → NY Transition)
Dollar:
DXY holds mid-range near 99.40. No shift in macro tone during London.
Yields:
US10Y near 4.15%, US2Y near 3.60%. Both stayed contained inside narrow ranges — policy tone unchanged.
Risk Tone:
ES weakened through London. Volatility elevated. Global tone remains cautious.
Liquidity:
Thinner into NY as VIX climbs and equities soften.
Quick Insight:
Stable 2Y = stable policy tone.
Rising VIX = cautious liquidity.
2. Six-Chart Snapshot (Operator View)
DXY:
Mid-range (98.991–99.981), inside-bar structure. No bias until a break.
US10Y:
Range-bound. Today’s move sits inside a 1.03% range.
US2Y:
Up 0.64% on low volume — quiet policy tone, data-waiting behavior.
ES:
Bearish through London with clear rotation lower into NY.
Gold:
Lower inside daily imbalance. Down 1.46% — weak safety demand.
VIX:
Up 7.47% — rising volatility regime.
3. Cross-Asset Signals
Yields:
Stable long-end + firm short-end → Dollar supported.
Equities:
ES weakness maintains defensive tone.
Gold:
Lower → no significant safety bid.
Volatility:
Higher VIX → cautious liquidity and reactive flows.
Global Risk:
Neutral-to-defensive.
4. Core Drivers for NY
• Dollar reaction inside the inside-bar range
• Short-end yield firmness (2Y)
• ES tone post-NY open
• VIX regime (expanding vs contained)
• Yield alignment (10Y + 2Y)
5. Execution Notes — CORE5 PEM
Follow higher-timeframe direction
Ignore noise from earlier sessions
Wait for structure + flow alignment
Act only on confirmation
One-Line Summary
NY opens into a defensive setup: steady Dollar, firm yields, weak equities, and rising volatility.
— CORE5DAN
Institutional Logic. Modern Technology. Real Freedom.
BTCUSD — RangeBTCUSD — Range Dilemma
🧭 Context
BTC attacked the daily volume low at 106 463.30 — precise hit, clean reaction, but no reclaim yet.
Price stalled under that zone through NY session, keeping structure heavy while the dollar impulse held firm.
The move reflects a controlled liquidity sweep, not yet a shift in intent.
📈 Technical POV
We’re parked at the 106 463.30 daily volume node, the structural hinge of the current range.
A close below confirms algorithms pressing the next leg lower.
If we reclaim and hold above, the path opens toward 111 629, the next liquidity magnet capped by a single-print zone.
Daily structure remains stretched; weekly bias still corrective.
🌍 Macro View
Dollar strength persists after the Fed’s “pause for now” tone and steady 4 % yields.
Global risk tone stays cautious — crypto remains reactive, not leading.
Until DXY cools off, BTC trades inside compression with limited directional clarity.
🎯 Plan
Patience first.
Wait for a 1-hour structure shift to confirm bias.
If the dollar corrects, BTC can rotate higher; if not, expect continued testing near the lows.
🧠 CORE5 Note
Professionals don’t chase noise.
They let structure prove strength before conviction follows.
Institutional Logic. Modern Technology. Real Freedom.

Fiserv, Inc. (NYSE: $FI) Tanks 45% Amidst Earnings Report Fiserv, Inc. (NYSE: NYSE:FI ) stock took a nosedive in early Wednesday market open losing roughly 50% With selling pressure increasing, the asset is already oversold as seen by the RSI at 13- this is really oversold.
However, we are expecting a bounced off from the $60 support point once buyers dominate the market buying pressure will increase.
In another news, Fiserv (FI.N), lowered its annual earnings forecasts for the second straight quarter on Wednesday and announced an overhaul of its senior leadership as the payments firm grapples with slowing growth.
Analysts and investors had been skeptical of Fiserv's ability to meet its full-year merchant business forecast, given the acceleration needed in the second half of the year.
About FI
Fiserv, Inc. provides payments and financial services technology solutions in the United States, Europe, the Middle East and Africa, Latin America, the Asia-Pacific, and internationally. It operates through the Merchant Solutions and Financial Solutions segments. The company provides merchant acquiring and digital commerce services, mobile payment services, security and fraud protection solutions,.

BTCUSD — Mind Games at the Range Low Pre Ny Session
🧭 Context
Bitcoin is testing the range low at 112.885, holding just above despite multiple wicks below.
Price hasn’t closed beneath structure — and until the 4H confirms, it’s still a game of perception, not breakdown.
Don’t mistake volatility for intent.
Price can sweep liquidity behind higher-timeframe wicks without flipping bias.
As long as the 4H structure holds, the map remains bullish within the 112.885–116.077 range.
🔹Technical Frame
Range intact: 112.885–116.077
4H close below 112.800 = structural shift
Volume stable, delta neutral — no confirmation of breakdown
Possible liquidity sweep event around macro news
Focus zone: 113.200–114.000 for reactive setups
💡Macro Note
With today’s data on deck, short-term volatility spikes are expected.
Let the reaction confirm direction — not emotion.
This phase is designed to shake conviction, not reward it.
Institutional Logic. Modern Technology. Real Freedom.

Bloom Energy Corporation ($BE) Spike 14% Amidst Earnings Beat The price of Bloom Energy Corporation (NYSE: NYSE:BE ) saw a noteworthy uptick of 14% in early market trading as the asset reported earnings result yesternight after market close.
The stock is gearing a move to the $140 resistant point albeit present market conditions. With the last recorded RSI at 63 NYSE:BE might spike 50% to claim to the $140 resistant
Third Quarter Highlights
Revenue of $519.0 million in the third quarter of 2025, an increase of 57.1% compared to $330.4 million in the third quarter of 2024. Product and service revenue of $442.9 million in the third quarter of 2025, an increase of 55.7% compared to $284.5 million in the third quarter of 2024.
Gross margin of 29.2% in the third quarter of 2025, an increase of 5.4 percentage points compared to 23.8% in the third quarter of 2024; non-GAAP gross margin of 30.4% in the third quarter of 2025, an increase of 5.1 percentage points compared to 25.2% in the third quarter of 2024.
Operating income of $7.8 million in the third quarter of 2025, an improvement of $17.5 million compared to operating loss of $9.7 million in the third quarter of 2024; non-GAAP operating income of $46.2 million in the third quarter of 2025, an increase of $38.1 million compared to $8.1 million in the third quarter of 2024.
$5 billion strategic AI infrastructure partnership with Brookfield Asset Management.

US30 - Intraday Playbook for NY Session 27/10/2025Here’s my structured 15M game plan heading into the US session today. We’re currently sitting inside a bullish trend, but we’re also at a point where price could either continue higher or shift momentum if key demand levels fail. So I’m prepared for both bullish continuation and a possible bearish reversal scenario.
✅ Overall Trend Context:
Higher highs / higher lows remain intact on the 4H / 1H.
Recent bullish leg may need a liquidity sweep / pullback before continuation.
Key intraday structure levels are now clearly defined.
📈 Bullish Continuation Scenario (Primary Bias)
I’ll look for long setups if price pulls back into demand zones and shows bullish rejection.
⚠️ Valid only while price holds above 47,200.
✅ Long Zone #1: 47,300 – 47,350 (first demand / shallow pullback zone)
✅ Long Zone #2: 47,150 – 47,200 (deeper liquidity pool)
Bullish Confirmation Triggers (15M or 5M):
Rejection wick from demand
Bullish engulfing / candle flip
Break of minor 5M structure after tap
🎯 Bullish Targets:
TP1: 47,450 (reaction zone)
TP2: 47,500 – previous high
TP3: 47,600+ if momentum extends
📉 Bearish Reversal Scenario (Alternate Plan)
I will only shift bearish if price breaks below the key higher-low level.
🔻 Bearish bias becomes active if we break & hold below 47,200.
✅ Plan: Wait for a break → retest of 47,200 – 47,250 as resistance → look for rejection
(5M / 15M bearish engulfing, failed reclaim, or lower high confirmation)
🎯 Bearish Targets:
TP1: 47,050 – first liquidity pocket
TP2: 46,900 – prior swing low / demand zone
TP3: 46,750 – deeper structural support
📍 Key Notes
✅ I won’t chase anything at market open — I’ll wait for liquidity grab and confirmation.
❌ No longs if 47,200 breaks decisively and turns into resistance.
❌ No shorts while above 47,200 unless a clear fakeout rejection occurs at 47,500.

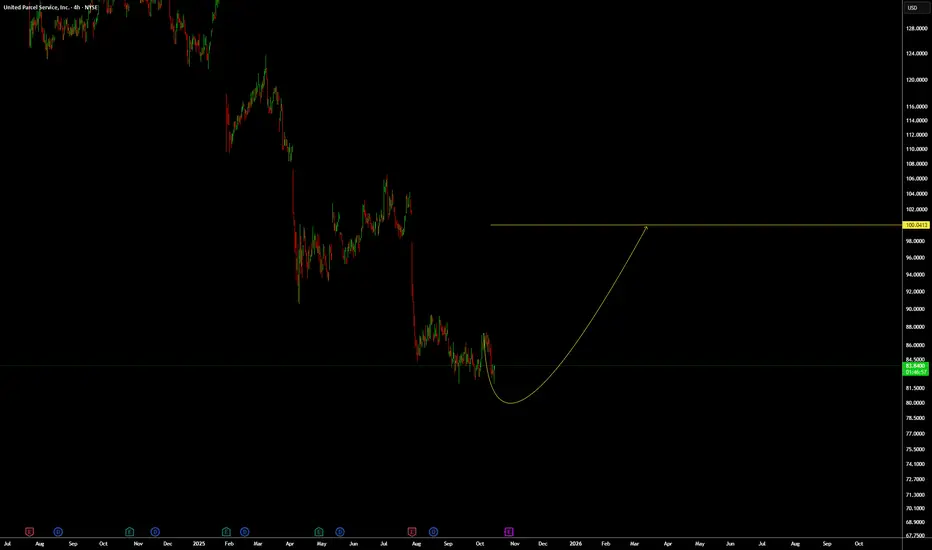
UPS: Should go up to 100 level.Based on WTW Concept and from a technical point of view, we will look for buy setups on NYSE:UPS it is ready to go up even if it will go a bit more lower.
We Trade Waves
WTW Team
Disclosure: We are part of Trade Nation's Influencer program and receive a monthly fee for using their TradingView charts in our analysis.
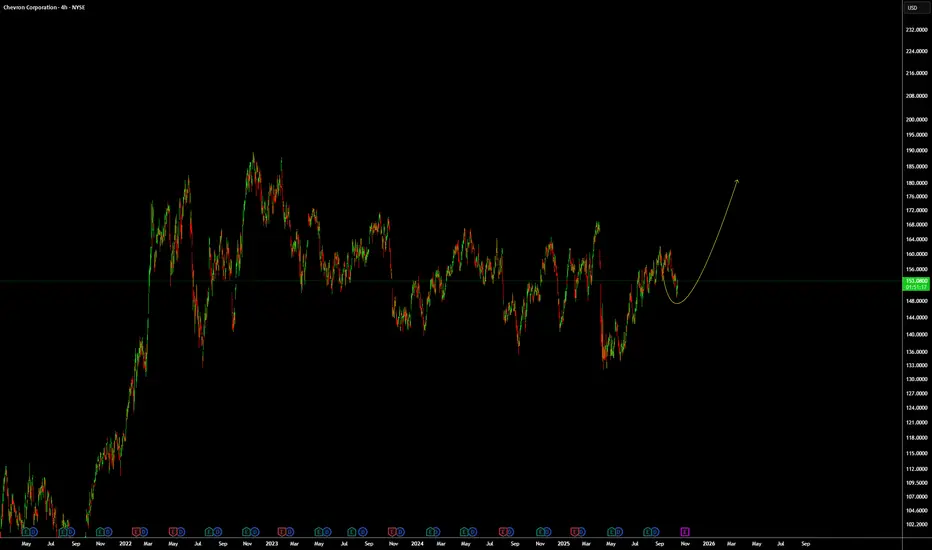
CVX: Looking for an up move/wave.From a technical point of view and based on WTW Concept, NYSE:CVX looks like it will go up.
We Trade Waves
WTW Team
Disclosure: We are part of Trade Nation's Influencer program and receive a monthly fee for using their TradingView charts in our analysis.
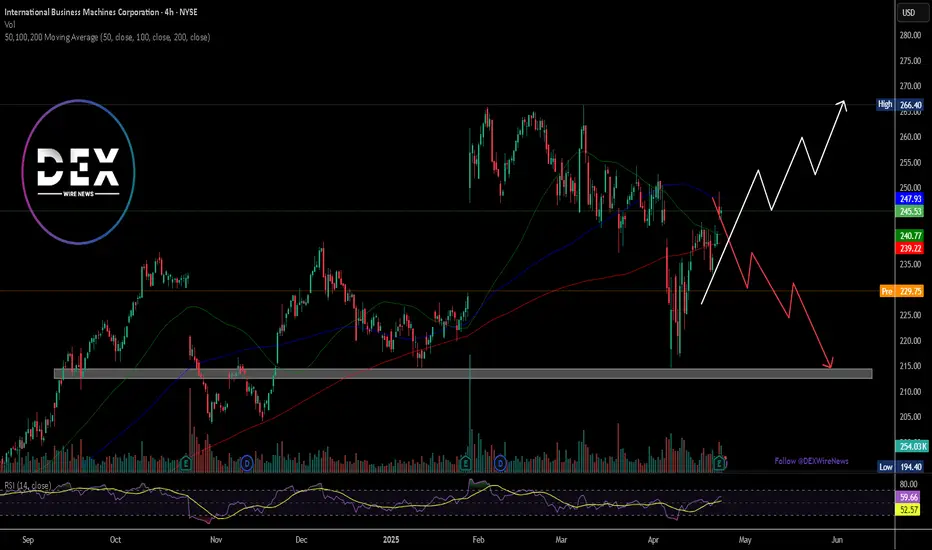
Breaking: International Business Machine (NYSE: $IBM) Tanks 6% International Business Machine Corporation, (NYSE: NYSE:IBM ) together with its subsidiaries, provides integrated solutions and services in the United States, Europe, the Middle East, Africa, Asia Pacific, and internationally Plummets 6% in early premarket trading on Thursday albeit reporting better-than-expected earnings and revenue for the first quarter on Wednesday.
Earnings Overview
a. Earnings per share: $1.60 adjusted vs. $1.40 expected
b. Revenue: $14.54 billion vs. $14.4 billion expected
Revenue increased 0.6% in the quarter from $14.5 billion a year earlier, according to a statement. Net income slid to $1.06 billion, or $1.12 per share, from $1.61 billion, or $1.72 per share, in the same quarter a year ago.
For 2025, IBM reiterated its expectation for $13.5 billion in free cash flow and at least 5% revenue growth at constant currency. At current exchange rates, currency will provide 150 basis points of benefit for 2025 growth, down from the company’s forecast of 200 basis points in January.
IBM has been an outperformer this year as the broader market has sold off due largely to concerns around President Donald Trump’s tariffs and their potential impact on the economy. As of Wednesday’s close, IBM shares were up 11%, while the Nasdaq was down almost 14%.
The stock slipped 6% in extended trading on Wednesday, extending the loss to Thursday's premarket session. NYSE:IBM shares need to break pass the $266 resistant to negate any bearish barriers. Failure to break pass this level could resort to consolidatory move to the $216 support point.
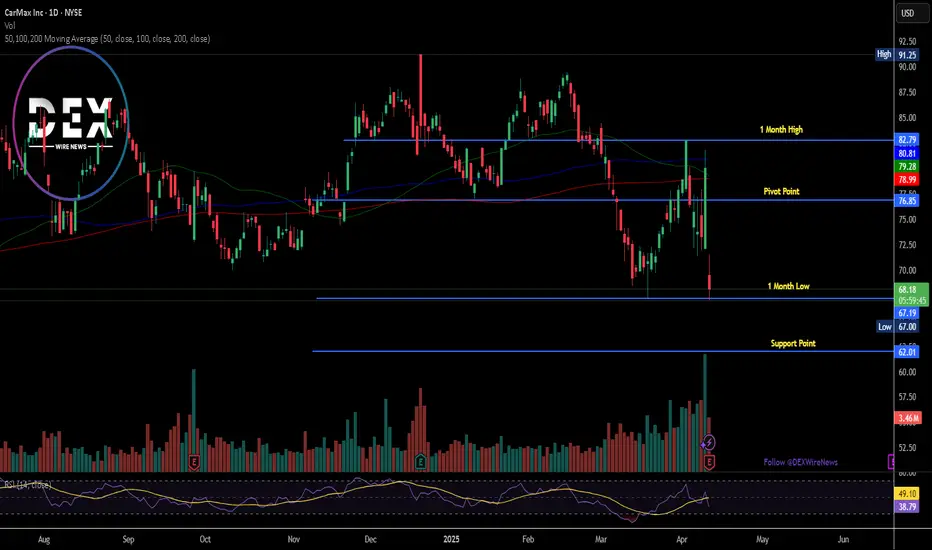
Breaking: CarMax, Inc. (NYSE: KMX) Shares Down Nearly 15% TodayShares of CarMax, Inc. (NYSE: KMX) tanked nearly 15% today amidst missing Fourth Quarter Profit expectation.
CarMax (KMX) shares dropped in premarket trading Thursday after the used-car retailer's fiscal fourth-quarter profit and used-vehicle sales came in below analysts' expectations.1
The Virginia-based company reported earnings per share (EPS) of $0.58 on net sales and operating revenue of $6.00 billion, both up from $0.32 and $5.63 billion a year ago.2 Analysts polled by Visible Alpha projected $0.68 and $5.99 billion, respectively.
CarMax sold a total of 301,811 used vehicles, including 182,655 retail and 119,156 wholesale units, each below consensus. Analysts were looking for 312,800 units of combined sales, consisting of 185,900 retail and 126,900 wholesale vehicles.
A year ago, CarMax said it expected to reach 2 million annual vehicle sales between fiscal 2026 and 2030. It said that before it reached that unit figure, it expected annual revenue to reach $33 billion and market share of up to 10-year-old used vehicles to hit 5%.
Analysts have said both new and used cars are likely to become thousands of dollars more expensive as a result of the Trump administration's tariffs.
CarMax shares, which entered Thursday down 4% over the past 12 months, were down 8% immediately after the report. Last quarter, the stock surged as CEO Bill Nash said the better-than-expected results were helped by "a more stable environment for vehicle valuations.
Breaking: Walmart Set To Report Earnings Before the BellWalmart will report fiscal fourth-quarter earnings before the bell on Thursday.
Walmart (NYSE: NYSE:WMT ) will report its latest quarterly earnings before the bell on Thursday, as investors try to parse whether softer retail sales in January were a blip or a bigger warning sign.
As Walmart (NYSE: NYSE:WMT ) is the top grocer in the U.S., investors often view it as a pivot of consumer health. The company will report its holiday-season results and is expected to give a forecast for the year ahead. Its leaders may also preview how they see the economic backdrop in the U.S. and weigh in on the potential effect of federal policy decisions, such as tariffs.
According to a survey of analysts by LSEG, here’s what Wall Street expects for the big-box retailer’s fiscal fourth quarter,:
Earnings per share: 64 cents
Revenue: $180.01 billion
Retail sales for January came in weaker than expected, setting off alarm bells for some investors. The metric dropped 0.9% for the month, which was below the Dow Jones estimate for a 0.2% decline.
Holiday data came in strong across the retail industry, as sales rose 3.8% year over year to total $964.4 billion in November and December, according to the National Retail Federation. The trend reflected a return to more typical pre-pandemic gains. Average sales growth during the holiday season was 3.6% from 2010 to 2019, according to NRF data, but shot up during the Covid-19 pandemic.
Some unique factors could work in Walmart’s favor, regardless of the economic backdrop. The big-box retailer’s online sales have been climbing, with 10 straight quarters of double-digit gains. Its advertising business and third-party marketplace are small compared to Amazon’s, but the segments have posted gains and driven higher margins than Walmart’s retail business.
Furthermore, Walmart has attracted more customers with higher incomes. Walmart CEO Doug McMillon said in November that households earning more than $100,000 drove 75% of market share gains in the third quarter.
Simeon Gutman, a retail analyst for Morgan Stanley, raised Walmart’s price target to $153 on Tuesday, pointing to the retailer’s newer and more profitable moneymakers including its advertising business and subscription-based membership program Walmart+.
Technical Outlook
As of Wednesday’s close, shares of Walmart are up about 83% over the past year. Shares closed on Wednesday at $104.00, up about 15% so far this year and outpacing the approximately 4% gains of the S&P 500 during the same period.
As of the time of writing, NYSE:WMT is trading down 0.54% on Thursday's premarket trading. NYSE:WMT ' shares has an RSI of 70 which is somewhat oversold but it hints at a potential bullish surge amidst a falling wedge pattern and as traders awaits earnings reports, a positive earnings beat could send NYSE:WMT on a bullish spree similarly, should selling pressure surmount, the 38.2% Fibonacci retracement level is serving as support point for Walmart shares (NYSE: NYSE:WMT )

NIO Inc Falls Hard! All Targets Hit in 15-Minute Short TradeTechnical Analysis: NIO Inc – 15-Minute Timeframe (Short Trade)
NIO Inc presented a strong short trade opportunity, with an entry at 6.76. The price has reached all profit targets, confirming the strength of the bearish trend.
Key Levels
Entry: 6.76 – The short trade was initiated at this level after a clear bearish signal.
Stop-Loss (SL): 6.83 – Positioned above resistance to guard against potential reversals.
Take Profit 1 (TP1): 6.68 – The first target was reached, confirming the initial bearish momentum.
Take Profit 2 (TP2): 6.54 – Continued downside pressure pushed the price to this level.
Take Profit 3 (TP3): 6.41 – The bearish momentum carried the price to this target.
Take Profit 4 (TP4): 6.32 – The final profit target, marking a successful and complete trade.
Trend Analysis
The price remained well below the Risological Dotted trendline, affirming the strength of the bearish trend. The steady selling pressure helped achieve all targets, indicating strong downward momentum in favor of sellers.
The short trade on NIO Inc has concluded successfully, hitting all targets, with the final target at 6.32. The clear downtrend and guidance from the Risological Dotted trendline ensured a profitable trade.

WTI Crude Oil USOUSD LongIn my humble opinion, the worst seems to be over for oil.
Trading Idea: After analyzing multiple sessions, I noticed how well the price has absorbed the recent drop, reclaiming the liquidity distribution from last month. There’s no strong indication of further downside. The Asian session has brought it into a solid accumulation range. I’m looking for an entry within the lower zone, aligned with a 15-minute FVG.
Trade Management: Once the rally begins, I plan to take partial profits (40%) at yesterday’s NY session high, and let the remaining position run toward the swing high. I’m targeting a rally up to the $73 area, but will wait for additional high-probability confirmations as the rally unfolds.
Risk: 0.50%
R/R: 6.78

WTI LongSeeing that WTI has held steady at the 4h FVG I decided to open a long up to the point of interest where the intermediate high is at 15min.
Risk: 1%.
Trade management: I will take partial profit (60%) at the first swing high.

EUR USD IdeaWe are still in a bullish range, and London is currently driving us down into discount territory. Our preferred scenario is to see a bullish reversal. We’re waiting for the price to dip below 1.09090, knock out stops, and from there, we’ll look for bullish scalp trades.
With news events incoming, we’re cutting our risk in half. Remember, it’s crucial to wait for a market shift before committing to a trade. It’s always better to approach the market with an "if this, then that" strategy rather than simply ''i guess it will Go'' . Lets see how it plays out in NY session.

EUR USD UpdateToday, we finally saw some volume return to the charts, allowing us to hit our first bullback target. We entered with a bullish scalp and are currently cruising along. While I'm not entirely sure if the market has fully rotated to a bullish stance yet, it’s Thursday, so we’re definitely taking some profits after three days of monitoring.
We’ll leave a runner in case the move really takes off. Let’s see how the daily candle closes before making further decisions. We’ll keep you posted on our thoughts and actions. Stay sharp, and enjoy the ride.

EUR USD UpdateOn EUR/USD, major fundamental news is behind us for this week. Currently, the market stands at premium prices, which means no long trades for us at the moment. The crucial level in our current range is the 1.08736 area, known for single prints, indicating a heavy buying area with only offered buys. From an algorithmic standpoint, this level is typically filled 80% of the time and often elicits a significant reaction.
While this doesn't necessarily signal a market rotation, it's worth keeping an eye on. We also use imbalances as scalping targets, but we missed that trade and are on standby this week. There's nothing to offer you guys right now.
Remember, 90% of traders lose money because good trades are only available 10% of the time. We’ll reassess the market tomorrow around the NY session.
Stay patient and let's stay sharp.

ICT Longsetup AUDCHF👋Hello Traders,
Our 🖥️ AI system detected that there is an H1 or higher timeframe ICT Long setup in
AUDCHF for session trade (a couple of hours)
Weekly chart is in down trend!! So that you couid wait for a reversal to downside as a Swing Short trade after this upward pulse alternatively!
Please refer to the details Stop loss, FVG(Buy Zone),open for take profit.
For more ideas, you are welcome to visit our profile in tradingview.
Have a good day!
Please give this post a like if you like this kind of simple idea, your feedback will bring our signal to next better level, thanks for support!

BEERUSDT | Another Bullish Scenario 🍻 Market Context
Another bullish setup brewing today before the NY session kicks in! Yesterday, I missed the trend with TAIKO, but today I'm feeling much more confident with BEERUSDT—after all, who doesn’t like beer? 😜
Trade Setup
Similar to yesterday's scenario, but today we have more confirmation on higher timeframes, making this setup even more enticing.
Strategy
The target price (TP) will be set later, depending on the price action’s push up or down. Stay tuned for updates!
Let’s raise a glass and see how this trade plays out!

Buy Side Momentum This Morning On DE30, Possible 50 points m#DE30EUR
Buy Side Momentum This Morning On DE30, Possible 50 points mve,
Scalp Setup till Ny Session GMT London time

ICT Kill Zones Time Asia London New YorkIn the fast-paced world of forex trading, timing is everything. While the forex market operates 24 hours a day, not all hours offer the same trading opportunities. That’s where ICT Kill Zones Times come into play. Forex kill zones are the time when high probability trading setup formed
These strategic time frames can open up a world of possibilities for traders who know how to leverage them. In this post, we’ll explore the concept of ICT Kill Zones ‘ times and how they can lead to high-probability trade setups and potential profits.
The ICT Asian Kill Zone Times: The Dawn of Opportunities
The Asian Kill Zone is the first of the strategic periods in the forex market. It is particularly relevant for traders dealing with the Australian dollar, New Zealand dollar, and Japanese yen pairs, as these markets are most active during this time.
What makes the Asian Kill Zone special is its volatility, driven by economic news releases that occur during this session. Traders who keep an eye on these news releases and their impact on the market can make the most of this period.
Main Characteristics of Asian Kill Zone
-During the Asian Kill Zone, traders can often find optimal trade entry patterns, offering potential gains of 15 to 20 pips for scalp trades.
-NZD, and JPY pairs are ideal for this time of the day.
-The Asian Open can sometimes set up an Optimal Trade Entry Pattern that can offer a 15 – 20 pip scalp.
-The Higher frame bias is helpful here – but short-term retracements in either Bull or Bear
-Markets can offer similar OTE Setups.
Asian Kill Zone Time
ICT Asian Kill Zone Times lies in between 8:00 PM Eastern to10:00 PM Eastern
ICT London Kill Zone Time
The ICT London Kill Zone takes center stage during the London trading session, witnessing the highest volume of order execution compared to other sessions. It is an opportune time for those trading the EUR and GBP pairs. Notably, the London Open often presents opportunities for traders to enter positions with the potential for gains ranging from 25 to 50 pips.
Main Characteristics of London Kill Zone
One of the distinctive characteristics of the London Kill Zone is its tendency to create the low of the day in bullish markets and the high of the day in bearish markets.
Time of ICT London Kill Zone
London Kill Zone of ICT lies between 2:00 AM to 5:00 AM Eastern Time
Traders should monitor the key times between 2:00 AM to 5:00 AM New York time to capitalize on the price action during the London session.
The New York Kill Zone Time: The Land of Opportunities
For traders dealing with major pairs coupled with the dollar index, the New York Kill Zone is an essential timeframe to watch.
Similar to other Kill Zones, this period often sets up optimal trade entry patterns, providing potential gains of 20 to 30 pips for scalp trades.
Time of New York Kill Zone
The New York Kill Zone occurs between 8:00 AM to 11:00 AM Eastern Time. This time is favorable for major pairs and benefits from the overlap with the London session, making it a golden opportunity for traders.
New York Kill Zone lies between 8:00 AM to 1:00 AM Eastern Time
The London Close Kill Zone: The Final Countdown
The London Close Kill Zone is a specific time frame that can create continuation points for swings that extend well into New York afternoon hours. It’s the last chance for traders to make their moves before the market closes for the day, making accurate predictions during this period potentially profitable.
Between approximately 8:00 AM to 9:00 AM Eastern Time (adjusted for daylight savings) , traders can find optimal trade entry patterns, offering opportunities for 10 to 20 pips of profit on scalp trades. Monitoring the key times from 10:00 AM to Noon NY time can yield valuable insights during the London Close Kill Zone.
ICT Kill Zone on During Daylight Saving Time (DST)
Now, let’s talk about Daylight Saving Time (DST), which starts on the second Sunday in March and ends on the first Sunday in November. During this period, Eastern Time is shifted one hour ahead to Eastern Daylight Time (EDT), which is UTC-4.
For example, let’s consider April 10th, and the time is 11:30 AM in Eastern Time (ET) during Daylight Saving Time. To convert this to Coordinated Universal Time (UTC), you add 4 hours to the local time:
11:30 AM ET (UTC-4) + 4 hours = 3:30 PM UTC
During Daylight Saving Time, the clocks are adjusted forward by one hour, giving us an extra hour of daylight in the evenings. When Daylight Saving Time ends, we set the clocks back by one hour to return to Eastern Standard Time.
ICT Kill Zone Setting on Trading View
On the TradingView chart, you’ll find the time zone option at the bottom right corner. To set the correct time zone, click on it, and choose “UTC-5” during regular days (Standard Time) and “UTC-4” during daylight saving time, which typically occurs from the second Sunday in March to the first Sunday in November.
ICT Kill Zones Indicator Trading view & MT4
A number of indicator are available on the trading view that automatically highlights the ICT kill zones on your chart.
ICT Kill Zone LuxAlgo is one of the best indicators available on trading view.
To Add ICT Kill Zone indicator you adopt the following steps:
Step1:Click on the indicator icon on top of the trading view
Step2 write LuxAlgo ICT Kill Zone
Understanding and effectively utilizing ICT Kill Zones can significantly enhance a trader’s success in the forex market. Each Kill Zone represents a unique opportunity with its own set of potential gains.

EURUSD SELL UNTIL 1.0850Forex EURUSD SEll now until 1.0850 TP Solid Sell
do not Overtrade
do not Over leverage
Be Patient
Stay Profitable
CAFE CITY STUDIO Avaliable 2024
OANDA:EURUSD
