Market Analysis: WTI Crude Oil Faces HurdlesMarket Analysis: WTI Crude Oil Faces Hurdles
Crude oil is showing bearish signs and might decline below $62.80.
Important Takeaways for WTI Crude Oil Price Analysis Today
- Crude oil prices failed to clear the $65.00 region and started a fresh decline.
- There was a break below a major bullish trend line with support at $64.00 on the hourly chart of XTI/USD.
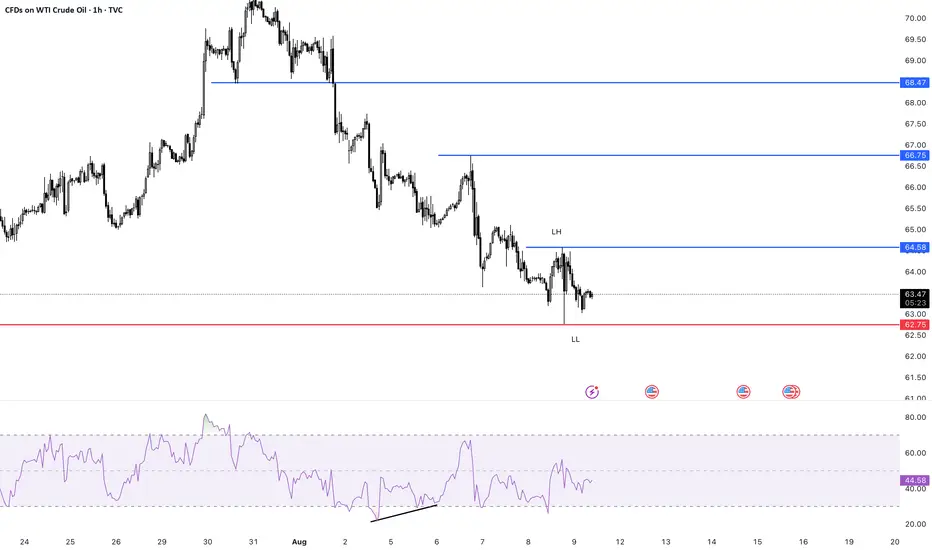
WTI Crude Oil Price Technical Analysis
On the hourly chart of WTI Crude Oil, the price struggled to clear the $65.00 level and started a fresh decline below $64.50.
There was a break below a major bullish trend line at $64.00, opening the doors for more losses. The price dipped below the 50% Fib retracement level of the upward move from the $61.56 swing low to the $64.85 high.
XTI/USD even dipped below $63.50 level and the 50-hour simple moving average. The bulls are now active near $63.00. If there is a fresh increase, it could face a barrier near $63.70.
The first major resistance is near $64.10. Any more gains might send the price toward $64.85 and call for a test of $65.50. Conversely, the price might continue to move down and revisit the $62.80 support and the 61.8% Fib retracement.
The next major support on the WTI crude oil chart is $62.35. If there is a downside break, the price might decline toward $61.55. Any more losses may perhaps open the doors for a move toward $60.50.
This article represents the opinion of the Companies operating under the FXOpen brand only. It is not to be construed as an offer, solicitation, or recommendation with respect to products and services provided by the Companies operating under the FXOpen brand, nor is it to be considered financial advice.
Oil

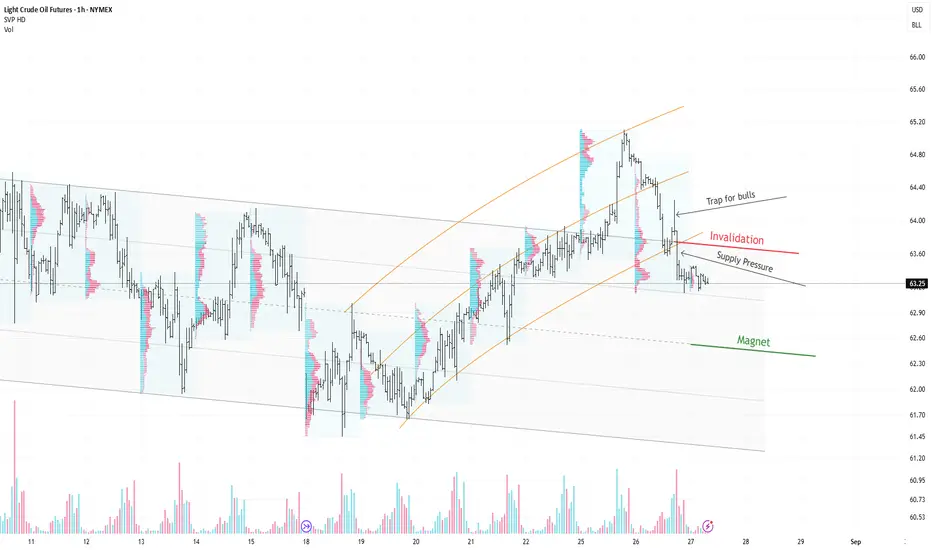
CL1! — Bearish: back inside the descending channel, watching theThesis (1h):
Price had been sliding within a broad descending channel (grey). The counter-trend recovery shaped a rising channel (orange). Yesterday’s attempt to resume the advance from the lower orange boundary failed and turned into a bull trap; sellers pushed price back inside the grey channel. Bears confirmed control at the red line (resistance/retest).
Map:
Clear supply pressure after the failed bounce.
While price stays below the red line, the base case is a drift toward the channel median (the “magnet”).
A momentum extension could target the lower band later; not the main case yet.
Invalidation:
Sustained acceptance back above the red line and into the orange channel would neutralize the bearish read.
Educational only. Not financial advice.
USOIL Bearish Reversal & Selling OpportunityUSOIL (WTI Crude Oil) – Bearish Setup Analysis
The chart shows a clear bearish structure with multiple confirmations:
Trendline Rejection & Break: Price rejected from the upper rejection line and later broke the rising trendline, confirming bearish momentum.
FVG (Fair Value Gap) Selling Zone: Price retested the imbalance zone (63.53–63.94), creating a strong selling opportunity.
EMA Confluence: Both the 70 EMA and 200 EMA are above the price, acting as dynamic resistance, supporting bearish bias.
Market Structure Shift (MSS): Breakdown of higher lows signals shift to bearish structure.
Target: Downside continuation expected towards 61.65, the next liquidity and support zone.
Stop Loss: Above 63.94 (selling zone invalidation).
📉 Strategy: Look for sell entries around 63.53–63.94 zone, with target at 61.65 and stop loss above 63.94.

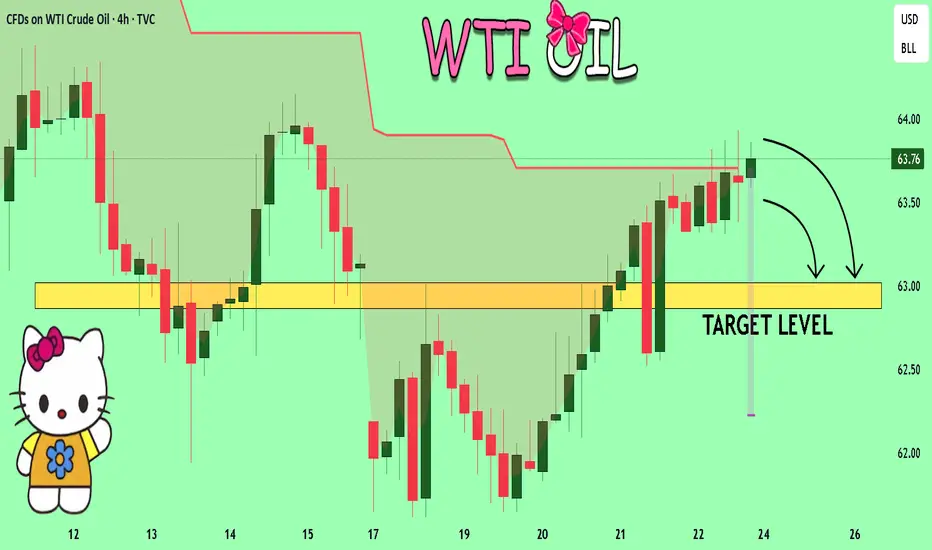
USOIL - OutlookAreas of interest marked on 4H.
If price drops to the discount zone, always wait for confirmation as it could go either way. (Momentum is our friend)
Avoid yellow zone.
Red zone speaks for itself, we do have EIA inventory data releasing later tonight. I would keep an eye on that for incoming volatility.
NFA

OUR TRADE ON OIL FOR TODAYToday we went long on OIL after that the market grabbed a liquidity and gave us our entry point to take.
The market went straight to our target which was again a liquidity level, then it came lower.
I couldn't share the trade today since when we entered I was in a live trading session with my students.
Follow for more!

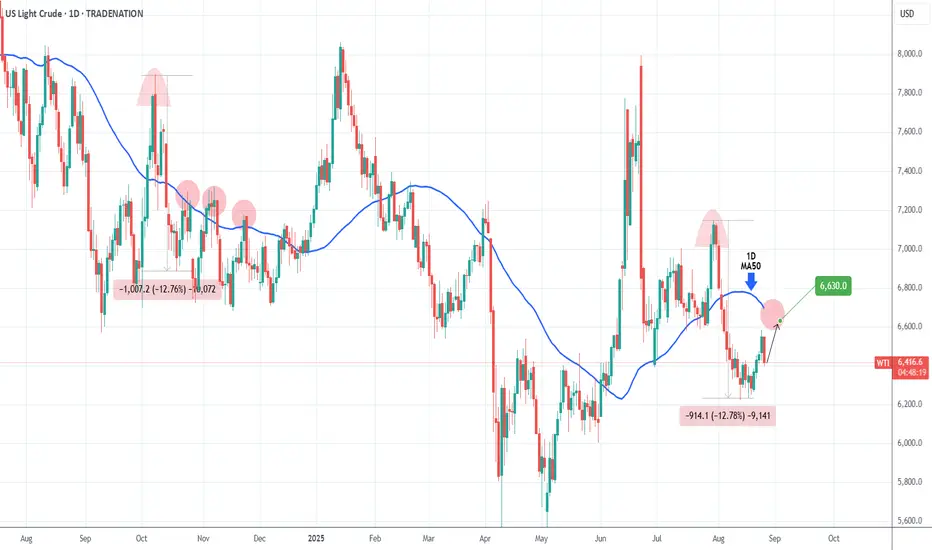
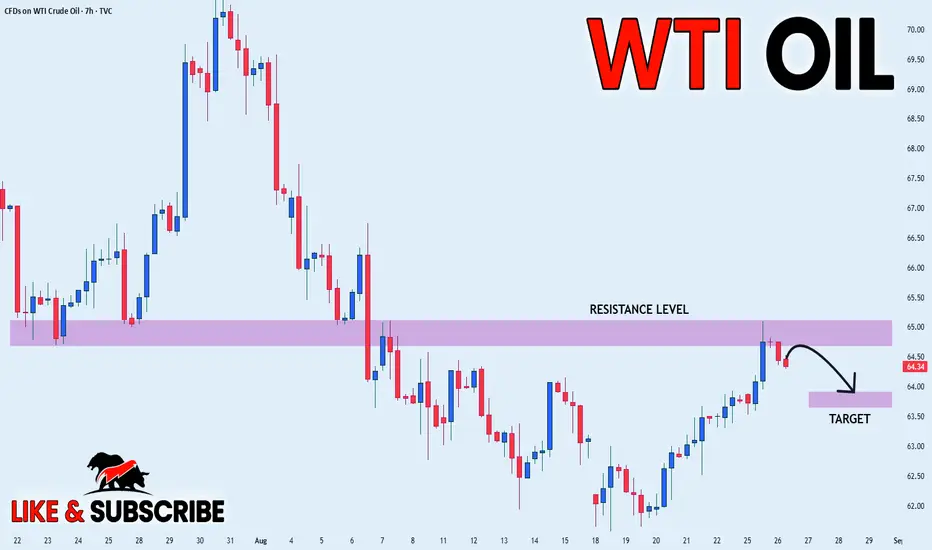
WTI OIL technically more chances to test the 1D MA50. Buy.Last week (August 20, see chart below) we issued a bullish break-out signal on WTI Oil (USOIL) that reached our $65.60 Target within 3 days:
This time we get a new buy signal, despite today's sharp pull-back. The -12.78% decline since the July 30 rejection, resembles the one since the October 08 2024 High.
This rebounded to just above the 1D MA50 (blue trend-line) to form a new Lower High and get rejected again.
As a result, our immediate short-term Target is $66.30.
-------------------------------------------------------------------------------
** Please LIKE 👍, FOLLOW ✅, SHARE 🙌 and COMMENT ✍ if you enjoy this idea! Also share your ideas and charts in the comments section below! This is best way to keep it relevant, support us, keep the content here free and allow the idea to reach as many people as possible. **
-------------------------------------------------------------------------------
Disclosure: I am part of Trade Nation's Influencer program and receive a monthly fee for using their TradingView charts in my analysis.
💸💸💸💸💸💸
👇 👇 👇 👇 👇 👇
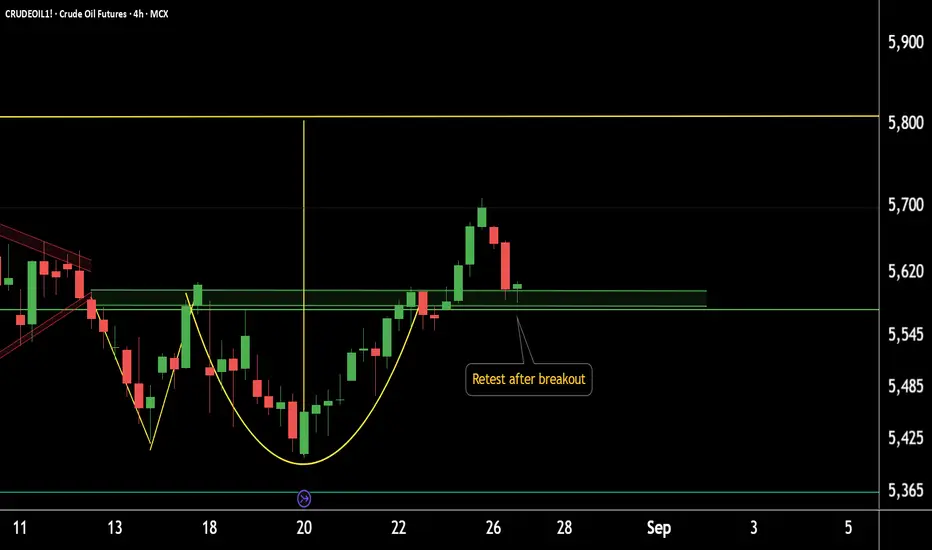
CRUDEOIL1! breakout + support confirmation=potential upside move4-Hour Chart Update: CRUDEOIL1!
CRUDEOIL1! has retested the breakout zone at 5580–5600.
If this level sustains, we may see higher prices ahead in CRUDEOIL1!.
Thank you!
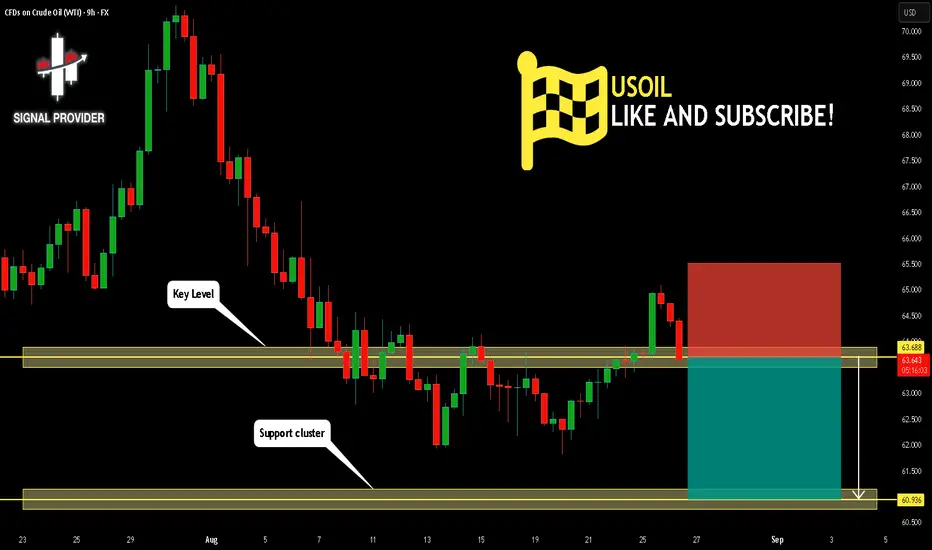
USOIL Is Bearish! Short!
Take a look at our analysis for USOIL.
Time Frame: 9h
Current Trend: Bearish
Sentiment: Overbought (based on 7-period RSI)
Forecast: Bearish
The price is testing a key resistance 63.688.
Taking into consideration the current market trend & overbought RSI, chances will be high to see a bearish movement to the downside at least to 60.936 level.
P.S
The term oversold refers to a condition where an asset has traded lower in price and has the potential for a price bounce.
Overbought refers to market scenarios where the instrument is traded considerably higher than its fair value. Overvaluation is caused by market sentiments when there is positive news.
Disclosure: I am part of Trade Nation's Influencer program and receive a monthly fee for using their TradingView charts in my analysis.
Like and subscribe and comment my ideas if you enjoy them!
CRUDE OIL SHORT FROM RESISTANCE|
✅CRUDE OIL has retested a key resistance level of 65.10$
And as the price is already making a bearish pullback
A move down to retest the demand level below at 63.85$ is likely
SHORT🔥
✅Like and subscribe to never miss a new idea!✅
WTI Edges Up On Big EIA Draw, Risk-on ToneFundamental approach:
- Last week, USOIL was modestly higher amid risk-on sentiment and tighter supply signals after a larger‑than‑expected US crude draw.
- Support came from the EIA’s reported six-million-barrel crude draw tied to lower imports and stronger exports, reinforcing a tightening balance even as Cushing stocks ticked up; broader sentiment also leaned on expectations of looser Fed policy aiding demand.
- Gains were tempered by mixed macro cues, fading Eastern Europe risk headlines, choppy dollar moves, and cautious positioning ahead of the next API/EIA prints.
- However, China's Sinopec last week reported a sharp profit drop, citing weak fuel consumption. The trend of subdued fuel demand is likely to continue as factors including lower consumer confidence, rising electric-vehicle adoption and improved fuel efficiency are reducing petroleum demand in China.
- Into late week, USOIL could firm if US inventories show continued draws and risk tone improves, while any surprise builds or de‑escalation of supply risks may cap rallies; follow‑through from Fed‑cut pricing and geopolitics could potentially steer near‑term direction.
Technical approach:
- USOIL found support quickly after closing below the key level at 63.90. The price is retesting both EMAs and closed above the key level at 63.90, signaling a make-or-break situation. The market awaits a clear breakout to determine the short-term movement.
- If USOIL closes above both EMAs and breaks the descending trendline, the price may continue to advance to retest the following resistance at 67.50.
- On the contrary, closing below the support at 63.90 may prompt a further weakness to retest the next support at 60.00.
PS: I shared a piece of the above ideas on The Wall Street Journal: www.wsj.com
Analysis by: Dat Tong, Senior Financial Markets Strategist at Exness

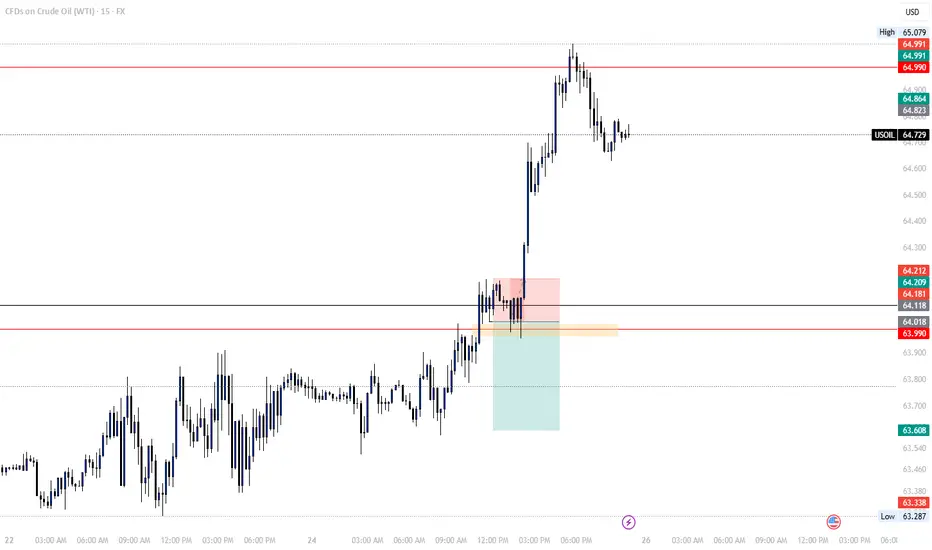
TRADE WENT SIDEWAYSIn the trade I posted today, the price managed to take the LQ, fill the Buyside FVG and keep climbing higher.
Small loss which will be recovered in the following days!
Follow for more!
SELL USOILOur trade today on OIL is going to be a short one,
We entered after that the market swept the LQ and gave us a reversal as a confirmation.
Follow for more!

WTI Crude Awaits Breakout Amid Sanction RisksWTI Crude Oil – Overview
Oil Holds Steady on Fed Cut Bets and Sanction Risks
Oil prices are flat in early trade as markets weigh the likelihood of a U.S. Fed rate cut in September against potential disruptions to Russian crude flows. Brent trades at $67.18 (-0.1%), while WTI is steady at $63.64, following a 2.5% gain last week.
Fading optimism over a Russia–Ukraine summit and renewed U.S. tariff threats against India add to volatility. Markets are closely watching the Aug. 27 deadline, when secondary U.S. tariffs against India for Russian oil purchases are expected to take effect.
🔹 Technical Outlook
WTI is trading in bullish momentum as long as it holds above 63.47.
Price is likely to consolidate between 63.47 – 64.72 until a breakout.
✅ Above 64.72: Bullish continuation toward 65.83 → 67.20.
⚠️ Below 63.47: Bias turns bearish, targeting 61.83.
🔹 Key Levels
Support: 63.47 – 61.83
Resistance: 64.72 – 65.83 – 67.20
✅ Summary:
WTI crude remains range-bound but biased to the upside, supported by Fed cut expectations and geopolitical risks. A decisive break from the 63.47–64.72 range will set the next trend direction.

WTI Steadies as Rate-Cut Bets and Supply Risks CollideWTI Steadies as Rate-Cut Bets and Supply Risks Collide
WTI crude hovered around $64 on August 25, steady after last week’s gains as traders balanced U.S. rate-cut expectations with geopolitical risks. The Fed is seen 85% likely to cut rates in September, boosting demand outlooks.
Supply concerns persist after Washington threatened 50% tariffs on Indian imports over Russian oil purchases, while India signaled it will keep buying from Moscow. Stalled Russia-Ukraine talks and renewed attacks on energy infrastructure add to uncertainty.

WTI Bull setupSwing trade
Bull points
- RSI div
- Wait for trend reversal
Put Buy stop on last Lower High or wait for HH and HL or reversal
RRR 1:1
Go for 1:2 manage your risk first...
BRIEFING Week #34 : The Rotation may have BegunHere's your weekly update ! Brought to you each weekend with years of track-record history..
Don't forget to hit the like/follow button if you feel like this post deserves it ;)
That's the best way to support me and help pushing this content to other users.
Kindly,
Phil

WTI Crude Oil · M15 · 24-Aug — “Buy the Dip into EMA/Donchian”🟢 Bias: Intraday long after spike, buy the dip into Donchian + EMA support.
Entry: $62.90 – $63.20
Stop-Loss: $61.95
Targets: TP1 $63.80 · TP2 $64.70 · TP3 $66.00
RRR (from $63.10): Risk $1.15 → TP3 +$2.90 = ~1:2.5 ✅
Why this works:
Confluence: Donchian support ($62.91) + 200 EMA M15 ≈ $62.38 (white).
Structure: Higher highs/lows since Aug-20; volume expands on pushes, compresses on pullbacks.
HTF context: H4 pressing toward 200 EMA ≈ $64.7–$65.0 (key pivot).
Execution: Look for a bullish rejection/engulfing inside the box + 8/21 EMA hold (orange/blue) above the 200 EMA (white).
Risk: ≤ 1%. Move SL→BE after TP1.
Trade Confidence: ⭐⭐⭐⭐ (High if retest holds and 8/21 maintain bullish structure)
🔒 Want more? The Prime version below adds: alternate short plan at $64.7–$65.0, management ladder, HL tight-stop variant (~4R), and a full execution checklist. Follow on Skool, link in profile!
⚠️ Trading involves risk. Manage exposure and trade responsibly.
💬 Thoughts on this setup?

USOIL SENDS CLEAR BEARISH SIGNALS|SHORT
USOIL SIGNAL
Trade Direction: short
Entry Level: 63.73
Target Level: 61.24
Stop Loss: 65.36
RISK PROFILE
Risk level: medium
Suggested risk: 1%
Timeframe: 8h
Disclosure: I am part of Trade Nation's Influencer program and receive a monthly fee for using their TradingView charts in my analysis.
✅LIKE AND COMMENT MY IDEAS✅

USOIL Set To Fall! SELL!
My dear subscribers,
This is my opinion on the USOIL next move:
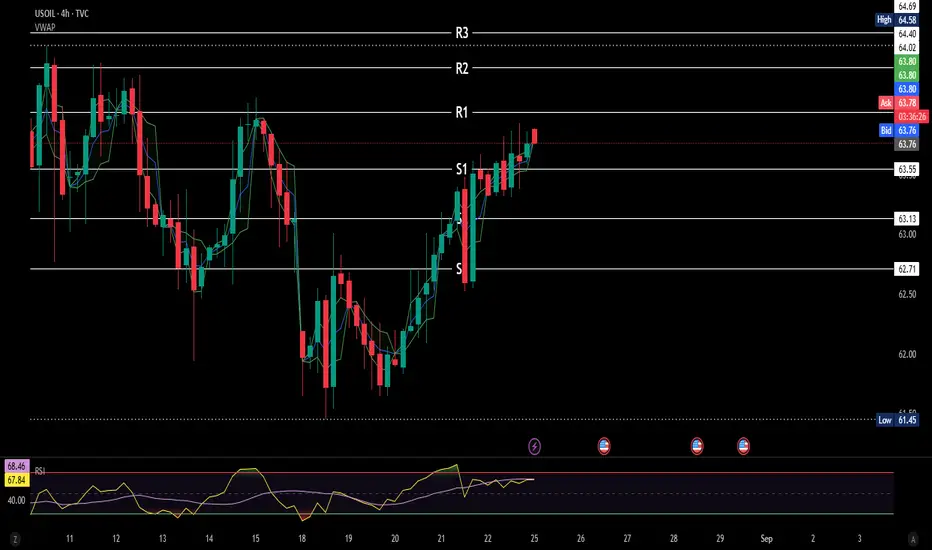
The instrument tests an important psychological level 63.76
Bias - Bearish
Technical Indicators: Supper Trend gives a precise Bearish signal, while Pivot Point HL predicts price changes and potential reversals in the market.
Target - 63.02
About Used Indicators:
On the subsequent day, trading above the pivot point is thought to indicate ongoing bullish sentiment, while trading below the pivot point indicates bearish sentiment.
Disclosure: I am part of Trade Nation's Influencer program and receive a monthly fee for using their TradingView charts in my analysis.
———————————
WISH YOU ALL LUCK
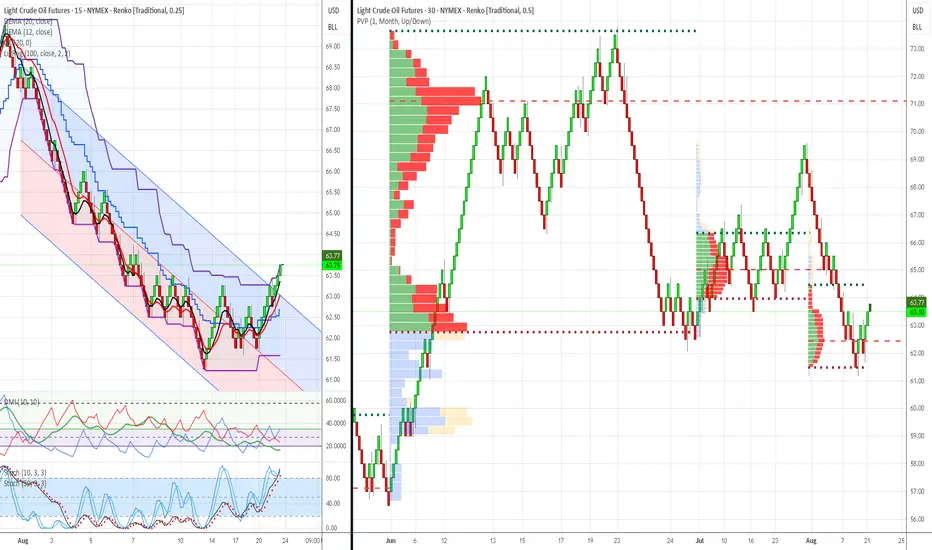
WTI Crude Oil Trading Analysis: June-August 2025 - 25-AugustWTI Crude Oil Trading Analysis: June-August 2025 Review & Week of August 25th Recommendations
Analysis Date : August 23, 2025
Market : WTI Crude Oil Futures (CL1!)
Methodology : Dual Renko Chart System ($0.25/15min + $0.50/30min)
Volume Profile : 3-Month Monthly Analysis (June-August 2025)
Executive Summary
Market Regime: Oil has completed a major corrective phase from $72 highs to $61 lows, establishing a clear bottoming pattern with strong institutional accumulation. Current setup presents high-probability bullish swing opportunity with excellent risk/reward characteristics.
Current Status : Bullish reversal confirmed with multiple technical confluences at critical support zone. Recommended positioning for upside targets with systematic risk management protocols.
3-Month Market Structure Analysis (June-August 2025)
Phase 1: Distribution & Breakdown (June-July)
Price Action: $72 → $61 (-15% decline)
June Peak: Heavy red volume distribution at $71-72 level indicated institutional selling
July Decline: Clean Renko downtrend with sustained selling pressure
Volume Profile: Minimal volume during decline, suggesting limited buying interest until $63-64 zone
Phase 2: Accumulation & Reversal Setup (Late July-August)
Price Action: $61 → $63.50 (+4% recovery)
Institutional Buying: Massive green volume accumulation at $63-65 level
Support Establishment: $62-63 zone showing strong buying interest
Technical Reversal: DEMA crossover confirmed bullish momentum shift
Volume Profile Key Levels (3-Month Analysis)
Major Support Zones :
$62-63: Primary institutional accumulation (heaviest green volume)
$60-61: Secondary support with moderate green volume
$58-59: Ultimate support level (limited historical volume)
Resistance Zones:
$66-67: First institutional resistance (mixed volume)
$69-70: Major distribution zone (heavy red volume from June)
$71-72: Ultimate resistance (peak selling pressure)
Current Technical Analysis (August 23, 2025)
Dual Chart Assessment
$0.50 Chart (Structure Analysis):
Trend: Clear bottoming pattern completed at $61 low
Current Position: Testing above major institutional accumulation zone
Volume Confirmation: Trading within heaviest 3-month green volume cluster
Structure: Higher lows pattern emerging since $61 bottom
$0.25 Chart (Execution Analysis):
DEMA Status: Bullish crossover confirmed (Black above Red at $63.00)
DMI/ADX: +DI gaining momentum, ADX rising through 25 level
Donchian Position: Price above basis, testing toward upper band
Recent Action: 3 consecutive green bricks confirming upward momentum
Technical Confluences Supporting Bull Case
Volume Profile: Massive institutional support at current levels
DEMA Crossover: Clear trend reversal signal confirmed
Momentum: DMI showing bullish shift with strengthening ADX
Structure: Higher low pattern vs. $61 bottom
Risk/Reward: Excellent positioning near major support zone
Market Context & Macro Considerations
Current Oil Market Dynamics
Supply: OPEC+ spare capacity at 5.9 million b/d (bearish)
Demand: China slowdown offset by US resilience (neutral)
Inventories: Below 5-year average (bullish)
Refining: Margins supporting crude demand (bullish)
Federal Reserve Impact
Policy Stance: Potential September rate cut (bullish for commodities)
Dollar Weakness: Could support oil prices
Inflation Expectations: Rising energy costs could influence policy
Seasonal Factors
Driving Season: Peak summer demand ending (bearish)
Hurricane Season: Atlantic activity potential (bullish)
Refinery Maintenance: September turnaround season (mixed)
Conclusion & Strategic Outlook
Near-Term Assessment (1-2 weeks): The current setup represents a high-probability swing trading opportunity with exceptional risk/reward characteristics. The combination of institutional volume support, technical reversal signals, and favorable market structure creates optimal conditions for bullish positioning.
Medium-Term Outlook (1-3 months): Successful navigation through the $66-68 resistance zone could establish a broader recovery toward $70-72 levels. However, macroeconomic headwinds and seasonal factors require careful position management and profit-taking discipline.
Risk Assessment: While the setup is compelling, traders must respect the institutional accumulation levels as ultimate support. Any violation of the $62 zone would invalidate the bullish thesis and require immediate position liquidation.
Strategic Advantage: The dual Renko chart system provides both structural clarity and tactical precision, enabling confident position sizing and systematic risk management. The monthly volume profile offers institutional-level insight typically unavailable to retail traders.
Document Classification: Trading Analysis & Recommendations
Risk Disclaimer: Past performance does not guarantee future results. All trading involves risk of loss.
CRUDE OIL Pullback Ahead! Sell!
Hello,Traders!
CRUDE OIL is etching closer
And closer towards the
Horizontal resistance of 64.60$
So as we are bearish biased
We will be expecting a local
Pullback on Monday
After the retest
Sell!
Comment and subscribe to help us grow!
Check out other forecasts below too!
Disclosure: I am part of Trade Nation's Influencer program and receive a monthly fee for using their TradingView charts in my analysis.
