#OP/USDT – Triangle Pattern Breakout Loading?#OP
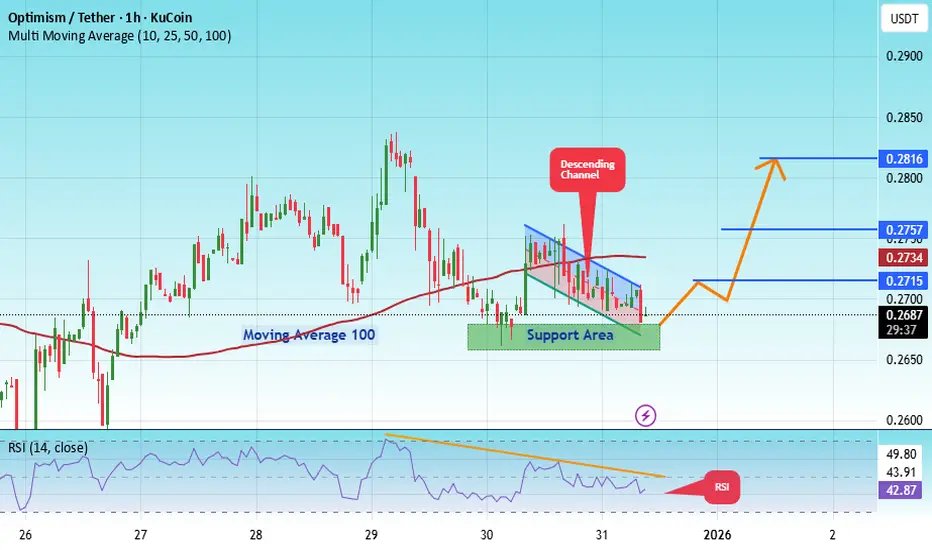
The price is moving in a descending channel on the 1-hour timeframe. It has reached the lower boundary and is heading towards breaking above it, with a retest of the upper boundary expected.
We have a downtrend on the RSI indicator, which has reached near the lower boundary, and an upward rebound is expected.
There is a key support zone in green at 0.2660. The price has bounced from this zone multiple times and is expected to bounce again.
We have a trend towards consolidation above the 100-period moving average, as we are moving close to it, which supports the upward movement.
Entry price: 0.2693
First target: 0.2715
Second target: 0.2757
Third target: 0.2816
Stop loss: Below the support zone in green.
Don't forget a simple thing: capital management.
For inquiries, please leave a comment.
Thank you.
Opportunity
#OP/USDT – Triangle Pattern Breakout Loading?#OP
The price is moving in a descending channel on the 1-hour timeframe. It has reached the lower boundary and is heading towards breaking above it, with a retest of the upper boundary expected.
We have a downtrend on the RSI indicator, which has reached near the lower boundary, and an upward rebound is expected.
There is a key support zone in green at 0.2559. The price has bounced from this zone multiple times and is expected to bounce again.
We have a trend towards consolidation above the 100-period moving average, as we are moving close to it, which supports the upward movement.
Entry price: 0.2624
First target: 0.2668
Second target: 0.2772
Third target: 0.2888
Don't forget a simple principle: money management.
Place your stop-loss order below the support zone in green.
For any questions, please leave a comment.
Thank you.

BTC — [2D] WEEK 49 TREND REPORT | 12/05/2025BTC — WEEK 49 TREND REPORT | 12/05/2025
Ticker: BINANCE:BTCUSDT
Timeframe: 2D
This is a reactive structural classification of BTC based on the weekly chart as of this timestamp. Price conditions are evaluated as they stand — nothing here is predictive or forward-assumptive.
⸻
1) Current Trend Condition [ Numbers to Watch ]
Current Price @ 89,200
• Trend Duration @ +98 Days ( Bullish )
• Trend Reversal Level ( Bullish ) @ 103,400
• Trend Reversal Level ( Bullishh Confirmation ) @ 103,400
• Pullback Support @ 100,002
• Correction Support @ 79,436
⸻
2) Structure Health
• Retracement Phase:
Correction (approaching 61.8%)
• Position Status:
Unstable (price below both structural layers)
⸻
3) Temperature :
Cooling Phase
⸻
4) Momentum :
Bearish
⸻
Author’s Note
DOWNWARD STRUCTURAL ALIGNMENT
This mark identifies a moment where the market showed clearer alignment with downside direction. It does not predict future movement, but acknowledges where weakness became more evident within the prevailing structure. Its relevance remains only while price continues to hold beneath key structural boundaries.
⸻
Methodology Overview
This classification framework evaluates directional conditions using internal trend-interpretation logic that references price behavior relative to its structural layers. These relationships are used to identify when price movement aligns with the framework’s criteria for directional phases, transition points, or regime shifts. Visual elements or structural labels reflect these internal interpretations, rather than explicit trading signals or preset indicator crossovers. This framework is observational only and does not imply future outcomes.

Ethereum - Weekly Bullish Flip Above $3KEthereum Structural Reversal Complete: Weekly Candle Confirms $3000+ Hold, Targeting $4900 with $7160 Extension
Ethereum has completed a significant structural reversal with weekly candle confirmation above the critical $3000 psychological level. The 0.618 Fibonacci retracement has held on the weekly timeframe, creating a multi-month setup targeting previous highs at $4900, with extended targets reaching the 1.618 Fibonacci extension at $7160.
🎯 Setup Overview:
Current Status: Weekly bullish reversal confirmed above $3000
Critical Level: $3500 close needed to confirm continuation
Intermediate Target: $4900 (previous cycle highs)
Extended Target: $7160 (1.618 Fibonacci extension)
Position Type: Spot portfolio addition for long-term hold
📊 What Just Happened:
The Weekly Flip:
Ethereum's weekly candle closed decisively above $3000, marking the first sustained hold above this psychological level after months of consolidation and testing. This isn't a wick or a brief spike it's a confirmed close on the weekly timeframe, which carries significantly more weight than intraday or daily moves.
The 0.618 Support:
The 0.618 Fibonacci retracement level (calculated from cycle lows to previous highs) has held throughout the recent consolidation period. This golden ratio level marks where deep corrections in bull markets typically find support before resuming uptrends.
Momentum Shift:
Weekly momentum indicators have flipped from bearish to bullish. The reversal isn't just price it's confirmed by:
Volume expansion on the breakout
Momentum oscillators crossing into bullish territory
Market structure shifting to higher lows
📈 Why $3500 Is The Key Level:
The Gate to Higher Prices:
A weekly close above $3500 would accomplish several technical objectives:
Break above intermediate resistance that capped prior rallies
Confirm the $3000 level as support rather than temporary bounce
Open clear path to retest previous highs at $4900
Signal institutional accumulation phase is complete
Historical Context:
$3500 previously acted as both support (before the decline) and resistance (during recovery attempts). A clean break and hold above this level represents role reversal—former support becomes resistance becomes support again.
Why Weekly Matters:
Daily closes can be manipulated or result from short-term volatility. Weekly closes represent sustained conviction from market participants and institutional positioning that persists across multiple trading sessions.
🎯 The Target Structure:
Phase 1: $4900 (Previous Highs)
Represents the prior cycle peak
~62% upside from current $3000 level
Major psychological resistance where profit-taking will occur
First logical target for position reduction
Phase 2: $7160 (1.618 Fibonacci Extension)
Long-term extension target based on geometric progression
Represents 138% upside from $3000
Aligns with potential new cycle highs
Final target for remaining position
Why These Targets:
Not arbitrary price predictions geometric extensions based on:
Historical price structure
Fibonacci ratios that have guided ETH throughout its history
Measured moves from confirmed support levels
Previous cycle behavior patterns
📊 Technical Confluence:
Weekly 0.618 Fibonacci:
This deep retracement level held as support, indicating strong hands accumulated the pullback. When 0.618 holds, the probability of continuation to previous highs increases significantly based on historical crypto cycles.
$3000 Psychological Level:
Round numbers matter in crypto. $3000 represents a major psychological threshold that attracts both retail and institutional attention. Holding above this level shifts sentiment.
Volume Confirmation:
The move above $3000 occurred with increasing volume, suggesting accumulation from larger players rather than retail FOMO. Sustainable moves require volume validation.
Market Structure:
Higher lows are now establishing on the weekly chart. This is textbook uptrend structure after a corrective phase completes.
🛡️ Spot Portfolio Addition Strategy:
Why "Spot" Matters:
This isn't a leveraged trade or short-term speculation. This is spot accumulation for a multi-month to multi-year position. Key differences:
No liquidation risk
Can weather volatility without forced exits
Designed to capture structural moves, not daily swings
Appropriate for long-term asymmetric bet on crypto adoption
Position Sizing:
Crypto allocation should be sized according to:
Personal risk tolerance (typically 5-10% of portfolio max)
Ability to withstand 30-50% drawdowns without panic
Long-term conviction in Ethereum's utility and adoption
Understanding this is a high-risk, high-reward allocation
Entry Approach:
Primary entry: Current $3000+ zone (confirmed support)
Additional entry: Pullback to $3200-3300 if opportunity presents
Final add: On confirmed break above $3500 (momentum confirmation)
This staged approach improves average entry while maintaining conviction.
📈 Why Ethereum for Long-Term Hold:
Fundamental Backdrop:
Ethereum 2.0 transition to proof-of-stake complete
Growing DeFi ecosystem with real utility
NFT and tokenization infrastructure
Institutional adoption increasing (ETFs, corporate treasury)
Deflationary tokenomics post-EIP-1559
Market Position:
ETH represents the second-largest cryptocurrency by market cap with established network effects, developer activity, and institutional recognition.
Risk Acknowledgment:
Crypto remains highly speculative and volatile. Regulatory uncertainty, technological risks, and market sentiment shifts can cause dramatic price swings unrelated to technical structure.
🧠 Why Most Will Miss This Setup:
Fear from Past Pain:
Many traders were hurt during the drawdown from previous highs. That emotional scar makes re-entry uncomfortable precisely when risk/reward is most favorable.
Waiting for "Confirmation":
By the time $4000 or $4500 "confirms" the move, the best risk/reward is gone. Entry at $3000 with $2700 stop offers far superior asymmetry than entry at $4000 with $3500 stop.
Disbelief After Consolidation:
Long consolidation periods create disinterest. When breakouts finally occur, many aren't watching anymore yet these are often the highest-probability setups.
Recency Bias:
Recent sideways action makes traders assume more sideways action. Weekly timeframe reversal suggests the character of price action is changing.
📊 Fibonacci Extensions Explained:
Why They Guide Long-Term Moves:
Fibonacci extensions (1.272, 1.618, 2.618) project where impulse waves typically complete based on the size of previous moves. The $7160 target (1.618 extension) isn't random—it's a mathematical projection.
Historical Validation:
Throughout crypto history, major bull moves have repeatedly respected these extension levels. Bitcoin, Ethereum, and other major assets have demonstrated this pattern across multiple cycles.
How to Use Them:
Identify completed corrective structure (0.618 support held)
Measure from correction low to breakout high
Project extensions for potential targets
Use these as profit-taking zones, not guaranteed destinations
📅 Timeframe Expectations:
Multi-Month Position:
From $3000 to $4900 could take 3-6 months depending on momentum and broader crypto market conditions. This isn't a swing trade—it's a position trade.
From $4900 to $7160:
If achieved, this extension could take 6-12+ months and likely requires favorable macroeconomic conditions and continued crypto adoption narratives.
Volatility Acceptance:
Expect 15-25% pullbacks even within a bull move. Spot positions can weather this; leveraged positions cannot. This is why spot allocation matters.
⚠️ Risk Factors:
Crypto Volatility:
30-50% drawdowns are normal in crypto, even during bull markets. Position sizing must accommodate this reality without forcing emotional exits.
Regulatory Uncertainty:
Government actions on crypto regulation, particularly in major markets like the US and EU, can cause rapid sentiment shifts.
Macro Environment:
Crypto correlates with risk assets. Fed policy, recession fears, and liquidity conditions affect crypto prices significantly.
Technical Failure:
If Ethereum closes back below $2700 on a weekly basis, the 0.618 support thesis breaks and the bullish structure is compromised. This requires disciplined reassessment.
$3500 Rejection:
Price could fail at $3500 and consolidate longer before attempting higher targets. Patience required if this scenario plays out.
🏆 The Long-Term Investor Approach:
They Buy Structure, Not Hype:
The weekly 0.618 hold + $3000 breakout provides objective structure. No need for hopium just probability-based positioning.
They Size Appropriately:
5-10% crypto allocation allows exposure to asymmetric upside while containing downside to manageable levels if thesis fails.
They Think in Cycles:
Crypto moves in multi-year cycles. Current positioning is for the next expansion phase, not next week's price action.
They Scale Out at Targets:
Reduce 1/3 at $4900 (books significant profit, removes emotion)
Reduce 1/3 at $5800-6000 (locks more gains if extension occurs)
Final 1/3 at $7160 or trailing stop (maximizes upside while protecting capital)
📌 Key Takeaways:
✅ Weekly confirmation matters: Daily noise is filtered out; weekly close above $3000 signals structural change.
✅ 0.618 support held: This Fibonacci level has historically marked the end of corrections in crypto bull markets.
✅ $3500 is the gateway: Close above this level opens clear path to retest $4900 highs with minimal resistance.
✅ $7160 represents geometric extension: Not speculation mathematical projection based on Fibonacci ratios that have guided ETH historically.
✅ Spot allocation appropriate: Long timeframe, high volatility, and asymmetric potential make this a spot hold, not a leveraged trade.
⚠️ Important Disclaimers:
This analysis is for educational purposes and reflects a technical view based on weekly timeframe structure, Fibonacci analysis, and crypto market cycles. It is not financial advice or a recommendation to buy or sell Ethereum or any cryptocurrency.
Cryptocurrencies are highly speculative and volatile. Price can drop 30-50% in days regardless of technical structure. The $7160 target represents a mathematical extension, not a guaranteed destination.
Regulatory risk, technological vulnerabilities, and market manipulation are inherent to crypto markets. Past cycle behavior does not guarantee similar patterns will repeat.
The 0.618 support could fail. If Ethereum closes below $2700 on a weekly basis, the bullish thesis is compromised and requires immediate reassessment.
Only invest capital you can afford to lose completely. Crypto allocation should be sized as high-risk, high-reward portion of diversified portfolio. Consider consulting a financial professional and understand the technology and risks before investing.
All cryptocurrency investing involves substantial risk of loss.
✨ Join the Discussion:
Are you accumulating Ethereum at these levels? How do you approach spot crypto allocation in your portfolio? Share your perspective in the comments.
📜 Buy structure. Think in cycles. Hold with conviction.

20% long play UAMYI have noticed that healthy companies with bull runs tend to have major pullbacks of ~50-60% before short term reversal. I believe UAMY is probably topped out after the recent blow off bull run, but here we are at 56% down after the recent ATH, RSI at a local extreme low. I am buying here and TP around $11.4, unless there are indications for a greater upward move. SL at $8.7. If this fails $8.14 is next support.

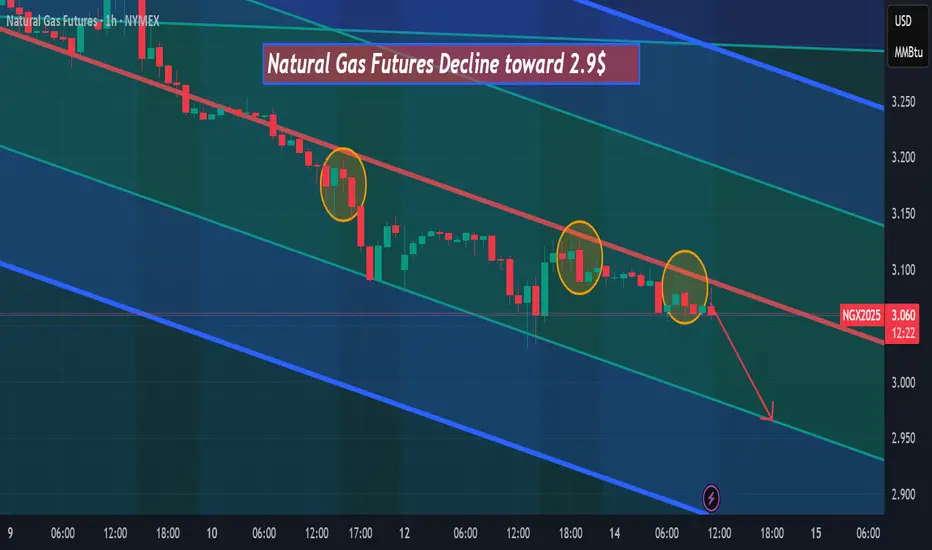
Natural gas futures are declining toward $2.90 Natural gas futures are declining toward $2.90 after three pullbacks on the bearish red trendline, according to my analysis on the 1-hour timeframe.
Sellers continue to dominate after the recent failure to hold above the bearish red trendline, increasing the probability of a move toward the $2.90 support zone
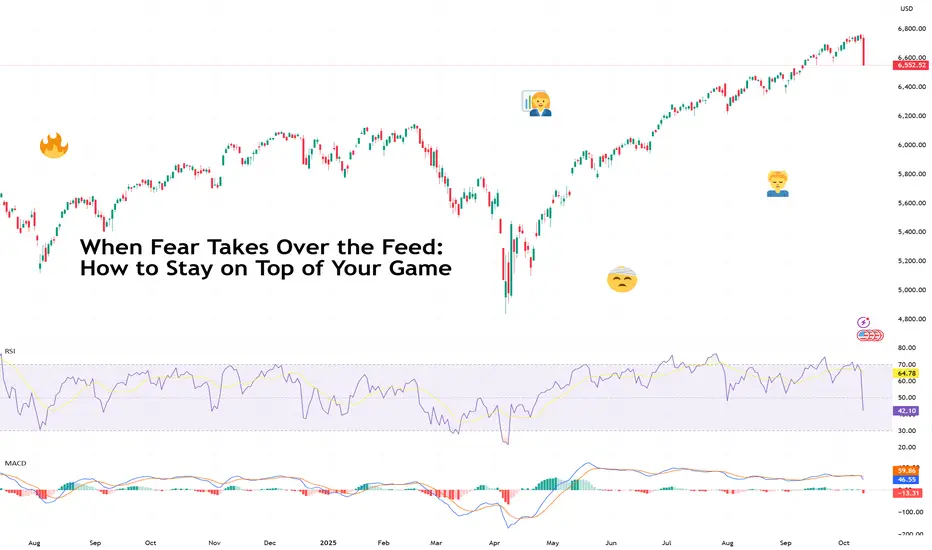
When Fear Takes Over the Feed: How to Stay on Top of Your GameFriday wasn’t just a red day — it was the kind of red that makes traders question their life choices.
The Nasdaq Composite NASDAQ:IXIC plunged 3.6% , its worst day since the April tariff-fueled meltdown.
The S&P 500 SP:SPX dropped 2.7%, the Dow Jones TVC:DJI tumbled nearly 900 points, and $1.6 trillion in market value simply evaporated.
Hello tariffs, my old friend.
President Trump announced he’s canceling a planned meeting with China’s Xi Jinping and slapping 100% tariffs on Chinese goods. Just when investors thought the trade wars were over.
It was China this time that triggered the mayhem. President Xi unveiled plans to tighten controls on rare-earth exports, materials critical for EVs and high-tech hardware.
The widespread selling was especially brutal over at the crypto corner with a record $19 billion in liquidations. Bitcoin BITSTAMP:BTCUSD face-planted 7.2% for the day, sliding below $111,000.
So, what’s a trader supposed to do when markets melt faster than your enthusiasm to study the Elliott wave?
Here’s a step-by-step guide that breaks down the psychology of panic and how smart traders stay cool when the feed turns into a fear factory.
🧠 Step One: Understand the “Fear Reflex”
When bad news breaks, the first instinct for most traders is to actually do something. Anything. Sell, short, hedge, pray — anything to make the pain stop. That’s your amygdala (the brain’s alarm system) talking.
When headlines hit, ask yourself:
• Is this new information, a re-spin of old fears, or a projection?
• Does it change the fundamentals of my positions?
• What’s the time frame of this impact — minutes, months, or meme-cycle?
If you can’t answer those calmly, and instead rush to offload your positions, you’re in panic mode and you risk making impulse decisions.
📊 Step Two: Zoom Out (Literally and Mentally)
When fear takes over the feed, the chart shrinks. Traders start staring at 1-minute candles and wonder if they should dump their stocks right now .
That’s the moment to zoom out. Pull up the 4-hour, daily, or weekly chart. You’ll likely notice that Friday’s epic collapse looks less like the apocalypse and more like a blip in an ongoing uptrend.
Case in point: The Nasdaq may have tanked 3.6%, but it’s still sitting near record territory after months of AI-fueled gains. The broader trend — higher highs, higher lows — is intact.
Volatility doesn’t mean reversal. It means emotion acting out. And markets love testing conviction.
💬 Step Three: Tune Out the Noise
When every post in your feed screams “MARKET MELTDOWN!” it’s tempting to join the panic chorus. But that doesn’t mean it’s going to be like that tomorrow.
Take for example the April crash. Stocks were rising and rising , and not too long after, they started hitting record after record .
You don’t need to read 20 opinions — you need one solid plan (and, of course, to be a daily reader of our Top Stories ).
A simple checklist helps:
• Position size: Are you overexposed?
• Stop-loss: Is it placed logically, not emotionally?
• Cash buffer: Do you have dry powder for the dip?
Don’t scramble mid-freefall. Prepare for volatility before it happens.
🧩 Step Four: Identify the Difference Between Noise and Narrative
Every market drop has two layers — the market-shaking news story and how investors perceive it.
• The headline on Friday: “Trump reignites trade war with China.”
• The perception: Markets pricing growth halt, rake hikes, gloom and doom, and apocalypse.
In the short term, that’s fear-inducing. In the medium term? It could actually mean looser monetary policy — which is generally bullish for risk assets like stocks, gold, and even crypto.
In other words, what feels like the end of the world on Friday might look like a buying opportunity by Tuesday.
🧭 Step Five: Play Offense When Others Play Defense
There’s a reason Buffett’s “be fearful when others are greedy” quote is overused — because it’s true.
When the market wipes out $1.6 trillion in a day, it’s a reminder that liquidity and emotion drive short-term moves. If your thesis is intact and you’re not that up high on leverage, you may consider this drop as a time to look for opportunities.
Instead of selling in fear, study which sectors overreacted.
• Tech led the plunge — but if (or when) there’s a rebound, these stocks will most likely be the leaders. Especially now when the third-quarter earnings season is here (check when it’s big tech’s turn to report by browsing the Earnings calendar ).
• Gold and bonds saw inflows — typical defensive plays.
• Energy and industrials may catch bids if tariffs stick.
🪙 A Note to Crypto Bros
Bitcoin’s 7% slide shows that once-independent assets have spent too much time with traditional risk assets.
And now they’re almost impossible to tell apart. As institutional capital grows in crypto, it behaves more like a growth play where risk is embraced during good times, but dumped during bad.
The lesson? Don’t buy the “decoupling” narrative so easily. Bitcoin may hedge against long-term fiat decay, but in a short-term panic, it’s still part of the same risk ecosystem. The smart move is to trade correlations , not beliefs.
If Bitcoin drops with stocks during a tariff tantrum, that’s confirmation that institutional traders are playing both arenas.
🧡 Final Takeaway
Let’s acknowledge that Friday’s bloodbath was catastrophic to many . It wiped out traders that were holding both stocks and crypto. If that happened to you, as painful as it is, keep your head up, take a breath (or a break), and come back another day.
And when you do, widen your chart, trim that leverage and keep your bets nimble so you’d survive the next inevitable meltdown.
Finally, we can't not address the elephant in the room. It was likely another Trump-led market rinse-and-repeat cycle: tweet, panic, rebound. Futures are recovering after Trump waved away tariff fears , saying “Don’t worry about China, it will all be fine!”
Off to you : How did you fare Friday? And what's your way of weathering the market storms? Share your experience in the comments!
Crude oil future Decline toward 59$hello,
According to my technical analysis, there is a high probability of a decline toward $59 in the next few hours for two main reasons:
-A breakout below the support level.
-A pullback retesting that broken support.

Non-Farm Payrolls: Do You Trade the Print or Let It Pass?NOTE – This is a post on Mindset and emotion. It is NOT a Trade idea or strategy designed to make you money. If anything, I’m posting this to help you preserve your capital, energy and will so you can execute your own trading system with calm, patience and confidence.
Every first Friday, the market braces for NFP.
For some, it’s a chance to catch a big move.
For others, it’s a day to protect capital and energy.
The real question isn’t just what’s the number?
It’s: What’s your process around events like this?
Here’s the work to do before Friday:
1. Define your approach
Are you trading the release, fading the first spike, or waiting until the dust settles? Write it down before the event - don’t decide in the heat of the moment.
2. Check what’s pulling you in
Is it part of your tested edge, or are you driven by FOMO, the rush of adrenaline, or the feeling that you “should” trade it?
3. Notice your body’s signals Faster breathing or shallow breaths
Shoulders tightening
Heart rate climbing
Narrowed focus on the screen
Fingers itching to click
These are not just “nerves” they are signals. Use them as feedback, not fuel.
4. Review the impact afterwards
Did trading the news leave you calm, in control and aligned with your plan?
Or did it drain your energy, push you into overtrading, or spark regret?
The point isn’t whether NFP is an opportunity or a trap . It can be either.
The edge comes from knowing yourself, deciding ahead of time and sticking to a process that matches both your system and your psychology.
So before the number drops, get clear:
- Do you have a defined playbook?
- Or are you letting the market and your body pull you into one?
If you’re contemplating trading at any point around the NFP number you might want to check out @JeffBoccaccio’s posts on ES range expectations around the release for some idea on how he frames the news event. Start here but check out the linked video post for a walk-through explanation:

PUMP NOW THANK ME LATERBeen holding this gem since 0.0028, project has perfect tokenomics with team specialising on draining crypto degen-monkeys, investing profits from pump.fun platform into SPOT token buybacks, no sell-out has been started yet (and it won't be until new ATH).
So I expect at least x2 from current price range in the upcoming weeks with a rapid parabolic-like growth on the daily.
I used basic fibs to mark support/resistance levels, feel free to comment and suggest ideas/takes.
I cannot see a reason to search for any kind of any more advanced patterns because BYBIT:PUMPUSDT is just starting to grow and the trend is mostly towards new price-discovery.
pump.fun has already facilitated over 5.3M token launches since early 2024, generating nearly $800M in revenue and even pulling off a $1.3B ICO in minutes. Current market cap sits above $1.7B with daily volume regularly crossing $200M — massive liquidity for a memecoin-born project. With ~350B tokens circulating (vs. 1T max), the room for valuation expansion is still huge.
So back to 'crypto degen monkeys' - don't become one, chose your exit points cleverly and avoid high margin (I know it might be tempting).

LINK/USDT buy opportunitywaiting for pullback, step down to 22.51 to buy, a lot of demand on that price area, after consolidation near that price range, think that at least 5% step up is pretty possible

Bitcoin: Swing Buy Opportunity on Pullback/Breakout__________________________________________________________________________________
Market Overview
__________________________________________________________________________________
Momentum : Market is showing bullish momentum 📈, consolidating at the top of its post-ATH range, with higher lows preserved and no excessive jargon.
Key Levels :
• Resistances (1D/4H/2H): 117,723 (240 pivot), 119,658 (W pivot), 119,863 (720 pivot), 123,182 (D pivot)
• Supports (1D/4H/2H): 115,903 (240 pivot), 114,708 (240 pivot), recent daily demand zone >112,000
Volumes : Generally normal volumes; moderate spikes on 1H/15m during resistance tests.
Multi-timeframe signals : Clear bullish structure on 1D to 2H; short-term weakness on 30m–15m, local bearish bias.
Risk On / Risk Off Indicator context : Neutral-buy bias on daily/HTF, but short-term sell signal on 30m–15m → local risk-off bias.
__________________________________________________________________________________
Trading Playbook
__________________________________________________________________________________
Global bias : Bullish as long as 115,903 (2H/4H support) holds on closing basis; invalidation below this level.
Opportunities :
• Buy on controlled pullback towards 116k–115,903 with LTF confirmation.
• Breakout long on close/retest above 117,723 targeting 119,658/119,863 then 123,182.
• Tactical short scalp on clean rejection from 117,723 if Risk On / Risk Off Indicator stays on Sell (LTF).
Risk/invalidation zones : Bullish invalidation below 115,903 (2H/4H close) exposes the 110k area.
Macro catalysts :
• Persistent geopolitical tensions & stablecoin regulatory headlines; volatility possible.
• Institutional inflows (ETF, Harvard) strengthen the setup, but no immediate technical macro trigger.
• Intermittent risk-off climate from external news.
Action plan :
• Entry: Long on reversal signal at 116k–115,903, OR confirmed breakout above 117,723.
• Stop: Below 115,903 (pullback) OR 117,043 (breakout).
• TP1: 117,723 / TP2: 119,658–119,863 / TP3: 123,182
• R/R: Aiming 2:1 or better; move stop to BE after TP1.
__________________________________________________________________________________
Multi-Timeframe Insights
__________________________________________________________________________________
1D/12H/6H/4H : Bullish price structure, higher lows, key support at 115,903; positive momentum, further move expected on clean breakout above 117,723.
2H/1H : Confirmed bullish flow, steady bid as long as 115,903–116k area holds; increased volume at resistance tests.
30m/15m : Notable short-term weakness, Risk On / Risk Off Indicator is on Sell, possible fake-outs above 117,723; short setups possible.
Divergences : Daily bias is bullish, but short-term signals indicate local seller dominance—careful of traps around breakouts.
__________________________________________________________________________________
Macro & On-Chain Drivers
__________________________________________________________________________________
Macro events : Geopolitical tensions (Ukraine, Middle East), US/EU economic divergence, stablecoin regulation uncertainty (US/China).
Bitcoin analysis : Institutional flows are strong (Harvard position, ETF inflows), 117.8k is the psychological breakout level for a melt-up, no significant profit-taking seen.
On-chain data : “Air gap” below ~116k, key operational support at 115,9k; no extreme outflows.
Expected impact : Technical bullish bias reinforced if supports hold, but macro risk warrants cautious stop placement.
__________________________________________________________________________________
Key Takeaways
__________________________________________________________________________________
Market remains broadly bullish with strong supports around 115,903 and high-probability setups on validated pullbacks or a clean breakout above 117,723. The prime setup is to buy controlled drops or confirmed breakouts with tight stops. Institutional activity and macro context broadly favor upside, but geopolitics require cautious management.
__________________________________________________________________________________

BTC Scalping / Intraday Signal – Entry, Stop & Target Ready!🕒 Timeframe: 15min / 5min
⚠️ Note: Manage your risk — intraday volatility is high.
This is a short-term opportunity, not a long hold.
Disclaimer: This is our personal analysis and not financial advice. Always do your own research before making any investment decisions.
💬 What’s your take on this? Drop your thoughts in the comments and feel free to share this with your friends! ❤️

ETH Scalping Signal – Entry, Stop & Target Ready!🕒 Timeframe: 15min / 5min
⚠️ Note: Manage your risk — intraday volatility is high.
This is a short-term opportunity, not a long hold.
Disclaimer: This is our personal analysis and not financial advice. Always do your own research before making any investment decisions.
💬 What’s your take on this? Drop your thoughts in the comments and feel free to share this with your friends! ❤️

Bitcoin Wasn't Built for Bull Runs — It Was Built for This MomenDear traders,
You may be witnessing a “first” — a pivotal moment right before things begin to spiral.
We’re not fortune tellers. We don’t claim to predict the future.
But what you’re about to read is based entirely on **publicly available data**, interpreted not through speculation, but through a deep, rational analysis of interconnected facts — the kind of connections that most overlook, and few dare to question.
We may not know how the future is being orchestrated behind the scenes...
But one thing seems certain: **crisis always comes first...** and *then* we are given a **narrative** to justify it — be it war, a pandemic, or a "global emergency."
This is the correct sequence... and it’s the one they never teach you.
Yet for those of us who navigate the financial markets, one question matters more than all others:
**How do we profit from this?**
---
We recently shared an important setup on the **Nasdaq index**, the benchmark that reflects — to a large extent — the true state of the U.S. economy.
As a proxy for the 100 largest American corporations, the Nasdaq plays a critical role in signaling macro trends.
And while some are just now waking up to the storm ahead, **our outlook has been clear since October 2022**:
A major economic crisis was not only probable… it was **inevitable**.
Some analysts chalk this up to uncontrolled money printing post-2019 as governments tried to patch the damage from the COVID-19 crisis. That’s one explanation.
But at **Glich**, our vision is different.
More complex.
And for now… **not something we can fully release**.
---
For years, strong correlations between **risk markets** — especially U.S. equities and crypto — held firmly in place.
But something changed on **May 30th, 2025**. Completely and unmistakably.
The link was severed.
Now ask yourself:
**Why was Bitcoin created in the first place?**
It wasn’t just digital money.
It was a bold, revolutionary idea. A system designed for a future economy no longer shackled by inflation, central banking failures, or hidden agendas.
A fluid, transparent, and secure network for a world in desperate need of change.
The current financial model is obsolete. It’s no longer evolving — just surviving.
And it can no longer answer the challenges of what's to come.
**2008 was not the collapse; it was the setup.** A convenient pretext to slowly roll out something **new**.
And "Satoshi Nakamoto"? Well, let’s just say...
**That name means more than you think.**
_"HIDDEN INFORMATION"_ 👁️
---
What does NEO mean when he says:
> "This has all happened before… yet it’s happening for the first time"?
And what does that have to do with us?
This analysis is *not* just about charts or setups.
It’s a **hidden message** — a spotlight on a once-in-a-generation opportunity lying in plain sight.
But not everyone is trained to read between the lines.
---
Let us ask:
- Why was **Donald Trump** specifically pushed into position?
- Why is crypto — after being suppressed, banned and attacked worldwide — now being quietly **promoted** and fast-tracked in legislation during 2024 and 2025?
Something’s moving beneath the surface.
---
### 🔍 In summary:
- Expect a tidal wave of **global crypto legislation** to pass in the coming **days/weeks/months**.
- Crypto — particularly **BTC and ETH** — will become silent **stores of value** during the economic storm.
- Expect record-breaking levels: **$400K for Bitcoin**, **$40K for Ethereum**.
Yes, this may sound like science fiction…
But keep your eyes and ears wide open. 👁️
- And brace yourself for a **historic collapse** in U.S. equities. Possibly… something we’ve never seen before.
---
The show is starting.
And we won’t spoil the ending — because watching it unfold is part of the experience.
But here’s what we *can* say, thanks to our proprietary **algorithmic system**:
- The **U.S. economy will bleed**.
- And crypto will blow past expectations — fulfilling the very purpose it was built for.
---
🛒 Load your bags in the coming days...
Because when this train leaves the station —
It won't be stopping for anyone.

Nasdaq Signals Economic Instability – Are You Watching CloselyDear traders,
You may be witnessing a “first” — a pivotal moment right before things begin to spiral.
We’re not fortune tellers. We don’t claim to predict the future.
But what you’re about to read is based entirely on publicly available data, interpreted not through speculation, but through a deep, rational analysis of interconnected facts — the kind of connections that most overlook, and few dare to question.
We may not know how the future is being orchestrated behind the scenes...
But one thing seems certain: crisis always comes first... and then we are given a narrative to justify it — be it war, a pandemic, or a "global emergency."
This is the correct sequence... and it’s the one they never teach you.
Yet for those of us who navigate the financial markets, one question matters more than all others:
How do we profit from this?
We recently shared an important setup on the Nasdaq index, the benchmark that reflects — to a large extent — the true state of the U.S. economy.
As a proxy for the 100 largest American corporations, the Nasdaq plays a critical role in signaling macro trends.
And while some are just now waking up to the storm ahead, our outlook has been clear since October 2022:
A major economic crisis was not only probable… it was inevitable.
Some analysts chalk this up to uncontrolled money printing post-2019 as governments tried to patch the damage from the COVID-19 crisis. That’s one explanation.
But at Glich, our vision is different.
More complex.
And for now… not something we can fully release.
For years, strong correlations between risk markets — especially U.S. equities and crypto — held firmly in place.
But something changed on May 30th, 2025. Completely and unmistakably.
The link was severed.
Now ask yourself:
Why was Bitcoin created in the first place?
It wasn’t just digital money.
It was a bold, revolutionary idea. A system designed for a future economy no longer shackled by inflation, central banking failures, or hidden agendas.
A fluid, transparent, and secure network for a world in desperate need of change.
The current financial model is obsolete. It’s no longer evolving — just surviving.
And it can no longer answer the challenges of what's to come.
2008 was not the collapse; it was the setup. A convenient pretext to slowly roll out something new.
And "Satoshi Nakamoto"? Well, let’s just say...
That name means more than you think.
"HIDDEN INFORMATION" 👁️
What does NEO mean when he says:
"This has all happened before… yet it’s happening for the first time"?
And what does that have to do with us?
This analysis is not just about charts or setups.
It’s a hidden message — a spotlight on a once-in-a-generation opportunity lying in plain sight.
But not everyone is trained to read between the lines.
Let us ask:
Why was Donald Trump specifically pushed into position?
Why is crypto — after being suppressed, banned and attacked worldwide — now being quietly promoted and fast-tracked in legislation during 2024 and 2025?
Something’s moving beneath the surface.
🔍 In summary:
Expect a tidal wave of global crypto legislation to pass in the coming days/weeks/months.
Crypto — particularly BTC and ETH — will become silent stores of value during the economic storm.
Expect record-breaking levels:
400
K
f
o
r
B
i
t
c
o
i
n
∗
∗
,
∗
∗
400KforBitcoin∗∗,∗∗40K for Ethereum.
Yes, this may sound like science fiction…
But keep your eyes and ears wide open. 👁️
And brace yourself for a historic collapse in U.S. equities. Possibly… something we’ve never seen before.
The show is starting.
And we won’t spoil the ending — because watching it unfold is part of the experience.
But here’s what we can say, thanks to our proprietary algorithmic system:
The U.S. economy will bleed.
And crypto will blow past expectations — fulfilling the very purpose it was built for.
🛒 Load your bags in the coming days...
Because when this train leaves the station —
It won't be stopping for anyone.

NASDAQ Meltdown Incoming? The Calm Before the Crash…🚨 Get ready! The NASDAQ is about to take us on a wild plunge straight to the depths of market hell... 💥🔥
Yes, yes, I know—they’ll say it’s all "because of this" or "due to that," the usual play-acting we’ve seen a hundred times before. Just another scene in the never-ending economic theater. 🎭
But here’s the forecast for tomorrow’s news:
📉 United States Initial Jobless Claims – possibly lower than expected?
📈 United States GDP Growth Rate QoQ – higher than expected?
And then... yada yada yada. You know the rest.
What does that mean? A chain reaction in risk-on assets — stocks, indexes, crypto — all heading for a steep drop. 💣📉
If you’re still a believer, here’s your solid proof — laid out 24 hours before it happens. Don’t say we didn’t warn you.
The choice is yours:
💊 Red pill or blue pill?

NEAR to $45? The Signs Are All There…Just imagine traveling through time.
Many people look back with regret, wishing they had invested in cryptocurrencies before previous bullish cycles. We've all heard phrases like "If only I had bought Bitcoin at $100, I'd be a millionaire by now."
But the real question is: Will you have the courage to make the right decision when the moment comes?
You might think I'm crazy for presenting these targets today — and that's okay. But trust me, in a few months, you'll witness the phenomenal power of our analysis system. The market is fractal by nature; what happens on lower timeframes inevitably plays out on higher ones.
NEAR is one of the most promising blockchains, and all signals are aligning for a move toward $45.
The question is: Do you have the courage to take action now?

Winter Is Coming — And LINK Is Leading the Charge (x25) Chainlink acts as a bridge between blockchain and the real world.
This asset has been on our radar for years, silently building strength. Its fundamentals are rock-solid, and the current price action is highly favorable for a strategic buy.
📈 On November 12, 2023, LINK officially confirmed its journey to $400 by breaking through our algorithmic confirmation zone. Since then, it’s shown a modest price increase… and right now, it's retesting one of the best buy zones we've seen.
But here's the catch:
In the coming weeks, we expect explosive rallies — the kind that won’t allow for optimal entries anymore.
✅ We are currently positioned long on LINK, and it’s proving to be one of our strongest investments to date.
And remember:
The assets we publish on TradingView have already confirmed their trajectory toward our predicted targets.
🎬Not even Trump... not even a world war could stop what’s coming.
🚀 Buckle up... because winter is coming.
And LINK is ready to lead the storm.
🔍 Disclaimer: This is our personal analysis and not financial advice. Always do your own research before making any investment decisions.
💬 What’s your take on this? Drop your thoughts in the comments and feel free to share this with your friends! ❤️

ETH Investors Are Confused, But the Algorithm Says $40K's Coming🚨 Ethereum: Confusion or Opportunity?
Many investors are currently confused — wondering whether Ethereum (ETH) is due for a deeper retracement… or if it’s about to skyrocket. So, what’s really going on?
According to our algorithmic model, ETH confirmed a long-term price target of $40,000 the moment it broke above $3,594 on March 11, 2024.
The pullback that followed?
It’s not a sign of weakness — it’s a golden entry opportunity for the next leg up with a garenteed x15 ROI from actual prices.
📉 The $883 low is considered a protected low, and according to our structure, it will likely remain untouched until ETH reaches $40,000.
💰 Why We’re Heavily Exposed to ETH
Given the current market conditions, we’ve allocated the majority of our capital to Ethereum, as it currently represents one of the most secure and promising assets in the crypto space for mid- to long-term positioning.
This isn’t just a trade — it’s a strategic investment.
🚀 Happy Trading,

Short-Term BTC Scalping Opportunity⚡Say less
💥Setup and forget
💥the position is off if price hits 111,959 first.
💥leverage maybe used according to your risk management

Weekly Market Wrap: Nifty Dips 340 Points Amid Global TensionsThis week, the Nifty 50 ended on a cautious note, closing at 24,008, down 340 points from the previous week's close. The index traded within a tight range, hitting a high of 24,526 and a low of 23,935—well within my anticipated levels of 24,900 to 23,800.
Silver Lining: Despite ongoing geopolitical tensions and negative news flow—including war-related developments—bulls managed to defend the critical psychological support of 24,000. That’s a sign of resilience in an otherwise shaky environment.
What’s Ahead?
For the upcoming week, expect high volatility. I see Nifty moving between 24,600 and 23,200. A weekly close below 23,800 could spell trouble for bulls, potentially opening the door for a drop toward major support zones at 23,200 and 23,000.
Technical Outlook:
Monthly & Daily Timeframes: Weak
Weekly Timeframe: Still bullish
So, while long-term charts show vulnerability, the weekly trend gives hope. I'm staying cautiously bullish—but will only turn aggressive once the monthly chart flips positive. Until then, it’s time to stay vigilant, not impulsive.
Global Cues: S&P 500 Holding Up Amid Uncertainty
The S&P 500 closed at 5,659, just 30 points down from the previous week, forming a doji candle—a clear sign of indecision. As long as the index holds above 5,532, there's no major cause for concern.
Bearish Trigger: Below 5,532, expect downside pressure toward 5,458 and 5,392, which could spill over into already fragile emerging markets like India.
Bullish Breakout: Above 5,770, bulls gain momentum, with potential upside targets of 5,821, 5,850, and 5,900. A rally here could bring relief to global equities, including Indian markets.

ARTY coin is in the bottomARTY has bottomed out and appears very undervalued, making it an excellent entry point. I’ve already bought ARTY, as the current price of $0.2685 (as of April 15, 2025) presents a strong opportunity. The chart shows a clear break above a long-term descending trendline, labeled "a broken trendline," signaling a potential reversal. The price is now testing resistance around $0.420, with a projected target of $1.107 during a bull run, as indicated by the arrow on the chart. The Ichimoku Cloud also shows ARTY trading above the cloud, a bullish signal, while the RSI at the bottom is trending upward, indicating growing momentum.
Additionally, ARTY’s market cap is very low, with 80% of its total supply already in circulation. The number of ARTY holders is steadily increasing, reflecting growing interest. Artyfact has significant upcoming milestones, including launches on PlayStation, Xbox, AppStore, and Google Store, which are expected to attract millions of users and drive substantial growth.
This setup, combined with the fundamental catalysts, makes ARTY a compelling investment at this stage.
