Trades with B – Daily Recap (Nov 6 2025)Ticker: QQQ / NQ1! (5 min & 15 min TF)
Strategy: ORB Pro + Golden Pocket Retest + Volume Filter
Focus: Confirmation Entry + HTF Trend Confluence
🧭 Market Context
The Nasdaq futures (NQ1!) opened with a sharp push into a key supply zone marked by the previous day’s Golden Pocket.
After an early fake push up, the market rolled over cleanly beneath the EMA cluster and the ORB box on both timeframes.
The first true confirmation signal came mid-morning — the 15 min and 5 min timeframes synced short, and the volume aligned perfectly with trend continuation.
🧠 Trade Review
Entry: 11:02 EST QQQ $613 Put (ORB Pro Short Trigger)
Exit: 11:35 EST — ORB extension target hit → secured profit into momentum flush
System Validation: Perfect alignment across EMA trend + HTF bias + retest rejection signal
P/L: +$199.78 net profit ( + $289.94 closed gain – $190.05 entry cost )
This trade was clean — confirmation entry, defined risk, and no over-trading.
📊 Performance Snapshot
Metric Value
Win Rate 100 % (today’s single trade)
Best Trade +$289.94
Largest Loss – $190.05
Net Result +$199.78 (Realized)
Setup Accuracy Excellent – Full confirmation alignment
📈 Chart Breakdown
The ORB Pro short triggered as price retested the upper Golden Pocket zone and failed to hold above the purple EMA band.
Both the 15 min and 5 min charts show a clean EMA curl-down with volume confirmation.
The short target zone was hit precisely before a small midday bounce, validating the system’s filter timing.
💡 Key Takeaways
Wait for alignment – when HTF and LTF agree, you get momentum moves.
Clean entry > early entry – confirmation beat anticipation again.
ORB Pro filter precision – blocked late entries, protecting the green.
🧘♂️ Reflection
“The setup was textbook — patience finally paid off. One trade, one signal, and one profit. The goal now is simple: keep filtering for these perfect alignments and size up responsibly as consistency builds.”
🧩 Next Steps
✅ Focus only on HTF + LTF confirmation signals
✅ Avoid re-entries once target zone is hit
✅ Document each setup screenshot for pattern library
Optionsstrategies

Opening (IRA): IBIT December 19th -52P... for a 2.24 credit.
Comments: High IVR/IV. Adding at strikes/break evens better than what I currently have on. Using a Plain Jane 20-ish delta short put here.

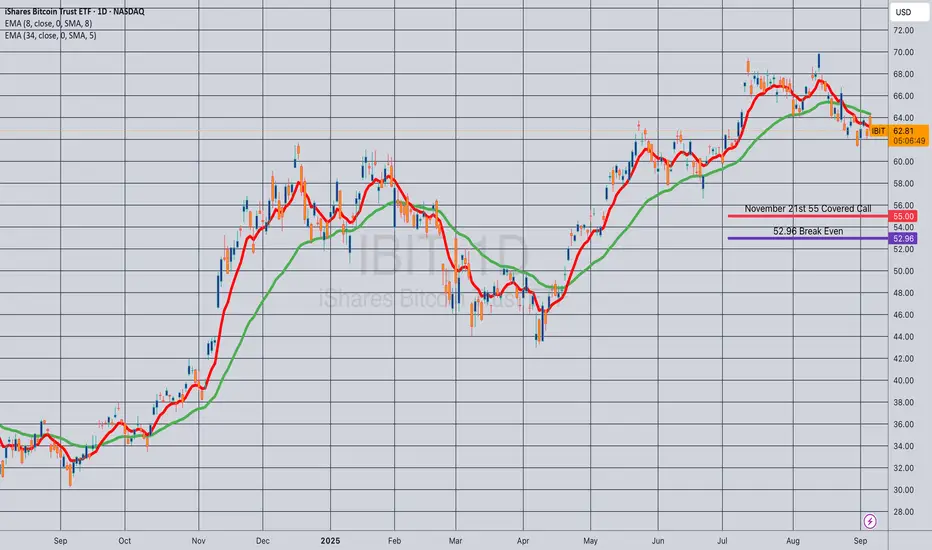
Opening (IRA): IBIT November 21st 55 Monied Covered Call... for a 52.96 debit.
Comments: Slowly building a position. Would've preferred a down day, but can't have everything. Selling the -75 delta call against shares to emulate the delta metrics of a 25 delta short put, but with the built-in defense of the short call and to take advantage of higher call side IV.
Metrics:
Buying Power Effect/Break Even: 52.96
Max Profit: 2.04 ($204)
ROC at Max: 3.85%
50% Max: 1.02 ($102)
ROC at 50% Max: 1.93%
Upstart UP? Or a FI-like crash?If FI didn't get absolutely smoked this week, and earnings next week I'd absolutely be buying here. However, "new finance" and fintech seems to be getting hit hard this month. So with earnings coming up, I'm not going to buy this stock, but I'm tempted to buy a call option.
Going back to the weekly chart, UPST is really close to hitting it's lower upward trendline which is somewhere around 40.
The current price is 46.
The 200 day moving at about 66 (20pts up)
The upper downward trendline (triangle forming) is at about 80. That's a lot of room to move, and a call option seems like limited risk/reward.
On the daily chart, it's currently falling in a falling wedge.
It looks like the perfect scenario for a swing trade.
I'll look at call options on open and update if I initiate a trade.

GOOGL Alphabet Options Ahead of EarningsIf you haven`t bought GOOGL before the rally:
Now analyzing the options chain and the chart patterns of GOOGL Alphabet prior to the earnings report this week,
I would consider purchasing the 305usd strike price Calls with
an expiration date of 2026-1-16,
for a premium of approximately $8.30.
If these options prove to be profitable prior to the earnings release, I would sell at least half of them.

Opening (IRA): SPY January 19th -565P... for a 5.87 credit.
Comments: Adding at strikes/break evens better than what I currently have on, targeting the strike paying around 1% of the strike price in credit.
Will look to roll at 50% max.

Opening (IRA): SPY December 19th -590P... for a 6.24 credit.
Comments: Adding at strikes better than what I currently have on, targeting the strike paying around 1% of the strike price in credit.
Will generally look to roll at 50% max.

Opening (IRA): SPY November 21st -625P... for a 6.26 credit.
Comments: Whoop, there it is. >21 VIX plus weakness. Targeting the strike paying around 1% of the strike price in credit.
Will look to add at intervals, assuming I can get in at strikes better than what I currently have on.

NOK Nokia Options Ahead of EarningsAnalyzing the options chain and the chart patterns of NOK Nokia prior to the earnings report this week,
I would consider purchasing the 5.50usd strike price Calls with
an expiration date of 2025-11-21,
for a premium of approximately $0.34.
If these options prove to be profitable prior to the earnings release, I would sell at least half of them.

What Bitcoin Options on CME Are Whispering Right Now
A quick look at the flow — and it’s clear:
the market is pricing in a move toward $145K–$150K.
But here’s the nuance:
nearly all these call spreads come with a hedge — a short futures leg added right away.
This isn’t pure bullish speculation.
It’s a structured play.
🔍 The Logic Behind It:
Primary goal: Profit from upside as BTC rallies.
But also prepared for downside:
These portfolios assume a potential drop to $103K, and in some cases even $101K — which are the break-even points of the structures.
At those levels:
The short futures can be bought back for profit (closing the hedge)
Or the entire position can be closed out entirely, if sentiment shifts dramatically
In other words — they’re bullish, but not blind.
They want exposure to upside…
while keeping an exit ramp ready if things go south.

Options Blueprint Series [Intermediate]: ES Condor in the Clouds1 — The Market in a Cloud Layer
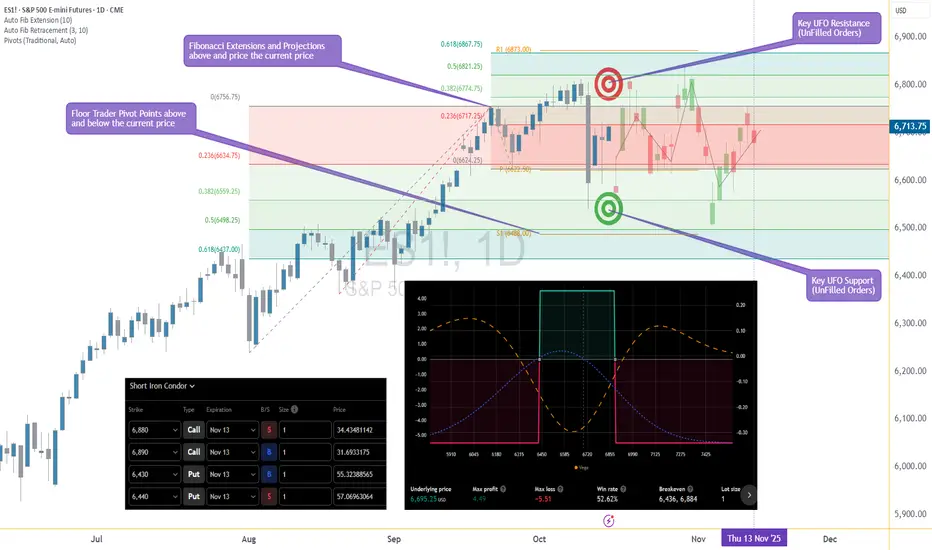
The S&P 500 (E-mini and Micro E-mini) futures have recently been caught in a curious atmospheric pattern — not of weather, but of price action. After a strong sell-off shook the market a few days ago, both Fibonacci extensions and retracement zones now cluster densely above and below the current price. When these are joined by multiple Floor Trader Pivot Points and Unfilled Order (UFO) zones sitting in similar regions, a clear message emerges: this market is potentially trapped in a range.
Resistance has been repeatedly observed near 6,873, while the lower boundary around 6,437 continues to attract buyers. The index seems to be trapped between Fibs — a typical post-volatility consolidation phase.
For traders who understand that sideways markets can be just as valuable as trending ones, this environment presents an opportunity. Instead of chasing direction, the goal becomes to capture time decay while staying within defined risk limits.
2 — The Strategy: Short Iron Condor Fundamentals
A Short Iron Condor combines two credit spreads:
A short call spread above current price
A short put spread below current price
Together, they create a “no-fly zone” for the underlying — a region where the trader earns maximum profit if price remains between the inner strikes.
This position benefits from:
Stable or neutral price movement
Time decay (theta)
Declining implied volatility
The Iron Condor offers defined risk and defined reward, making it a powerful candidate for range-bound markets like the current ES setup. While the maximum gain is limited to the net premium collected, the maximum loss is also capped, making this a risk-defined non-directional strategy.
Because this structure has both call and put spreads, it offers low Vega exposure — meaning it’s not overly sensitive to volatility shocks. For intermediate traders, this makes it a comfortable way to step beyond simple single-leg strategies and into the world of multi-leg, theta-driven structures.
3 — The Setup: Building the ES Condor
For this idea, we’re looking at the ES (E-mini S&P 500 Futures) options expiring on November 13.
The structure is built as follows:
Sell 6880 Call @ 34.43
Buy 6890 Call @ 31.69
Buy 6430 Put @ 55.32
Sell 6440 Put @ 57.07
This results in a net credit, generating the potential for a maximum profit of 4.49 points (per spread), while the maximum risk stands at -5.51 points. The reward-to-risk ratio comes to approximately 0.8:1, with a statistical win rate of 52.6% based on the current volatility surface, and the Breakeven points: 6,436 and 6,884.
As long as the ES price remains between these levels by expiration, the structure will achieve profitability. The Iron Condor works best when volatility remains stable or contracts — a condition currently supported by the post-drop equilibrium visible in implied volatility readings across near-term expirations.
4 — Chart Context: Technical Landscape Supporting the Range
The chart of the E-mini S&P 500 Futures (ES) reveals a tight compression zone forming between Fibonacci extensions and retracement levels above @ 0.618 (≈6,868) and below @ 0.618 (≈6,437). This overlap with Floor Trader Pivots — specifically R1 at 6,873 and S1 at 6,488 — paints a classic range structure. This setup can be the natural habitat for an Iron Condor.
While directional traders may feel frustrated by sideways movement, option sellers can see this as a period of controlled opportunity — where theta decay compensates for the market’s hesitation.
In other words, as long as ES continues to “hover in the clouds,” the Condor quietly collects premium.
5 — CME Product Specifications and Margins
Understanding the underlying contracts is essential when selecting between E-mini S&P 500 Futures (ES) and Micro E-mini S&P 500 Futures (MES) for this options setup.
E-mini S&P 500 (ES) Futures
Tick Size: 0.25 = $12.50 per tick
Trading Hours: Nearly 24 hours (Sunday–Friday, CME Globex)
Margin (approx.): $21,000 per contract
Micro E-mini S&P 500 (MES) Futures
Contract Size: 1/10 of ES
Tick Size: 0.25 = $1.25 per tick
Margin (approx.): $2,100 per contract
(Margins may vary slightly depending on volatility and broker policies.)
For smaller accounts or for traders looking to practice scaling and hedging, the MES provides a highly capital-efficient alternative to ES.
When executing the Short Iron Condor, traders may also consider margin offsets if the structure is risk-defined — a benefit when using portfolio margin accounts. However, margin usage will vary by broker and account type.
6 — Risk Management: Keeping the Condor in the Clouds
Every Iron Condor begins with a disciplined approach to risk.
Here’s how it can be managed:
Position Sizing: Determine exposure based on the maximum loss, not the credit received. For instance, risking 1–2% of account equity per structure keeps risk contained even during volatility spikes.
Exit Before Expiration: Avoid gamma risk in the final days. Closing the trade when 50–60% of the maximum profit is achieved can reduce time risk while locking in gains.
Adjustments: If price nears a breakeven zone (6,436 or 6,884), traders can consider rolling the threatened side further away or closing half of the position to reduce delta exposure.
Volatility Awareness: A volatility spike can temporarily pressure the mark-to-market value.
Because the Iron Condor is short Vega, it benefits from a calm or contracting volatility regime.
When markets are calm, this strategy works beautifully; when storms approach, it’s time to bring the Condor to the ground.
When charting futures, the data provided could be delayed. Traders working with the ticker symbols discussed in this idea may prefer to use CME Group real-time data plan on TradingView: www.tradingview.com - This consideration is particularly important for shorter-term traders, whereas it may be less critical for those focused on longer-term trading strategies.
General Disclaimer:
The trade ideas presented herein are solely for illustrative purposes forming a part of a case study intended to demonstrate key principles in risk management within the context of the specific market scenarios discussed. These ideas are not to be interpreted as investment recommendations or financial advice. They do not endorse or promote any specific trading strategies, financial products, or services. The information provided is based on data believed to be reliable; however, its accuracy or completeness cannot be guaranteed. Trading in financial markets involves risks, including the potential loss of principal. Each individual should conduct their own research and consult with professional financial advisors before making any investment decisions. The author or publisher of this content bears no responsibility for any actions taken based on the information provided or for any resultant financial or other losses.
Options...Lets talk about risk managment
Options are a tricky subject to learn. There are many technical terms to understand like the Greeks, contract size and more.
Today I wanted to illustrate a few examples of option calls (bullish bias) on NASDAQ:BRLT
Using a website called, optionprofitcalculator.com I can simulate my idea by specifying the strike price, date of expiration as well as entry price.
What you will get is a chart outlying different profit curves and what you would expect to see when exercised. I took the time to draw trendlines outlining the minimum the price would need to be by set a date to breakeven throughout the life of the option.
What I noticed is that not all options are created equally as we know. But, I never had such a visual as just how different they were. Observe each line, I provided projection for a few points of reference to compare.
Percentage at expiration (set at $6 expiration for comparison), the expiration date and breakeven projection line.
This little experiment is a simple example research first is important. Look First then Leap.
Cheers,
Uni.

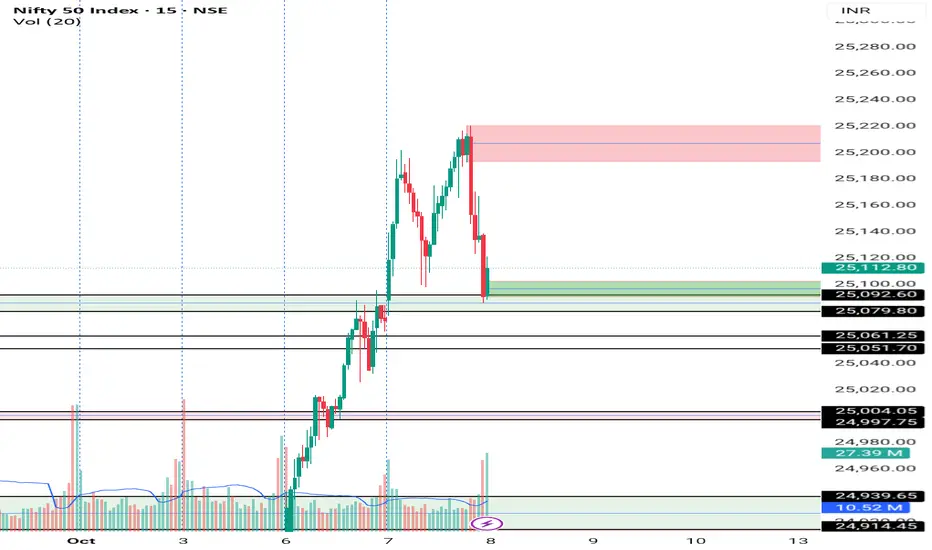
Today supply and demand levels 8th October Today supply and demand levels 8th October
Follow now my channel
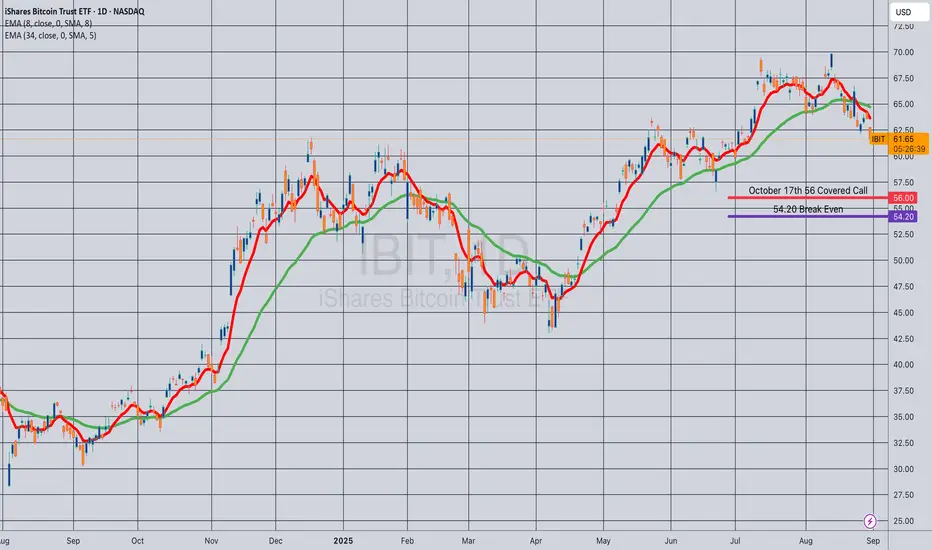
Opening (IRA): IBIT October 19th 56 Covered Call... for a 54.20 debit.
Comments: Selling the -75 call against shares to emulate the delta metrics of a +25 delta short put, but with the built-in defense of the short call and to take advantage of higher IV on the call side than on the put.
Metrics:
Buying Power Effect/Break Even: 54.20/share
Max Profit: 1.80
ROC at Max: 3.32%
Opening (IRA): ETHA October 17th 30 Monied Covered Calls... for a 28.82 debit.
Comments: Starter position. Selling the -75 delta call against shares to emulate the delta metrics of a 25 delta short put, but with the built-in defense of the short call.
Metrics:
Buying Power Effect/Break Even: 28.82/share
Max Profit: 1.18
ROC at Max: 4.09%
Will look to add at intervals, assuming I can get in at strikes/break evens better than what I currently have on.

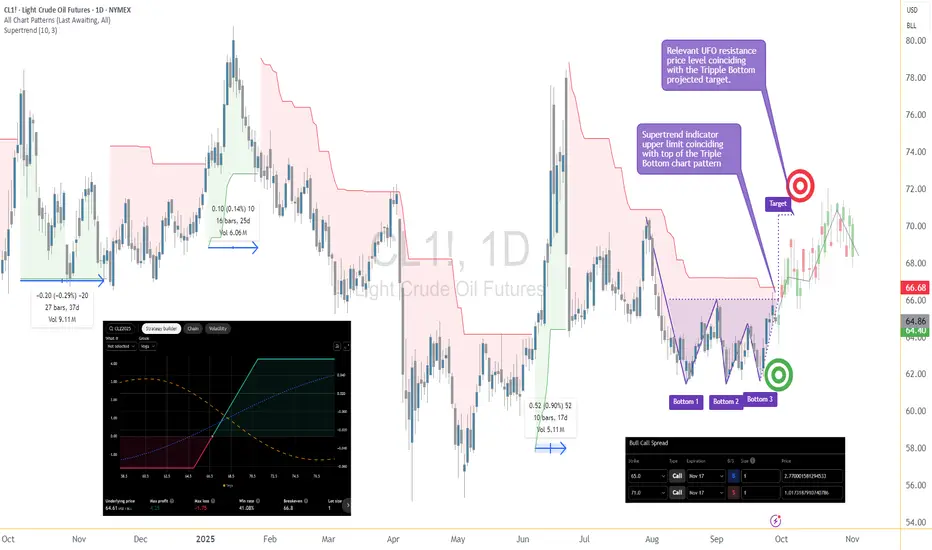
Oil Playing Twister: Triple Bottom or Quadruple Pretzel?A Triple Bottom Walks Into a Bar…
Crude Oil (CL) has been busy doing something traders love and hate at the same time: building bottoms. First, it carved a neat Triple Bottom on the daily chart — textbook stuff. Everyone lined up at 66.68 waiting for the breakout champagne to pop.
But what did price do? Instead of exploding higher, it slammed on the brakes and took a detour straight back to support. Typical CL — always keeping traders on their toes.
Now we’re staring at the possibility of a Quadruple Bottom. Not a typo. Yes, they exist, but you don’t see them every day. Like spotting a unicorn in Times Square.
Why We Care About 66.68
That level isn’t just random. It’s the line where:
The Triple Bottom neckline lives.
The Supertrend upper band hangs out.
And, conveniently, the breakeven of our options spread sits.
In other words: get above 66.68 and suddenly this setup has wings. Target? Around 70.63, where UFO resistance is waiting to greet us.
The Fun Part: Bull Call Spread
Instead of swinging a giant futures bat and risking unlimited pain, we play it smarter with a Bull Call Spread:
Buy the 65 Call (Nov-17)
Sell the 71 Call (Nov-17)
Pay about 1.75 points (≈ $1,750 per standard spread, ≈ $175 if you go micro).
That’s it. Risk capped, reward mapped. Max loss? $1,750. Max gain? $4,250.
And yes, the breakeven is… drumroll… 66.8. Same line as the chart breakout. Love when math and pictures line up.
Plot Twist: Cheaper Now, But…
Here’s the kicker: because price dipped back into support, the spread might actually be cheaper right now. Sounds good, right?
But there’s a catch. Waiting for the breakout confirmation could make the spread pricier later, shrinking your reward-to-risk. Classic trading dilemma: do you want cheaper tickets with less confirmation, or more expensive tickets after the bouncer checks your ID?
Risk in 3 Sentences
Keep your trade size sane.
Don’t marry the setup if price dumps below the bottoms.
If CL rushes toward 70, take the money and run (or at least roll the short strike higher).
Bottom Line
Crude Oil is still building its base. Maybe it’s a Triple Bottom. Maybe it becomes the rare Quadruple Bottom collectors dream about. Either way, the play is the same: breakout above 66.68, aim for 70.63, and do it with a defined-risk Bull Call Spread that doesn’t keep you up at night.
Sometimes the market is dramatic. That’s why we trade it. 🎭
Want More Depth?
If you’d like to go deeper into the building blocks of trading, check out our From Mystery to Mastery trilogy, three cornerstone articles that complement this one:
🔗 From Mystery to Mastery: Trading Essentials
🔗 From Mystery to Mastery: Futures Explained
🔗 From Mystery to Mastery: Options Explained
When charting futures, the data provided could be delayed. Traders working with the ticker symbols discussed in this idea may prefer to use CME Group real-time data plan on TradingView: www.tradingview.com - This consideration is particularly important for shorter-term traders, whereas it may be less critical for those focused on longer-term trading strategies.
General Disclaimer:
The trade ideas presented herein are solely for illustrative purposes forming a part of a case study intended to demonstrate key principles in risk management within the context of the specific market scenarios discussed. These ideas are not to be interpreted as investment recommendations or financial advice. They do not endorse or promote any specific trading strategies, financial products, or services. The information provided is based on data believed to be reliable; however, its accuracy or completeness cannot be guaranteed. Trading in financial markets involves risks, including the potential loss of principal. Each individual should conduct their own research and consult with professional financial advisors before making any investment decisions. The author or publisher of this content bears no responsibility for any actions taken based on the information provided or for any resultant financial or other losses.

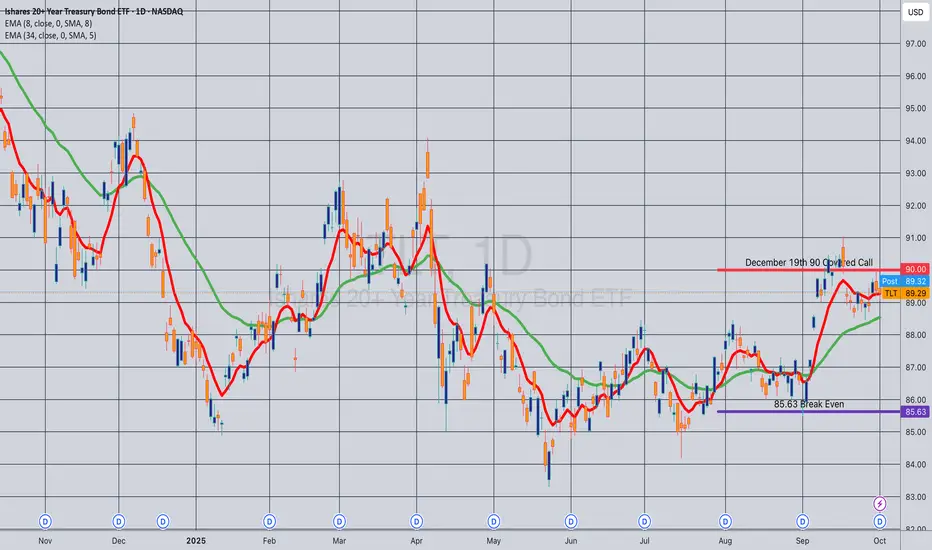
UPDATE: TLT December 19th 90 Covered CallsThis is a continuation of a long-running TLT covered call setup that I started out in April of 2025 (See Post Below) with my current break even shown which I'm doing an update on.
I've generated 6.50 ($650) in free cash flow to date in short call premium + dividends on a buying power effect that was a 92.13 debit/contract when I opened it.
Sitting on my hands here, waiting to roll out the short calls when they're in profit or alternatively to take profit on the setup at or near max and then reset.
Strong Base Formed ! Nifty Positioned for Explosive Move This is the daily timeframe chart of Nifty 50.
Nifty 50 is sustaining above the LOP support zone around 24,400–24,500. The index has formed an ascending broadening wedge pattern at this support and appears to be completing the last leg of the structure.
Support Zone: 24,500–24,550
Resistance Zone: 25,600–25,800
If the support zone holds, we may see higher prices in Nifty 50 in the coming sessions.
Thank you.

Options Blueprint Series [Basic]: Risk-Defined Bull Spread on CLIntroduction
Crude Oil has been carving out a compelling structure on the daily timeframe. The chart has formed a Triple Bottom pattern, a classic base-building formation that often precedes significant directional moves. As prices approach a critical resistance area, traders are watching closely for confirmation of a breakout.
Options provide a unique way to participate in such setups. Instead of buying futures outright — which exposes the trader to potentially unlimited downside — a Bull Call Spread allows participation with limited and predefined risk. Today, we’ll explore how this strategy can be structured on WTI Crude Oil (CL) Options on Futures to target a move higher while keeping risk controlled.
Market Setup
Chart pattern: Triple Bottom on the daily timeframe.
Entry trigger: Breakout above 66.68, where the top line of the Triple Bottom coincides with the upper band of the Supertrend indicator.
Target: ~70.63, which aligns with both the Triple Bottom projected objective and a relevant UFO (UnFilled Orders) resistance area.
Trend context: A successful breakout here would not only complete the Triple Bottom pattern but also suggest a broader trend reversal on the daily chart.
This confluence of technical signals makes 66.68 a price level worth paying attention to.
The Strategy: Bull Call Spread
A Bull Call Spread involves buying one call option with a lower strike and simultaneously selling another call option with a higher strike, both with the same expiration.
Buy: CL Nov-17 65 Call (cost ≈ 2.77)
Sell: CL Nov-17 71 Call (credit ≈ 1.02)
Net debit (cost): ≈ 1.75 points
Since each CL options contract represents 1,000 barrels of oil, the cost of this spread is about $1,750 per spread (subject to commissions).
Why November 17?
The timing matches the behavior of prior Supertrend cycles. The longest green cycle shown on the chart lasted about 37 trading days. By selecting Nov-17 expiration, the position allows sufficient time for a breakout and follow-through, while not overpaying for excess time value.
Risk/Reward Profile
From the risk graph:
Maximum Profit: ≈ 4.25 points, or $4,250 per spread.
Maximum Loss: ≈ 1.75 points, or $1,750 per spread.
Reward-to-Risk Ratio: ~2.4:1.
Breakeven: ~66.8 (very close to breakout level).
The breakeven location is important: it aligns almost exactly with the breakout trigger on the chart. This means that if the technical pattern validates, the option structure begins to work immediately.
The reward-to-risk ratio above reflects the pricing available at the time of building the spread. If a trader waits for confirmation of the breakout before entering, option premiums may rise, making the Bull Call Spread slightly more expensive. In that case, the risk-to-reward ratio would be somewhat less favorable, though the trade-off is higher confirmation of the technical signal.
Trade Application
Entry trigger: Now, or confirmed breakout above 66.68 depending on trader style.
Target: ~70.63, aligning with the Triple Bottom projection and UFO resistance.
Stop-loss consideration: If prices fall back below the Triple Bottom lows, the breakout thesis would be invalidated.
Here, the options spread itself already caps the maximum loss at $1,750 per spread. Still, traders may choose to exit earlier if the chart setup fails, avoiding full risk.
The defined-risk nature of the spread helps enforce discipline, as the worst-case scenario is known from the outset.
Contract Specs & Margin Considerations
WTI Crude Oil contracts at CME come in two main forms:
Standard CL Contract: Represents 1,000 barrels of crude oil. A single point move = $1,000 P&L impact.
Micro CL Contract (MCL): Represents 100 barrels of crude oil. A single point move = $100 P&L impact.
Both contracts offer powerful ways to trade Crude Oil, and traders also have access to options on the Micro CL contract. This means the same Bull Call Spread structure can be applied with much smaller capital outlay. Instead of ~$1,750 risk per spread with the standard CL options, the risk would be about $175 per spread using MCL options.
The availability of Micro contracts and options provides traders with greater flexibility to tailor exposure to account size and risk tolerance, while still benefiting from the same strategic advantages.
Margin requirements vary depending on the broker and clearing firm, but options spreads like this one are far more capital-efficient compared to holding outright futures. The premium paid becomes the required margin ($1,750 or $175 in this case) as it defines the total risk, without margin calls tied to daily fluctuations.
Risk Management
The hallmark of this Bull Call Spread is defined risk. Unlike a naked long call, where premium decay can erode value quickly, the short 71 Call helps reduce the upfront cost and lowers time decay exposure.
Key considerations:
Position sizing: Limit risk per trade to a fraction of total trading capital.
Time decay management: If the move happens quickly, consider taking profits early instead of holding until expiration.
Adjustment potential: If CL approaches 70 quickly, traders may roll the short call higher to extend potential gains.
Risk management is not just about setting stops; it’s also about designing positions where the worst-case scenario is tolerable before the trade is entered. This Bull Call Spread embodies that principle.
Conclusion
The WTI Crude Oil market is at a pivotal point. With a Triple Bottom base, a breakout above 66.68 could carry prices toward the 70.63 region, where unfilled orders and technical projections converge.
A Bull Call Spread on the Nov-17 expiration offers a structured way to engage with this potential move. It balances opportunity with defined risk, aligning the technical chart setup with the capital efficiency of options on futures.
As always, this is an educational case study designed to highlight how options can be used to structure trades around market scenarios.
When charting futures, the data provided could be delayed. Traders working with the ticker symbols discussed in this idea may prefer to use CME Group real-time data plan on TradingView: www.tradingview.com - This consideration is particularly important for shorter-term traders, whereas it may be less critical for those focused on longer-term trading strategies.
General Disclaimer:
The trade ideas presented herein are solely for illustrative purposes forming a part of a case study intended to demonstrate key principles in risk management within the context of the specific market scenarios discussed. These ideas are not to be interpreted as investment recommendations or financial advice. They do not endorse or promote any specific trading strategies, financial products, or services. The information provided is based on data believed to be reliable; however, its accuracy or completeness cannot be guaranteed. Trading in financial markets involves risks, including the potential loss of principal. Each individual should conduct their own research and consult with professional financial advisors before making any investment decisions. The author or publisher of this content bears no responsibility for any actions taken based on the information provided or for any resultant financial or other losses.
The Options Mirage: The Jackpot That’s Rigged Against YouMost retail traders fall in love with options because they seem to offer the impossible: with just a few hundred dollars you can dream of outsized returns. Fast money, easy money—at least that’s the story. With the right broker account and a handful of trades, the dream of becoming rich feels just around the corner.
What you’re not told—and what few truly understand given the complexity of the product—is that the “explosive payout” is not an opportunity. It’s a price. A very high one. And often inflated by the industry itself, knowing that the average investor (or rather, gambler) has no real way to calculate what they’re actually paying for. What you’re really buying is access to an extremely low probability of success, dressed up as a sophisticated strategy.
Yes, it’s the same psychology that drives lotteries and sports betting. And in finance, the odds aren’t any kinder.
The Baseline: the Where
At its simplest, speculation is about anticipating an up or down move in price.
Think it’s going up? Buy and aim to sell higher.
Think it’s going down? Sell and aim to buy back lower.
It sounds simple, but anyone with more than a month of trading experience can tell you it’s anything but. No one can predict the future with certainty. Still, this is at least a binary game: two mutually exclusive outcomes, like flipping a coin.
In technical terms, the market starts as a 50/50 distribution. With skill, analysis, and discipline, you might bias those odds slightly—say, 60/40 in your favor. That bias, repeated consistently, is what we call an edge. And with an edge, the path to long-term success is paved.
The Illusion of Acceleration
But let’s be honest: who wants to grind out a 60/40 edge slowly? We’re here for the Lamborghini, right? And the sooner the better.
That’s where the industry steps in with its “solution”: options. The promise is seductive—leverage the process, accelerate the outcome. With little money down, you can aim for massive returns. What’s not to like?
The problem is that the acceleration doesn’t come for free. To deliver those explosive payouts, the game adds layers of complexity.
From Where… to How and When
In options, you don’t just need to be right about where price is going.
You also need to be right about how it moves. That’s volatility—the speed and amplitude of the move. Even if you guess the direction correctly, if the move isn’t strong enough to beat strike + premium, you lose.
And then comes the when. Options expire. Time works against you. With the rise of 0DTE options, this window has shrunk to a single day. You might be perfectly right on direction and volatility—but if it happens tomorrow instead of today, your trade is worthless.
Now here’s the key point: this isn’t additive complexity. It’s multiplicative. Each layer collapses your probability of success exponentially. Even though the mathematical proof could be enlightening, I have promised not to use heavy math in this blog. All you need to know is this: in the majority of cases, that collapse in probability is not evenly compensated by the outsized payout. And this is exactly what most retail traders fail to perceive.
It’s not just that you’re playing a harder game—it’s that you’re playing a biased one, where the odds are stacked even further against you.
The Lottery Bias: The Cognitive Trap
Here’s where psychology plays its cruelest trick. The lower the probability of success, the higher the payout offered. In fact, it’s not even the full payout you deserve—it’s a discounted, haircut payout, cleverly packaged so you don’t notice because the potential number is so large. And that number lights up the brain like a jackpot.
The industry knows this. It builds its business on the fact that humans systematically overestimate tiny probabilities and underestimate the certainty of losing. Retail traders convince themselves they’re being clever: risking little for the chance at something huge. But the math is merciless—the expected value is brutally negative.
The market is not handing you an edge. It’s dismantling any possibility you had of one. That giant payout you see? It’s not a gift—it’s a warning label.
And yes, I know you can point to stories about the guy who hit the jackpot, who “proved the math wrong.” But let me ask you this: do you know what survivorship bias is? If you don’t, and you’re trading options, here’s some professional advice for free—go and read about it before you place your next trade.
The Real Path to the Lambo
What gets sold as “smart leverage” is, in truth, just a lottery ticket wearing a suit. The Lambo doesn’t come from hitting jackpots. It comes from consistency—from repeating disciplined decisions with positive expectancy until compounding does its quiet but powerful work.
And yes, I know most traders are in a hurry. The good news? The process can be accelerated—but not by gambling on options with negative expectancy. It can be accelerated using technical, rational tools. Once an edge is established, leverage makes sense. That’s where concepts like the Kelly criterion come in: scaling growth aggressively, but without walking straight into ruin. (I’ve already written about Kelly earlier in this blog: here.)
Conclusion
We’ve stripped the illusion bare: more conditions don’t make you smarter, they make you less likely to succeed. What feels like a shortcut is nothing more than a statistical mirage—the financial equivalent of a lottery ticket, marketed to you as a “highway to riches,” exploiting your belief that complexity equals intelligence.
Unfortunately, the narrative is powerful, because it preys directly on cognitive bias. I know I’m swimming against the tide here. I know this post won’t go viral. I don’t expect many to believe what the math has to say about options trading.
But maybe, just maybe, a small number of traders reading this will see beneath the surface and save their time, energy, and money for better pursuits. If that’s you, then this post has already done its job.
If you can resist the mirage and stick to building real edges, you’ve already won a key battle—and most likely saved yourself a costly trading lesson.

Opening (IRA): ETHA November 21st 25 Monied Covered Call... for a 23.60 debit.
Comments: Adding to my position at strikes/break evens better than what I currently have on (October 17th 30 Covered Calls; November 21st 29 Covered Calls). Selling the -75 delta call against shares to emulate the delta metrics of a 25 delta short put, but with the built-in defense of the short call and to take advantage of higher IV on the call side.
Metrics:
Buying Power Effect/Break Even: 23.60/share
Max Profit: 1.40 ($140)
ROC at Max: 5.93%

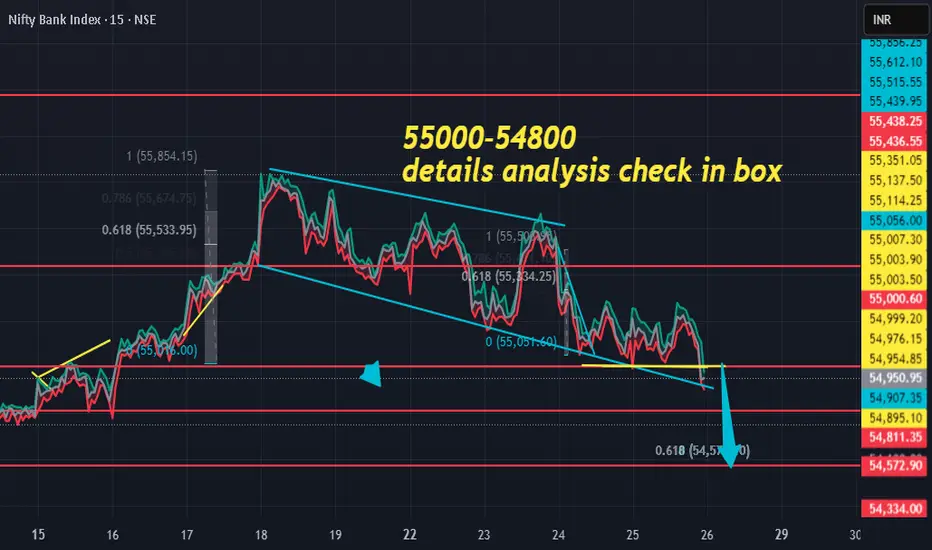
banknifty setup for 26/sept/2025banknifty trend is negative now 55000 is major support .
55800/55000 both level active for put side
tgt -200/400 points.
call only above 55080 ok tgt 55200/55400
dont jump without active levels .
dear retail traders beat the sideways trape an follow my setup
NVDA NVIDIA Corporation Options Ahead of EarningsIf you haven`t bought NVDA before the previous earnings:
Now analyzing the options chain and the chart patterns of NVDA NVIDIA Corporation prior to the earnings report this week,
I would consider purchasing the 150usd strike price Calls with
an expiration date of 2025-9-19,
for a premium of approximately $13.35.
If these options prove to be profitable prior to the earnings release, I would sell at least half of them.
