Oracle (ORCL) – TikTok US Joint Venture PlayTikTok has agreed a new US structure where Oracle is a core partner in the US joint venture, responsible for hosting US user data and key parts of the algorithm and security stack. This cements Oracle’s role as a strategic cloud and data‑governance provider, giving the market a fresh fundamental narrative beyond legacy databases.
Oracle

Oracle - Seeking SymmetryLet’s examine the corrective impulsive move that began in September 2025.
When breaking this movement down into waves and sub-waves, we can observe multiple waves that are roughly equal in size at both the beginning and the end of the structure, marked in red .
If the wave count is correct, one final wave is still missing - its projected size is marked in blue .
This becomes especially evident if we extend a flat correction from the last completed fifth wave and take into account that it typically retraces 50–60% of the prior wave. Under these assumptions, the structure aligns well.
Additionally, when applying Fibonacci levels from the first impulsive wave, they converge with the projected completion area of the move.
Conclusion:
The move is targeting the 150 level. From that area, a new phase of price action is expected to begin.
---
Please subscribe and leave a comment.
You’ll get new information faster than anyone else.
---

COREWAEVE WAS A SCAM IPOSo expect it to make all time lows.
The company was only IPO'd based on a fake order by #NVIDIA.
INSIDERS are dumping.
oN yOu.
This is a roundtripooor.

Oracle - This stock is heading higher!🚀Oracle ( NYSE:ORCL ) is heading higher now:
🔎Analysis summary:
Yes, over the course of the past couple of weeks, we witnessed a harsh drop of -50% on Oracle. But looking at the higher timeframe, Oracle is just creating a bullish break and retest. If we see bullish confirmation soon, Oracle will create new all time highs.
📝Levels to watch:
$200
SwingTraderPhil
SwingTrading.Simplified. | Investing.Simplified. | #LONGTERMVISION

Oracle - A very clear buy signal!🚪Oracle ($NASDAQ:ORCL) is just 100% bullish:
🔎Analysis summary:
For the past two decades, Oracle has been in a very strong bullish market. And with the recent -40% correction, this trajectory did not change at all. In fact, we are just witnessing a bullish all time high break and retest so Oracle will create another rally quite soon.
📝Levels to watch:
$200
SwingTraderPhil
SwingTrading.Simplified. | Investing.Simplified. | #LONGTERMVISION

Oracle (ORCL) Shares Fall Below $180Oracle (ORCL) Shares Fall Below $180
Yesterday, Oracle (ORCL) shares dropped by 5% following reports that investment firm Blue Owl Capital had withdrawn from financing a $10bn data centre project in Michigan.
The collapse of the deal raises questions over Oracle’s ability to meet its commitments under large-scale contracts (including a $300bn agreement with OpenAI) without further straining its balance sheet.
According to media reports, the company’s total debt has climbed to $111bn. The recent share price decline reflects growing concerns that Oracle’s “credit bubble” may struggle to withstand the AI arms race, making it increasingly difficult for the company to secure funding for its ambitious construction projects.
As a result:
→ ORCL shares fell below $180 for the first time since mid-June;
→ the chances of returning to the previously established ascending channel now look slim.
However, technical analysis of the ORCL chart highlights four factors that could support a rebound:
1 → The price has filled the bullish gap formed in mid-June;
2 → The share price has fallen by around 50% from its all-time high set in early September, which may attract risk-tolerant buyers looking to pick up a stock that has halved in value;
3 → The price is trading close to the lower boundary of the descending channel that frames the current decline;
4 → Yesterday’s surge in trading volumes may signal panic selling, which often precedes a rebound.
A fifth factor could be an oversold signal from your chosen oscillator.
That said, even if ORCL shares begin to recover, the upside may be capped by a key resistance zone (marked in blue), which formed after a bearish gap above the psychological $200 level following the quarterly earnings release.
This article represents the opinion of the Companies operating under the FXOpen brand only. It is not to be construed as an offer, solicitation, or recommendation with respect to products and services provided by the Companies operating under the FXOpen brand, nor is it to be considered financial advice.

Is AVGO’s drop over yet?Oracle AVGO — Price Analysis
Chart A (Daily):
Price had been oscillating within an 80-day channel, and after failing to reach the channel’s upper boundary due to repeated divergences, it finally broke below the bullish channel with two strong, high-volume daily candles—the highest selling volume seen on this chart in the past 68 days—and closed below the channel.
Chart B (4H):
This structure is also visible on the 4-hour chart as a wedge pattern, where price initially experienced a fake breakout to the upside and has now broken the lower boundary of the wedge.
Outlook:
This corrective move could potentially continue at least to the gap zone highlighted on the chart, which is a significant gap, and possibly extend further to the support zone at the lower end of the extended channel. Once price reaches these areas, we should watch for potential reactions.
Note: This analysis will be updated as the situation develops.
Follow me on TradingView for more analyses and live stock trades.
NASDAQ:AVGO

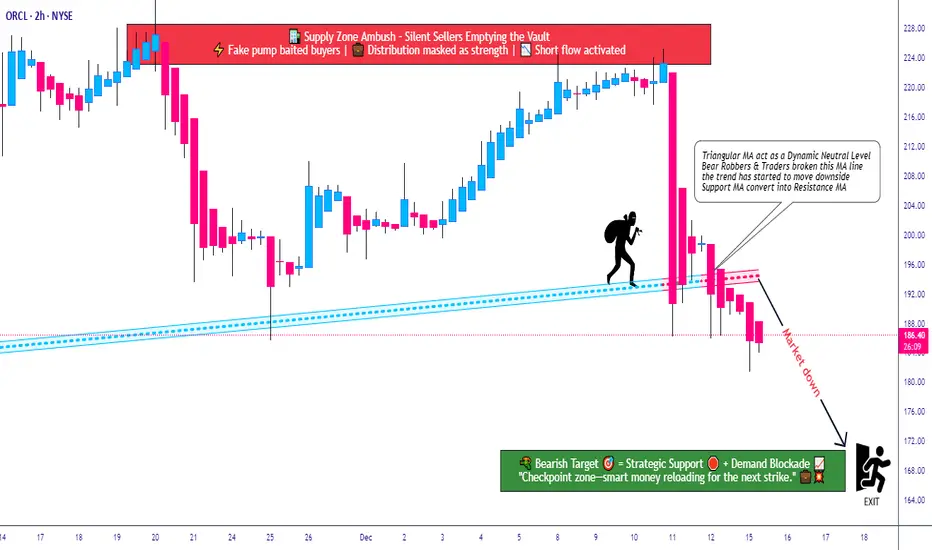
ORCL Breakdown Zone Activated — Downside Pressure Builds!🔻 ORCL Bearish Breakdown Playbook | Smart Money Trap Ahead? 🔻
📌 Asset
ORCL — Oracle Corporation
NYSE Exchange | Stock Market
Trading Style: Swing / Day Trade
📉 Market Bias
Bearish Structure Confirmed
Price action confirms a Triangular Moving Average (TMA) breakdown, signaling momentum exhaustion and increasing downside probability. Sellers remain in control as volatility expands after the structure break ⚠️📊
🎯 Trade Plan (Thief Style – Market Adaptive)
🔹 Entry:
Market-responsive entry — no fixed price level.
(Allow price to confirm direction; avoid emotional entries 🧠)
🔹 Stop Loss:
🛑 Thief SL reference: 205.00
This level is shared for educational context only. Risk management remains fully trader-dependent.
📝 Note:
Dear Ladies & Gentlemen (Thief OG’s), this is not a recommendation to use only this stop loss. You manage risk according to your own strategy and comfort.
🔹 Target Zone:
🎯 170.00
This level aligns with:
✔ Strong historical support
✔ Oversold conditions
✔ Potential liquidity trap
✔ Correlation-based confluence
⚠️ As price approaches this zone, partial or full profit protection is advised. Smart exits matter more than perfect targets.
📝 Note:
Dear Ladies & Gentlemen (Thief OG’s), this target is not mandatory. Adapt your take-profit based on live price behavior and personal risk rules.
🔗 Correlated Markets to Watch 👀
📌 NASDAQ:QQQ – Nasdaq weakness often amplifies downside pressure on ORCL due to tech sector correlation.
📌 NASDAQ:MSFT – Relative weakness here can signal broader enterprise-tech selling.
📌 NASDAQ:AAPL – Risk-off sentiment in mega-caps may accelerate momentum continuation.
📌 TVC:DXY – Dollar strength can pressure equities, supporting bearish follow-through.
➡️ If correlated assets show risk-off behavior, ORCL downside probability increases.
🧠 Key Takeaways
✔ Trend bias favors sellers
✔ Breakdown structure validated
✔ Risk management > prediction
✔ Adapt to price, don’t marry levels
⚠️ Disclaimer
This is a thief-style trading strategy, shared for fun and educational purposes only.
Trading involves risk. You are fully responsible for your decisions and outcomes.
✨ “If you find value in my analysis, a 👍 and 🚀 boost is much appreciated — it helps me share more setups with the community!”
#ORCL #Oracle #BearishSetup #StockMarket #SwingTrading
#DayTrading #TechnicalAnalysis #SmartMoney
#NYSE #TradingView #RiskManagement #ThiefStyle
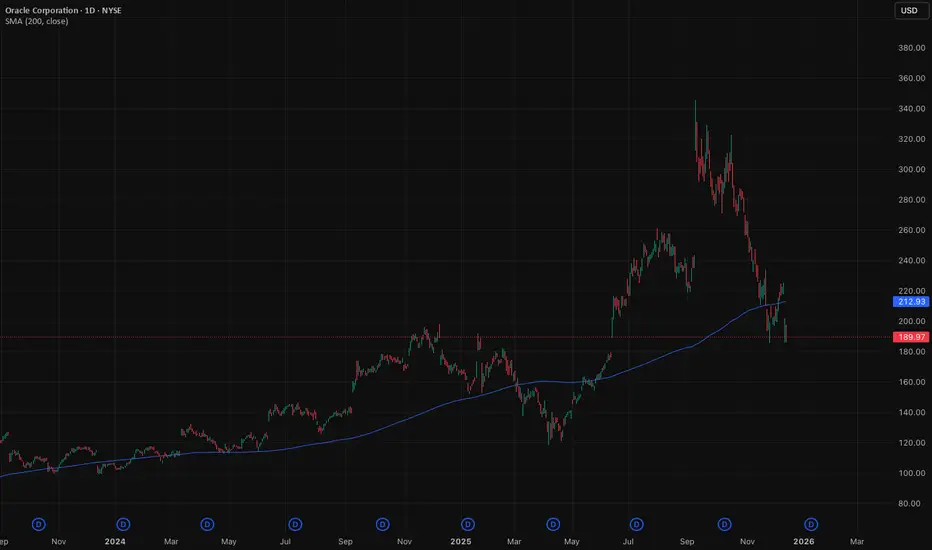
Oracle down, more to comeWe're upgrading our Oracle recommendation and maintaining our Short call. The stock is down around 30% since our initial note in September , and we think there is more downside now that the price is trading sub $200 per share.
If the stock doesn't bounce back above the 200-day moving average, we could see more downside into the mid $100 per share range. Potentially finding support around $120-125 range mark.
The forecasts provided herein are intended for informational purposes only and should not be construed as guarantees of future performance. This is an example only to enhance a consumer's understanding of the strategy being described above and is not to be taken as Blueberry Markets providing personal advice.
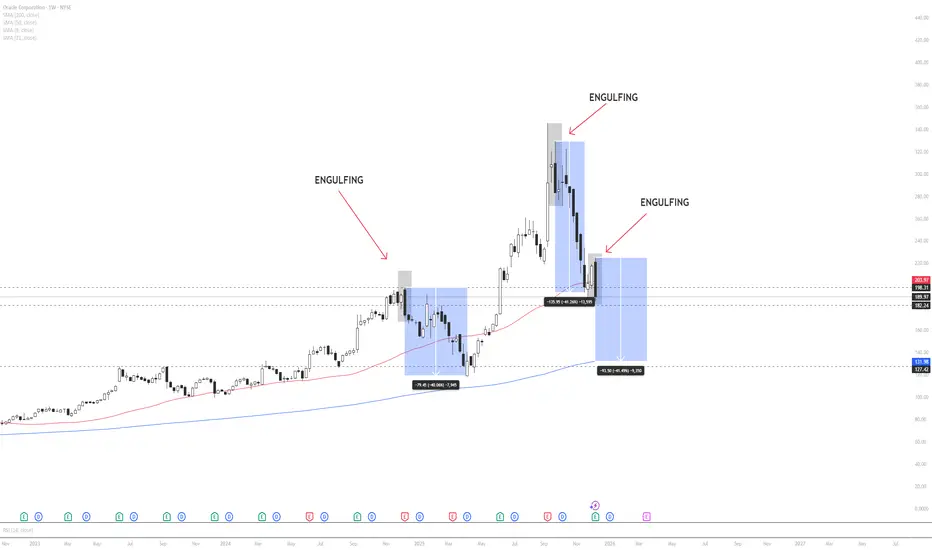
ORCL – Weekly Technical & Historical AnalysisOracle is currently trading in a weekly consolidation (flat) zone, indicating a neutral market structure. However, price has closed below the 50-period moving average , which often signals a shift in medium-term momentum.
A key technical development is the appearance of a weekly bearish engulfing candle, a pattern that historically precedes sharp downside moves in ORCL.
When analyzing previous occurrences of similar engulfing patterns, price declined by approximately 40% in the first instance and showed a nearly identical drawdown in the second instance. If historical behavior repeats , price may continue lower toward the 200-period moving average and the major support zone marked on the chart, which aligns closely with a projected ~40% correction.
Markets often exhibit recurring behavioral patterns, especially in higher timeframes. For this reason, downside risk remains elevated unless price reclaims the 50 MA and invalidates the engulfing structure.
This analysis is based on historical probability and technical structure and is not financial advice. Traders should manage risk accordingly.
Oracle (NYSE: $ORCL) Tanks After Revenue MissOracle Corporation (NYSE: ORCL) suffered a sharp selloff after its latest quarterly earnings report, with shares plunging more than 16% as the market reacted negatively to a revenue miss. The decline erased months of gains and dragged the stock back below levels last seen before its major September rally. Despite the market panic, the underlying fundamentals reveal a more nuanced story.
Oracle’s reported revenue once again fell short of analyst expectations—continuing a trend seen in previous quarters. In Q1, the company also missed both earnings per share and revenue estimates, though optimism around its cloud growth overshadowed the weakness at the time. This quarter, without a headline-grabbing cloud announcement, investors reacted more aggressively to the top-line disappointment.
However, Oracle’s Remaining Performance Obligation (RPO)—a key forward-looking metric reflecting future contracted revenue—beat expectations significantly. The company reported $523 billion in RPO, surpassing the Street’s projection of $500 billion. Analysts, including Wedbush’s Dan Ives, argue that the selloff is overstated and does not reflect the long-term growth trajectory of Oracle’s AI-driven cloud strategy. Oracle remains deeply integrated in AI infrastructure through its massive multi-year deals, including the $300 billion computing partnership with OpenAI.
Technical Analysis
The ORCL chart shows a decisive breakdown from a critical support zone around $210–$215. This level, previously a strong demand area, failed to hold as heavy selling pressure drove the stock into a deeper correction. The breakdown was accompanied by elevated volume, confirming strong bearish participation.
Price is now sitting within a broader weekly support range near $190–$200. A bounce from this zone could trigger a recovery push toward $300 and eventually $345 if sentiment shifts. However, failure to reclaim the demand region leaves the path open for a deeper slide toward $121, where the next major structural support lies.

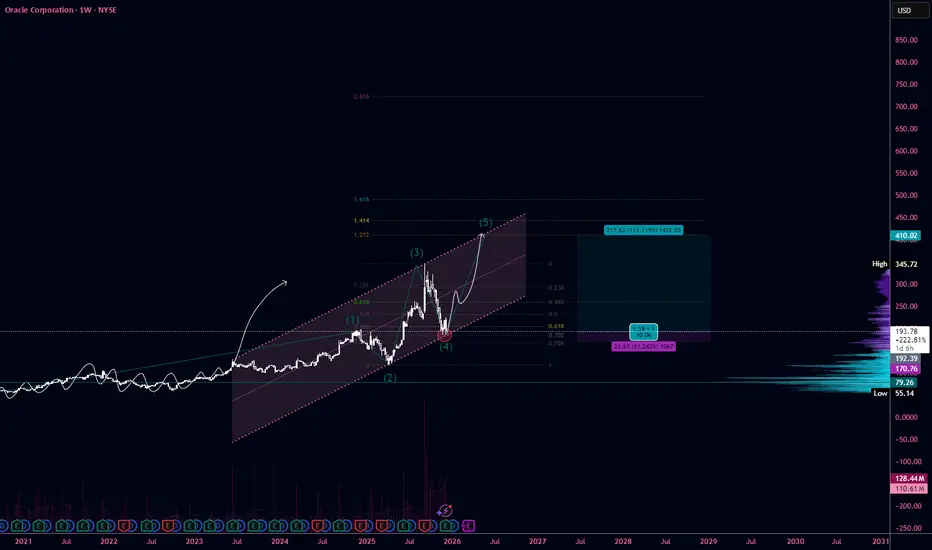
#ORCL R:R 1:10 The start of the fifth wave target $400NYSE:ORCL
TF: 1W
Oracle continues to move within a well-defined ascending channel, forming a clean 5-wave impulsive structure. The price is currently coming out of a completed wave (4) correction, which perfectly tapped into the key retracement zone:
• 0.618–0.786 Fibonacci retracement
• High-volume node on VPVR
• Lower boundary of the rising channel
This creates a strong technical cluster that supports a bullish continuation.
••Main Idea
I expect a full development of the final wave (5), which may extend further as Oracle continues to benefit from cloud growth, AI infrastructure demand, and corporate IT spending.
•••Why This Looks Like Wave (5)
1.Wave (3) was strong and impulsive with a clear vertical expansion.
2.Wave (4) formed a prolonged and corrective pullback — typical for large caps.
3.VPVR shows a dense demand cluster at the correction bottom.
Price respected the long-term trendline and re-entered the channel.
ORCL long-term TAWatch out for Oracle to break the current uptrend on weekly, it's getting weaker along with the distribution on daily which has started about a month ago and still ongoing. The current weekly uptrend is still holding up but it's getting weaker and in danger for a possible downtrend, for now we need more time to see the confirmation.
Watch the blue lines as pivots to hold the support.

Oracle (ORCL) Share Price Rebounds Ahead of Earnings ReleaseOracle (ORCL) Share Price Rebounds Ahead of Earnings Release
Oracle is due to publish its quarterly results today after the close of the main trading session. Analysts are expecting solid year-on-year growth compared with the same period last year:
→ Revenue: forecast to rise by around 15% to $16.15–16.2 billion.
→ Earnings per share (EPS): expected at $1.63–1.65, up roughly 11%.
At the same time, the market’s focus will be on the company’s plans in two key areas:
→ Order backlog growth: investors are looking for confirmation that demand for AI infrastructure remains strong. Previously, orders exceeded $500 billion.
→ Debt and capital expenditure (capex): Oracle is spending aggressively on data centres (capex could rise to as much as $25 billion per year) while taking on additional debt. This has raised concerns that costs may be increasing faster than the actual profits generated from AI.
Today’s results are particularly important in light of the market reaction to the previous earnings release.
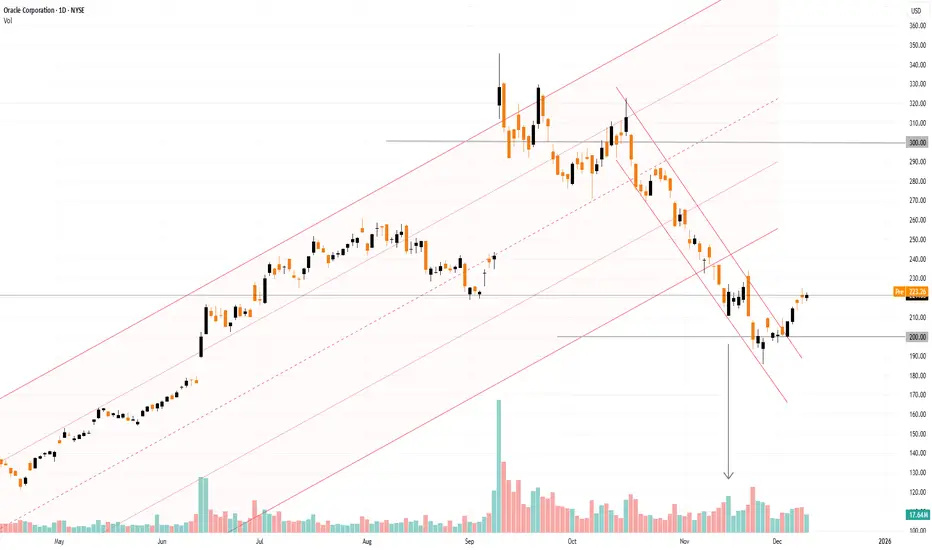
On 15 September, we noted that ORCL shares surged with a bullish gap above the psychological $300 level. Since then, however, the share price has fallen by more than 30%. One possible explanation is that “smart money” used the spike in speculative demand to lock in profits on long positions — a view supported by exceptionally high trading volumes. Once demand faded, the price moved lower within a descending channel.
Within the broader long-term channel (shown in orange), the price briefly broke below the lower boundary but failed to follow through. Meanwhile, the narrowing candle body on 21 November (marked by the arrow), combined with a spike in volume, may suggest that institutional investors were absorbing selling pressure, potentially signalling expectations of higher prices ahead.
Positive signs include:
→ a false bearish break below the psychological $200 level;
→ a break of the red downward trajectory;
→ a rise in ORCL shares in pre-market trading today.
If Oracle’s actual results and management’s outlook impress investors, the ORCL share price could move back into the orange ascending channel.
This article represents the opinion of the Companies operating under the FXOpen brand only. It is not to be construed as an offer, solicitation, or recommendation with respect to products and services provided by the Companies operating under the FXOpen brand, nor is it to be considered financial advice.
Is Oracle’s AI Growth Hitting a Structural Wall?Oracle Corporation (ORCL) stands at a defining juncture where aggressive cloud expansion collides with the physical limits of infrastructure scaling. Despite a strategic pivot that has positioned Oracle Cloud Infrastructure (OCI) as a primary engine for artificial intelligence workloads, the stock has retreated approximately 35% from its September peak. This volatility reflects a market grappling with a dual narrative: the immense promise of a $300 billion AI pipeline and the operational fragility of concentrating heavily on a single client, OpenAI.
Geopolitics and Geostrategy: The Sovereign Advantage
Oracle has effectively weaponized data sovereignty as a competitive moat. Unlike hyperscale rivals often viewed with skepticism in Europe and Asia, Oracle’s dual-region sovereign cloud strategy allows governments to retain strict legal control over data residency. This approach insulates a portion of Oracle’s revenue from protectionist policies and US-China trade tensions, positioning OCI as the "neutral" vendor of choice for state-level actors requiring air-gapped security for sensitive workloads.
Industry Trends and Macroeconomics: The Capacity Wall
The macro environment presents a paradox for Oracle. High interest rates have inflated the cost of debt just as the company accelerates capital expenditures (CapEx) to build AI data centers. Simultaneously, the industry faces a hard physical ceiling: power availability. In key markets like Northern Virginia and Silicon Valley, grid connections face multi-year delays. Oracle’s ability to secure gigawatt-scale power for its "Stargate" class projects will be the primary determinant of whether it can convert its record bookings into recognized revenue before 2027.
Business Models: The OpenAI Concentration Risk
Oracle’s shift from license-based legacy software to consumption-based cloud revenue is accelerating, but the quality of this revenue is under scrutiny. Recent disclosures reveal that a significant percentage of the company’s Remaining Performance Obligations (RPO) is tied to OpenAI’s massive infrastructure demands. While this validates OCI’s technical prowess, it introduces binary counterparty risk. If OpenAI faces regulatory headwinds or funding slowdowns, Oracle’s growth narrative could face an abrupt repricing.
Technology, Cyber, and Patent Analysis
Technologically, Oracle differentiates itself through automation. Its Autonomous Database utilizes machine learning to self-patch and self-tune, theoretically reducing the cyber attack surface by eliminating human error—the leading cause of data breaches. Patent analysis suggests Oracle is aggressively protecting this "self-driving" database architecture, aiming to lock in enterprise clients who prioritize security over the raw compute cost advantages offered by generic cloud providers.
Management and Leadership: The Aggressive Pivot
Under the stewardship of Larry Ellison and Safra Catz, Oracle’s culture remains unapologetically aggressive. The leadership has demonstrated a willingness to sacrifice short-term margins for long-term capacity, a strategy reminiscent of Amazon’s early AWS days. However, this high-stakes bet requires flawless execution in supply chain management, particularly in securing Nvidia GPUs amidst global shortages.
Stock Performance and Technical Status
Technically, ORCL is testing critical support zones after its sharp 35% correction. The sell-off was triggered by the realization that bookings growth does not equal immediate cash flow. Investors are currently demanding proof of "broad-based demand"—evidence that OCI is winning enterprise clients beyond the headline-grabbing AI labs. Until this diversification is proven, the stock remains vulnerable to volatility.

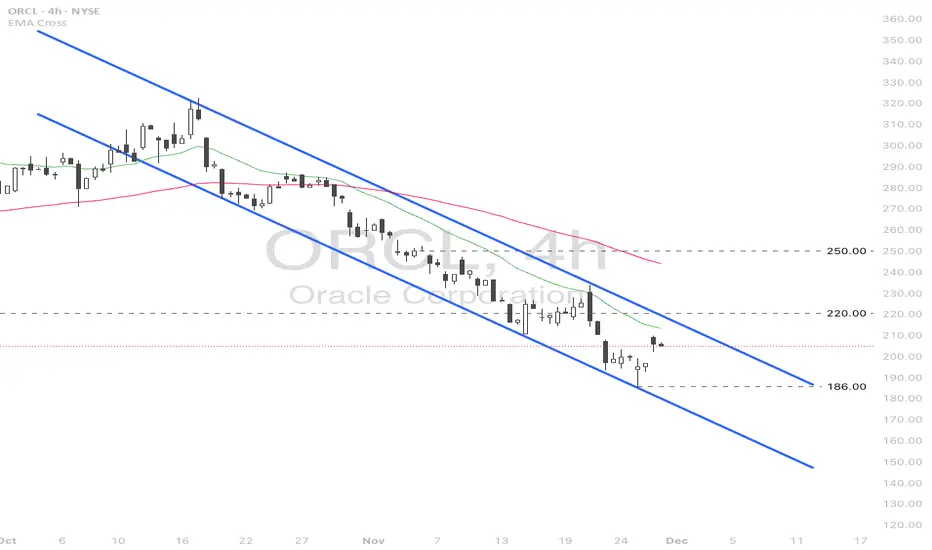
Oracle (ORCL) rebounded on renewed AI momentum.
Surging Alphabet (GOOGL) and revived Nvidia (NVDA) stock prices are leading the AI momentum. Oracle (ORCL), which fell over 40% from its high on amplified doubts over its 300 bln USD computing contract with OpenAI, saw a rebound.
Deutsche Bank assessed the drop in ORCL stock as providing an attractive entry point. They valued the current price as reflecting no positives, citing EPS (ex-OpenAI costs) at 17 USD and FCF at 31 bln USD, both below company guidance.
HSBC also issued a Buy rating on ORCL, expecting various financing strategies for data center costs to be announced, thereby mitigating balance sheet burden and diversifying risk.
ORCL briefly tested the 186.00 low before slightly rebounding. The price remains within the descending channel and below the bearish EMAs, indicating the potential downtrend extension. If ORCL breaches above EMA21 and 220.00, the price could advance toward the next resistance at 250.00.
Conversely, if ORCL fails to close above EMA21, the price may retreat toward the following support at 186.00.
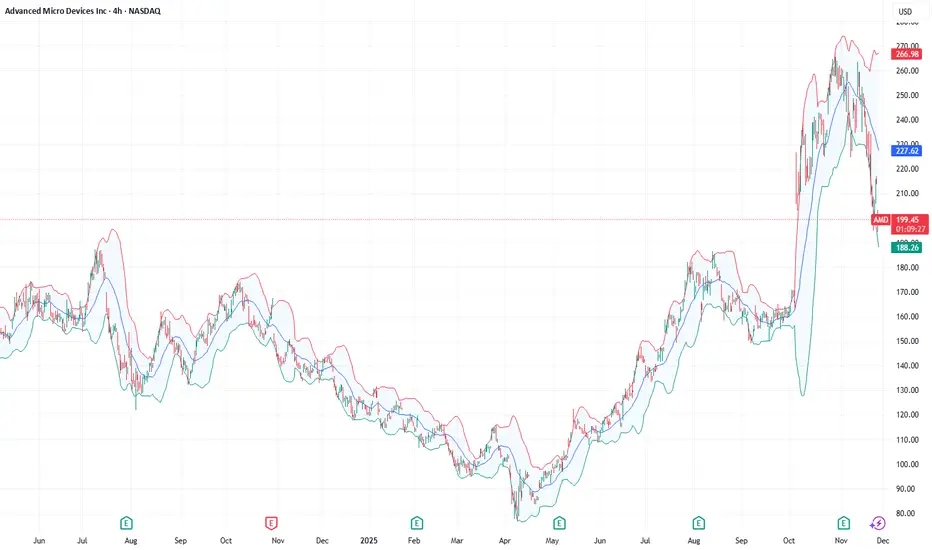
Tech giants and a crypto exchange under pressure!Recently, the stocks of Advanced Micro Devices (#AMD), Coinbase Global Inc. (#Coinbase), Oracle Corp. (#Oracle), NVIDIA Corp. (#NVIDIA), and Arm Holdings plc (#Arm) have come under pressure amid a reassessment of artificial intelligence (AI) valuations and growing caution toward risk assets. Investors are reacting nervously to the cost of capital, the pace of AI monetization, and the resilience of demand within adjacent ecosystems.
5 Factors Behind the Decline:
#AMD (−10.33%) — profit-taking after a strong rally and growing doubts about the scalability of server GPUs. Additional pressure comes from margin risks driven by aggressive capital spending and competition in high-performance GPU accelerators.
#Coinbase (−10.31%) — a weakening crypto market reduces trading volumes and fee revenue. Regulatory risks and volatile client flows deepen the valuation discounts.
#Oracle (−10.29%) — concerns over rising debt levels amid heavy investments in cloud and AI infrastructure. The market fears shrinking free cash flow and pressure on valuation multiples if growth slows.
#NVIDIA (−4.08%) — “overvaluation + maxed-out expectations”: even strong earnings reports fail to calm concerns about cyclical demand in data centers. Added to this are risks of margin normalization and potential inventory build-ups among customers.
#Arm (−3.02%) — high sensitivity to sell-offs in the “AI sector,” especially given its premium valuation. Investors question how quickly the royalty-based model can translate into stable accelerated growth.
If concerns about AI-related spending and uncertainty around interest rates persist, stocks inflated by AI and crypto market expectations may continue to fall. Further capital outflows or rising borrowing costs would serve as triggers for additional downside.
FreshForex analysts see potential for a correction in #AMD, #NVIDIA, #Arm, #Oracle, and #Coinbase due to slowing AI infrastructure growth and persistently high capital costs. For #Coinbase , elevated crypto market volatility is an additional pressure factor. The current market situation creates conditions for developing scenarios for asset price declines.
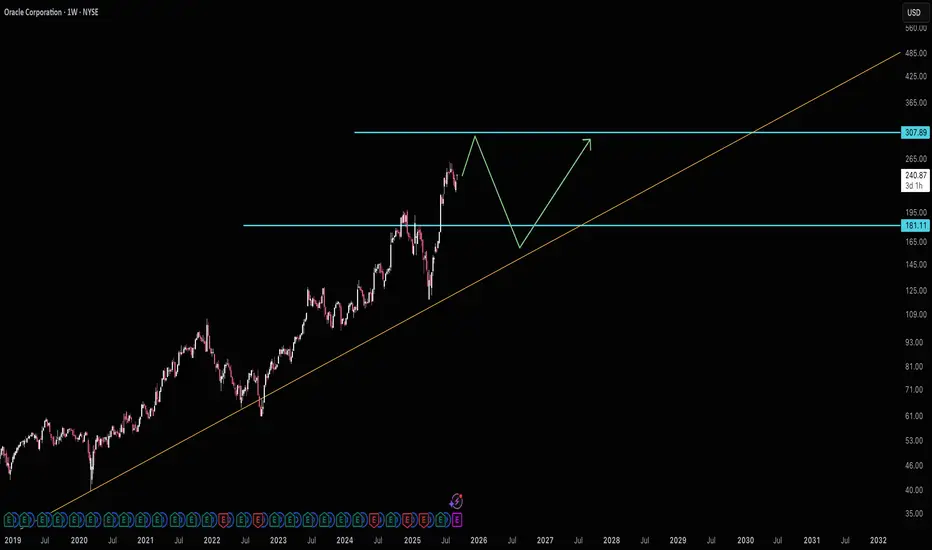
Oracle LongOracle is at the regression line from the start of 2020 (covid to date) and retesting the previous top as a support. If market won't go into full panic it might be a good place to enter.
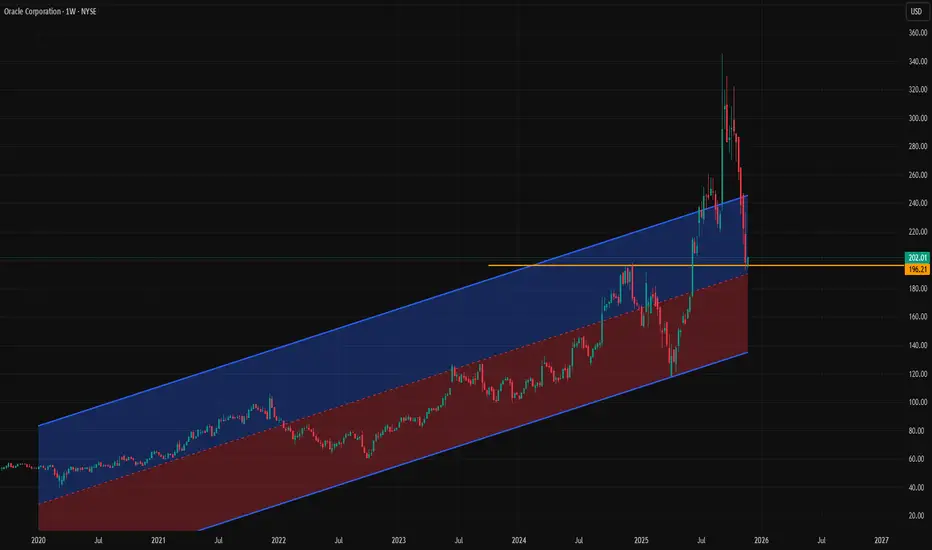
Oracle wants $181Oracle is well off it's long term average and accelerating growth by around 4 years if it hits $307. If it makes it there I would *highly* suggest selling and even potentially a short position. A fair price for ORCL would be $181.
Good luck!
ORACLE The collapse won't stop here.Oracle (ORCL) has been correcting violently ever since its early September news-related pump that made new All Time Highs (ATH). The correction has already almost reached the 1W MA50 (blue trend-line), resembling the technical pull-back of both December 2024 - April 2025 and the 2022 Inflation Crisis.
Based on the 1W RSI, we expect Oracle to follow that Bear Cycle and seek its 1W MA200 (orange trend-line) for Support, which has been he most optimal long-term buy entry of the past 5 years.
If this Channel Up holds, this time the bottom should be above the 0.5 Fibonacci retracement level. Our Target is $170.
---
** Please LIKE 👍, FOLLOW ✅, SHARE 🙌 and COMMENT ✍ if you enjoy this idea! Also share your ideas and charts in the comments section below! This is best way to keep it relevant, support us, keep the content here free and allow the idea to reach as many people as possible. **
---
💸💸💸💸💸💸
👇 👇 👇 👇 👇 👇

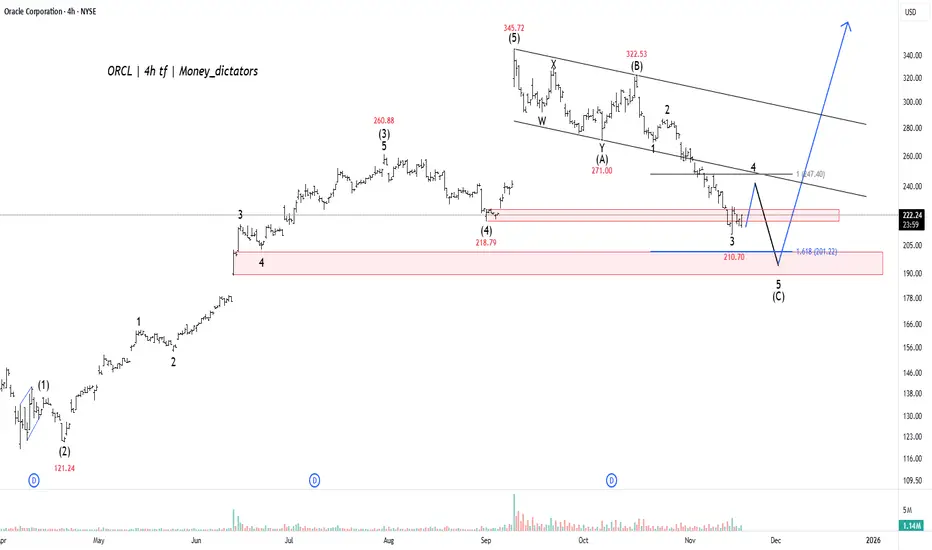
ORCL - Launchpad to New HighsWave Projection of Oracle (ORCL) suggests the stock is currently in the final stages of a major correction, specifically concluding the last downward leg, wave (C), of a larger pullback. The chart indicates that after a temporary bounce, the price is expected to make one final, sharp drop to complete this corrective phase. This action is essential for the market to "reset" before the next significant rally.
The critical support area for the end of this correction is identified in a tight range between $207.72 (the $1.618$ Fibonacci extension) and the immediate low of $210.70 . This zone offers strong confluence with previous structural support, making it the highest probability area for the market to find a decisive bottom. The analysis projects that the current selling pressure will exhaust itself within this $207-$211 range.
Once the price successfully reaches and holds this projected support zone, the analysis anticipates the launch of a major, long-term bullish impulse wave, likely the start of the final wave (5) of a large-scale uptrend. This new wave is expected to drive the stock significantly higher, with a target to surpass the previous all-time high of $345.77 . This pattern suggests that the current decline should be viewed as a final buying opportunity before a powerful upward trend begins.
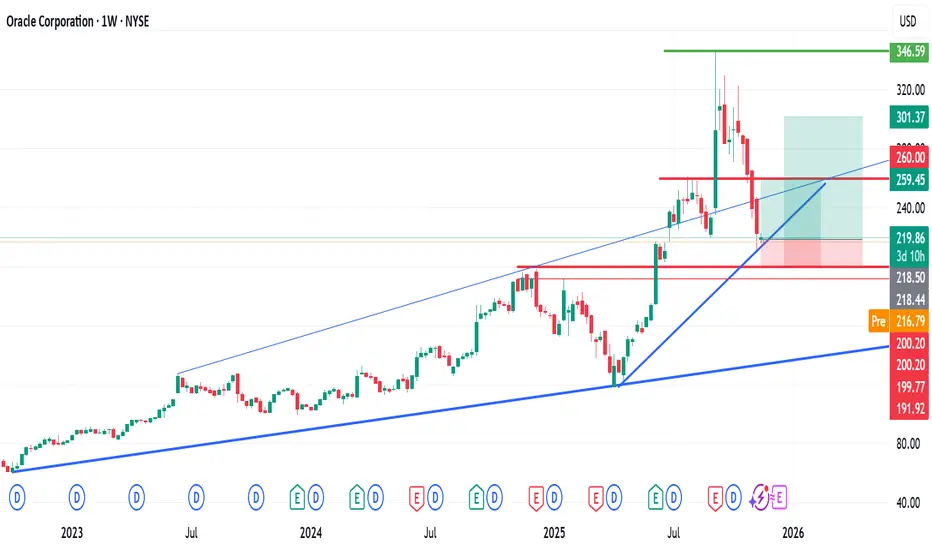
What’s Next for ORCL After a 39%+ Decline? Potential Buy Oracle recently surged to an all-time high of approximately $346, followed by a sharp correction of more than 39%, bringing the price into the key Fibonacci 61.8% retracement zone.
This level has historically acted as a strong technical area for potential reversals.
The decline has also resulted in the development of an ascending trendline, which is currently serving as a major support zone on the chart.
Technical Outlook
Potential Buy Zones:
Entry Zones: $219.86 (Entry 1 & 2)
Target Levels:
TP 1: $260
TP 2: $300
Risk Consideration
If the ascending trendline fails to hold, the chart suggests a possible additional downside of approximately 8% before the next support region.
As always, apply strict risk management and adjust your position sizing accordingly.
Feel free to share your views—and kindly follow for more chart breakdowns and market insights.
Oracle (ORCL) Hits Major Support Zone —Big Rebound or Breakdown?Oracle Corporation (NYSE: ORCL) is entering a critical phase as the stock pulls back sharply from its recent high at $345. The retreat brings ORCL back toward a long-term trendline that has acted as structural support and resistance for almost three years. Whether the stock holds this trendline or loses it will determine the next major move.
Technically, ORCL is testing the support zone at the ascending trendline, around $222. This region marked the prior ascending resistance that the stock broke above in 2024 during its strong cloud-driven rally. If bulls defend this level and volume stabilizes, ORCL could rebound and retest the $350 region. A clean hold above the trendline keeps the long-term bullish structure intact.
However, a failure to hold $222 could trigger a deeper slide toward the major support around $135–$145, a level where institutions accumulated heavily in 2022–2023. This zone also aligns with a large volume shelf, making it the next downside magnet if sellers remain in control.
Fundamentally, Oracle remains well-positioned despite the recent correction. Strong demand for its AI-optimized cloud solutions, growing adoption of Oracle Cloud Infrastructure (OCI), and continued expansion of its healthcare data platform (Cerner) support long-term revenue growth. Oracle is one of the few cloud companies benefiting from rising enterprise AI spending as businesses shift toward more efficient data-first solutions.
Macro conditions may also influence price action. With expectations of Fed rate cuts in December and cooling inflation, tech valuations could stabilize and attract renewed capital flows. Lower borrowing costs historically benefit high-growth software companies, and ORCL could see momentum return once macro pressures ease.
Overall, ORCL sits at a crucial technical zone. Holding the long-term trendline keeps the bullish path alive; breaking below opens the door to deeper downside. The next few weeks will determine the stock’s trajectory into 2025.
