Oracle - This stock is heading higher!🚀Oracle ( NYSE:ORCL ) is heading higher now:
🔎Analysis summary:
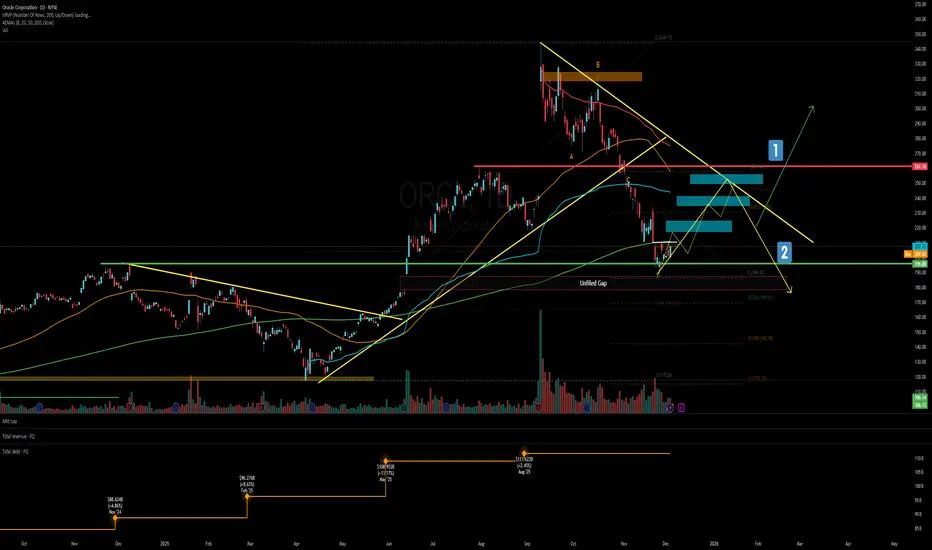
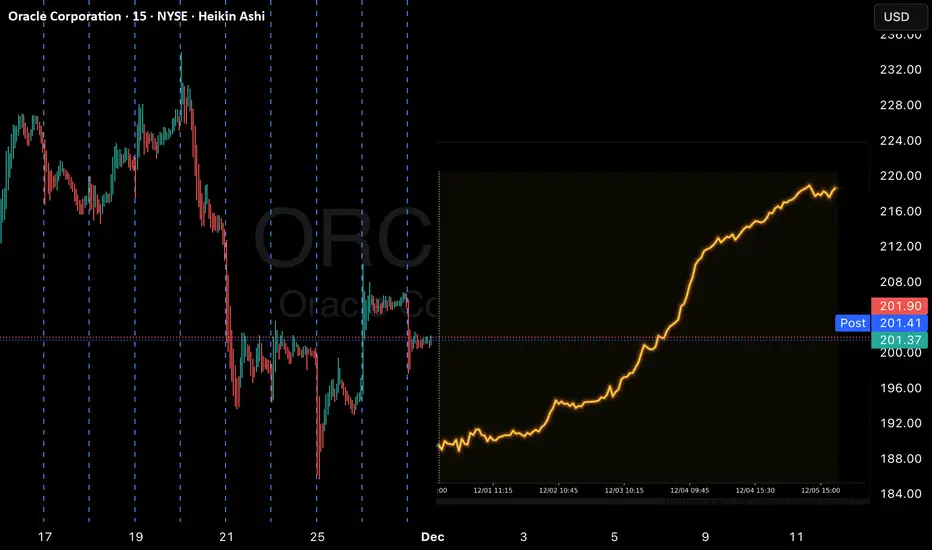
Yes, over the course of the past couple of weeks, we witnessed a harsh drop of -50% on Oracle. But looking at the higher timeframe, Oracle is just creating a bullish break and retest. If we see bullish confirmation soon, Oracle will create new all time highs.
📝Levels to watch:
$200
SwingTraderPhil
SwingTrading.Simplified. | Investing.Simplified. | #LONGTERMVISION
ORCL

Oracle - A very clear buy signal!🚪Oracle ($NASDAQ:ORCL) is just 100% bullish:
🔎Analysis summary:
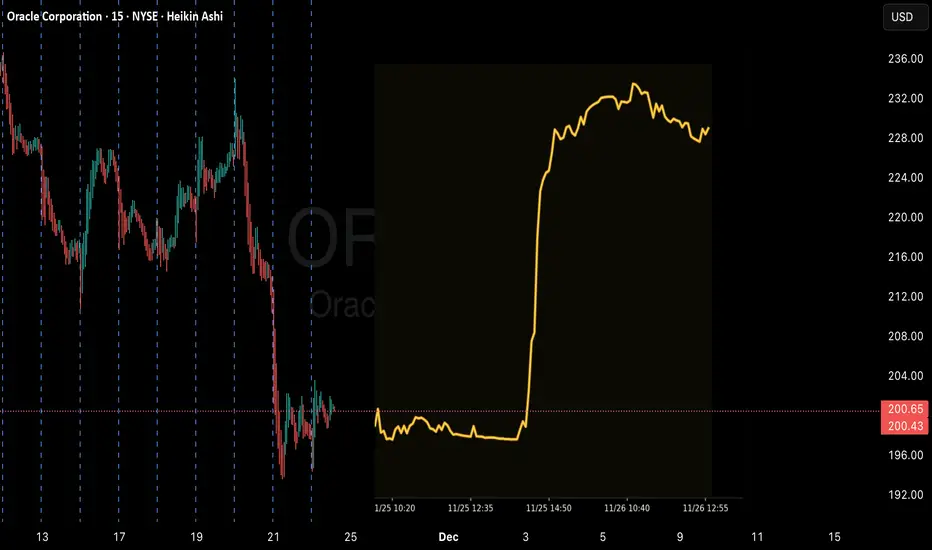
For the past two decades, Oracle has been in a very strong bullish market. And with the recent -40% correction, this trajectory did not change at all. In fact, we are just witnessing a bullish all time high break and retest so Oracle will create another rally quite soon.
📝Levels to watch:
$200
SwingTraderPhil
SwingTrading.Simplified. | Investing.Simplified. | #LONGTERMVISION

Oracle: A Deep-Value Contrarian Play in the AI BuildoutOracle Corporation (NYSE: ORCL), a legacy tech giant undergoing a radical transformation, finds itself at a critical juncture. Its shares have been under intense pressure, trading down approximately 43% from their September 2025 all-time high. This sell-off reflects a palpable investor anxiety: skepticism over the company's ability to convert an unprecedented wave of capital expenditure into near-term profits, and concern over the burgeoning debt required to fund its ambitious artificial intelligence (AI) infrastructure buildout. However, a closer examination reveals a company with unparalleled forward revenue visibility, a disciplined and margin-focused growth strategy, and a valuation that may have excessively priced in worst-case scenarios. This combination creates a compelling, albeit high-stakes, investment opportunity for patient capital.
The Crown Jewel: Unprecedented Multiyear Revenue Visibility
The most formidable pillar of the bull case is Oracle's staggering backlog, officially termed Remaining Performance Obligations (RPO). As of Q2 FY2026, this figure stands at $523 billion—a 433% year-over-year increase. This is not merely a speculative pipeline; it represents signed, long-term cloud infrastructure contracts with the world's most demanding technology companies, including Nvidia and Meta Platforms.
The scale of this backlog is almost surreal, dwarfing even the company's own elevated FY2026 revenue guidance of $67 billion. It provides exceptional multiyear visibility and de-risks the top-line trajectory in a way few public companies can claim. Critically, the near-term conversion is already accelerating: the portion of RPO expected to be recognized within the next 12 months grew 40% year-over-year, up from 25% in the prior quarter. Management has quantified this, anticipating $4 billion of incremental revenue in FY2027 from the new contracts added in the latest quarter alone. This isn't hope; it's contracted future revenue waiting for data center capacity to come online.
Disciplined Execution: Pursuing Growth with Margin Guardrails
Contrary to the narrative of reckless spending, Oracle is demonstrating notable capital discipline. The company is not pursuing "growth at any cost." It strategically signs massive contracts only when key operational prerequisites are locked in: secured land and power availability, favorable supply economics for critical components like GPUs, and confirmed engineering capacity to build and manage the infrastructure.
Furthermore, Oracle has provided a clear profitability target for its AI endeavor: gross profit margins of 30% to 40% for its AI data centers. This focus on unit economics is crucial. It signals that Oracle intends for its cloud infrastructure business (OCI) to be a high-margin engine, not a loss-leading scale play. This margin framework provides a future lens through which to model the immense earnings potential as the $523 billion RPO gradually converts.
Navigating the Capital Challenge: Innovative Financing and Debt Concerns
The elephant in the room is funding. Building a global AI cloud network requires monumental capital expenditure. While debt has increased, Oracle's management is proactively exploring innovative, off-balance-sheet funding structures to limit borrowing and preserve financial flexibility. These include arrangements like customer-owned chips and supplier-leased chips, which would significantly reduce Oracle's upfront cash outlays. This creative approach to financing a capex super-cycle is a critical differentiator and helps mitigate one of the market's primary fears.
Nevertheless, risks persist. The debt load is substantial, and investor concerns are compounded by uncertainties surrounding key clients like OpenAI and their ability to fund their own massive compute bills. The specter of an "AI bubble" burst that could leave Oracle with stranded, underutilized assets is a valid macro risk that cannot be dismissed.
Valuation & Technical Analysis: Mapping the Risk/Reward
From both a fundamental and technical perspective, the current price appears to discount an excessive amount of pessimism.
Fundamental Valuation: At approximately 24-29x forward earnings, Oracle's multiple is reasonable for a company with its growth profile and unparalleled contracted backlog. It sits at a discount to many pure-play cloud and AI peers, especially considering the revenue certainty its RPO provides.
Technical Perspective & Key Levels:
The steep decline has brought the stock into a zone where long-term value and technical support converge, defining a clear risk/reward framework:
Initial Support & Rally Point at ~$169.63 (0.618 Fibonacci): This level represents a key Fibonacci retracement zone and a logical area for the stock to stabilize and attempt a reversal. Holding here would suggest the recent sell-off was a deep but healthy correction within a longer-term uptrend.
Major Support & Strategic Value Zone at ~$121.76 (0.786 Fibonacci): This deeper level represents a more extreme bear-case scenario. A decline to this area would likely coincide with peak fears of an AI downturn or a significant execution stumble. For long-term believers, this zone would represent a potentially historic buying opportunity, as it would price in catastrophic assumptions about contract cancellations and margin collapse.
Take-Profit Target at ~$236.87 (0.382 Fibonacci Retracement of the Fall): A return to this area represents the first major technical hurdle and a logical profit-taking zone for a recovery trade. Achieving this target would imply a regaining of market confidence, supported by concrete quarterly evidence of RPO conversion and margin progress. It frames a significant upside potential from current levels.
Final Assessment: A High-Conviction, High-Stakes Recovery Bet
Oracle presents a classic contrarian opportunity. The market is fixated on the near-term costs and risks of its AI odyssey, overlooking the sheer magnitude and quality of its secured future revenue stream. The company is not building on speculation; it is building to fulfill already-signed contracts with industry titans.
While execution risks around debt, client concentration, and macro AI cycles are real, the current valuation and technical setup suggest these risks are overwhelmingly reflected in the price. The path forward will be volatile, likely oscillating between the $169 support and the $237 target as quarterly results provide proof points of execution.
For investors with a multi-year horizon and the fortitude to withstand volatility, Oracle at these levels offers a compelling bet on a foundational player in the AI infrastructure layer. It is a wager that the company's unmatched backlog, disciplined margin targets, and innovative financing will ultimately translate into a powerful earnings growth story that the market is currently unwilling to see.

Oracle - Seeking SymmetryLet’s examine the corrective impulsive move that began in September 2025.
When breaking this movement down into waves and sub-waves, we can observe multiple waves that are roughly equal in size at both the beginning and the end of the structure, marked in red .
If the wave count is correct, one final wave is still missing - its projected size is marked in blue .
This becomes especially evident if we extend a flat correction from the last completed fifth wave and take into account that it typically retraces 50–60% of the prior wave. Under these assumptions, the structure aligns well.
Additionally, when applying Fibonacci levels from the first impulsive wave, they converge with the projected completion area of the move.
Conclusion:
The move is targeting the 150 level. From that area, a new phase of price action is expected to begin.
---
Please subscribe and leave a comment.
You’ll get new information faster than anyone else.
---

ORCL - Up Or DownORCL's debt clock ticking and CDS are expensive.
Anyways, it's little bit oversold here. We can see a little bounce here.
Earnings next week can ramp this up a little. Prefer to play via shares rather than options.
Long anywhere here.
Target 1 - 223
Target 2 - 240
Target 3 - 252
Stop loss - 200, can be 180 but it's too wide.
Oracle’s AI Cloud Super‑Cycle Is Just Starting (ORCL)Oracle is shifting from an old‑school software company to a key provider of AI cloud infrastructure, shown by its massive surge in new long‑term contracts. Big clients like Meta and NVIDIA are choosing Oracle for high‑demand cloud tasks, adding to its momentum. The recent dip gives investors a chance to buy at a discount. With added boosts from partnerships like TikTok and OpenAI, Oracle is well‑positioned for the next wave of tech expansion.
GreenBlue: 314/2500
GreenRed: 332/2712
Morningstar: 4 stars, Wide moat
GuruFocus: 91/100
Competitors: MSFT, SNPS, FTNT

$ORCL accumulate & hold for the next 2 years- NYSE:ORCL is a buy after 50% decline from the top.
- Accumulating NYSE:ORCL and plan to hold for next 2 years.

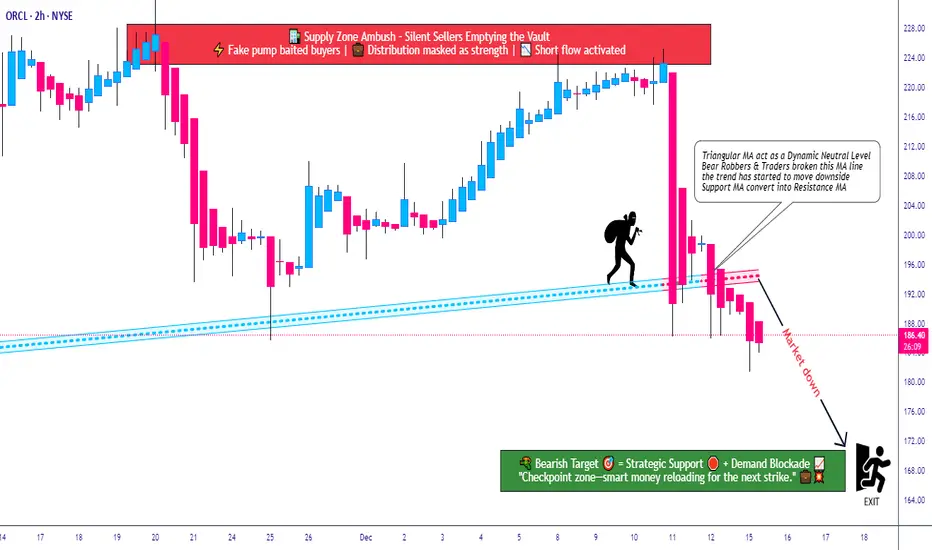
ORCL Breakdown Zone Activated — Downside Pressure Builds!🔻 ORCL Bearish Breakdown Playbook | Smart Money Trap Ahead? 🔻
📌 Asset
ORCL — Oracle Corporation
NYSE Exchange | Stock Market
Trading Style: Swing / Day Trade
📉 Market Bias
Bearish Structure Confirmed
Price action confirms a Triangular Moving Average (TMA) breakdown, signaling momentum exhaustion and increasing downside probability. Sellers remain in control as volatility expands after the structure break ⚠️📊
🎯 Trade Plan (Thief Style – Market Adaptive)
🔹 Entry:
Market-responsive entry — no fixed price level.
(Allow price to confirm direction; avoid emotional entries 🧠)
🔹 Stop Loss:
🛑 Thief SL reference: 205.00
This level is shared for educational context only. Risk management remains fully trader-dependent.
📝 Note:
Dear Ladies & Gentlemen (Thief OG’s), this is not a recommendation to use only this stop loss. You manage risk according to your own strategy and comfort.
🔹 Target Zone:
🎯 170.00
This level aligns with:
✔ Strong historical support
✔ Oversold conditions
✔ Potential liquidity trap
✔ Correlation-based confluence
⚠️ As price approaches this zone, partial or full profit protection is advised. Smart exits matter more than perfect targets.
📝 Note:
Dear Ladies & Gentlemen (Thief OG’s), this target is not mandatory. Adapt your take-profit based on live price behavior and personal risk rules.
🔗 Correlated Markets to Watch 👀
📌 NASDAQ:QQQ – Nasdaq weakness often amplifies downside pressure on ORCL due to tech sector correlation.
📌 NASDAQ:MSFT – Relative weakness here can signal broader enterprise-tech selling.
📌 NASDAQ:AAPL – Risk-off sentiment in mega-caps may accelerate momentum continuation.
📌 TVC:DXY – Dollar strength can pressure equities, supporting bearish follow-through.
➡️ If correlated assets show risk-off behavior, ORCL downside probability increases.
🧠 Key Takeaways
✔ Trend bias favors sellers
✔ Breakdown structure validated
✔ Risk management > prediction
✔ Adapt to price, don’t marry levels
⚠️ Disclaimer
This is a thief-style trading strategy, shared for fun and educational purposes only.
Trading involves risk. You are fully responsible for your decisions and outcomes.
✨ “If you find value in my analysis, a 👍 and 🚀 boost is much appreciated — it helps me share more setups with the community!”
#ORCL #Oracle #BearishSetup #StockMarket #SwingTrading
#DayTrading #TechnicalAnalysis #SmartMoney
#NYSE #TradingView #RiskManagement #ThiefStyle
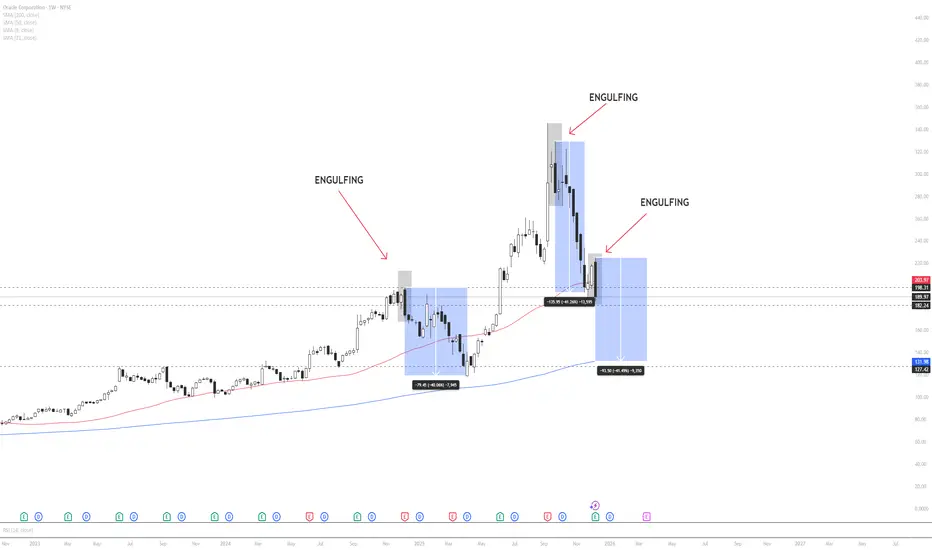
ORCL – Weekly Technical & Historical AnalysisOracle is currently trading in a weekly consolidation (flat) zone, indicating a neutral market structure. However, price has closed below the 50-period moving average , which often signals a shift in medium-term momentum.
A key technical development is the appearance of a weekly bearish engulfing candle, a pattern that historically precedes sharp downside moves in ORCL.
When analyzing previous occurrences of similar engulfing patterns, price declined by approximately 40% in the first instance and showed a nearly identical drawdown in the second instance. If historical behavior repeats , price may continue lower toward the 200-period moving average and the major support zone marked on the chart, which aligns closely with a projected ~40% correction.
Markets often exhibit recurring behavioral patterns, especially in higher timeframes. For this reason, downside risk remains elevated unless price reclaims the 50 MA and invalidates the engulfing structure.
This analysis is based on historical probability and technical structure and is not financial advice. Traders should manage risk accordingly.
ORCL - From Erections Come CorrectionsORCL is a textbook example of a setup I call: “From Erections Come Corrections.”
1. It also shows why log charts lie to you on the way down.
When you’re evaluating downside risk, remember: every stock is always 100% away from zero.
A linear chart makes the real danger obvious. I don’t even need to measure this one — the drop is roughly 50% staring you in the face.
2. Look at the speed of that drop.
If you’re one of those heroes trying to squeeze an extra 3% at the top and end up wearing a -50% drawdown because you had no exit plan… that’s not bad luck — that’s greed and negligence teaming up to hand you a bag of sh*t.
3. But if you actually respected risk, took profits, and GTFO/STFO with cash in hand?
Now you get to walk back in as a well-refined gentleman or lady, gracefully to start building a position at at a “500% discount,” as Trump would say.
4. Notice anything magical on my chart?0
No algos. No secret indicators. No fairy-tale narratives. Not even candlesticks. Just plain vanilla price action.
That’s proper charting. Keep it simple.
You chose to play this game, so at least play it right.
Lastly, if the market tanks here, ORCL will just keep tanking as well. BUT! you will be getting in with a 50% discount already. That, my friends, is the difference.
THANK YOU for getting me to 5,000 followers! 🙏🔥
Let’s keep climbing.
If you enjoy the work:
👉 Drop a solid comment
Let’s push it to 6,000 and keep building a community grounded in truth, not hype.

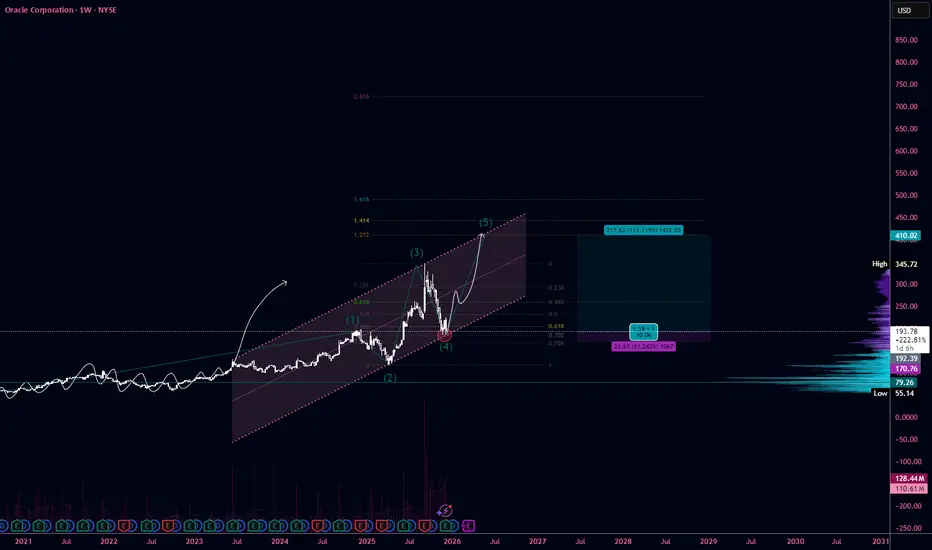
#ORCL R:R 1:10 The start of the fifth wave target $400NYSE:ORCL
TF: 1W
Oracle continues to move within a well-defined ascending channel, forming a clean 5-wave impulsive structure. The price is currently coming out of a completed wave (4) correction, which perfectly tapped into the key retracement zone:
• 0.618–0.786 Fibonacci retracement
• High-volume node on VPVR
• Lower boundary of the rising channel
This creates a strong technical cluster that supports a bullish continuation.
••Main Idea
I expect a full development of the final wave (5), which may extend further as Oracle continues to benefit from cloud growth, AI infrastructure demand, and corporate IT spending.
•••Why This Looks Like Wave (5)
1.Wave (3) was strong and impulsive with a clear vertical expansion.
2.Wave (4) formed a prolonged and corrective pullback — typical for large caps.
3.VPVR shows a dense demand cluster at the correction bottom.
Price respected the long-term trendline and re-entered the channel.
ORCL long-term TAWatch out for Oracle to break the current uptrend on weekly, it's getting weaker along with the distribution on daily which has started about a month ago and still ongoing. The current weekly uptrend is still holding up but it's getting weaker and in danger for a possible downtrend, for now we need more time to see the confirmation.
Watch the blue lines as pivots to hold the support.

SOFTBANK can drop another 50%Softbank Group shares took a nosedive on Thursday, dragging down Japanese markets as mixed earnings and guidance from cloud giant Oracle raised fresh worries about excessive spending on artificial intelligence.
#Softbank (TYO:9984) dropped 7.7% to a one-week low of 17,210.0 yen by 22:34 ET (03:34 GMT), making it the biggest loser on the Nikkei 225 index, which fell by over 1%.
The decline in Softbank followed a more than 10% drop in Oracle (NYSE:ORCL), which plummeted after its fiscal second-quarter earnings report. Although the company exceeded market expectations for its net income, it fell short on revenue and provided a weaker-than-anticipated outlook for the upcoming quarter.
#Oracle also raised its fiscal 2026 capital expenditure forecast to $50 billion from $35 billion. The mixed earnings, along with expectations of increased capex, reignited concerns about how Oracle intends to profit from its substantial AI data center spending plans. There are also worries about the company’s debt load, following billions in issuances this year, and its significant exposure to OpenAI, which negatively impacted sentiment towards the stock.
BMO analysts pointed out that Oracle’s ties to OpenAI pose some long-term risks, considering the scale of the startup’s spending commitments and uncertainties about how it plans to fulfill those promises.
These worries spilled over to Softbank, which has a heavy investment in OpenAI. Softbank CFO Yoshimitsu Goto recently mentioned to Nikkei that the tech conglomerate is firmly focused on OpenAI and has no interest in funding its rivals.

Is Oracle’s AI Growth Hitting a Structural Wall?Oracle Corporation (ORCL) stands at a defining juncture where aggressive cloud expansion collides with the physical limits of infrastructure scaling. Despite a strategic pivot that has positioned Oracle Cloud Infrastructure (OCI) as a primary engine for artificial intelligence workloads, the stock has retreated approximately 35% from its September peak. This volatility reflects a market grappling with a dual narrative: the immense promise of a $300 billion AI pipeline and the operational fragility of concentrating heavily on a single client, OpenAI.
Geopolitics and Geostrategy: The Sovereign Advantage
Oracle has effectively weaponized data sovereignty as a competitive moat. Unlike hyperscale rivals often viewed with skepticism in Europe and Asia, Oracle’s dual-region sovereign cloud strategy allows governments to retain strict legal control over data residency. This approach insulates a portion of Oracle’s revenue from protectionist policies and US-China trade tensions, positioning OCI as the "neutral" vendor of choice for state-level actors requiring air-gapped security for sensitive workloads.
Industry Trends and Macroeconomics: The Capacity Wall
The macro environment presents a paradox for Oracle. High interest rates have inflated the cost of debt just as the company accelerates capital expenditures (CapEx) to build AI data centers. Simultaneously, the industry faces a hard physical ceiling: power availability. In key markets like Northern Virginia and Silicon Valley, grid connections face multi-year delays. Oracle’s ability to secure gigawatt-scale power for its "Stargate" class projects will be the primary determinant of whether it can convert its record bookings into recognized revenue before 2027.
Business Models: The OpenAI Concentration Risk
Oracle’s shift from license-based legacy software to consumption-based cloud revenue is accelerating, but the quality of this revenue is under scrutiny. Recent disclosures reveal that a significant percentage of the company’s Remaining Performance Obligations (RPO) is tied to OpenAI’s massive infrastructure demands. While this validates OCI’s technical prowess, it introduces binary counterparty risk. If OpenAI faces regulatory headwinds or funding slowdowns, Oracle’s growth narrative could face an abrupt repricing.
Technology, Cyber, and Patent Analysis
Technologically, Oracle differentiates itself through automation. Its Autonomous Database utilizes machine learning to self-patch and self-tune, theoretically reducing the cyber attack surface by eliminating human error—the leading cause of data breaches. Patent analysis suggests Oracle is aggressively protecting this "self-driving" database architecture, aiming to lock in enterprise clients who prioritize security over the raw compute cost advantages offered by generic cloud providers.
Management and Leadership: The Aggressive Pivot
Under the stewardship of Larry Ellison and Safra Catz, Oracle’s culture remains unapologetically aggressive. The leadership has demonstrated a willingness to sacrifice short-term margins for long-term capacity, a strategy reminiscent of Amazon’s early AWS days. However, this high-stakes bet requires flawless execution in supply chain management, particularly in securing Nvidia GPUs amidst global shortages.
Stock Performance and Technical Status
Technically, ORCL is testing critical support zones after its sharp 35% correction. The sell-off was triggered by the realization that bookings growth does not equal immediate cash flow. Investors are currently demanding proof of "broad-based demand"—evidence that OCI is winning enterprise clients beyond the headline-grabbing AI labs. Until this diversification is proven, the stock remains vulnerable to volatility.

ORCL Swing Signal: Katy AI Predicts Short-Term UpsideORCL Swing Signal — (2025-11-28)
Instrument: ORCL
Direction: BUY CALLS 📈
Confidence: 58% (Medium)
Horizon / Expiry: 14 days → 2025-12-12
Strike Focus: $210.00
Entry Range: $8.50 – $9.00 (mid $8.75)
Target 1: $12.75 (+50%)
Target 2: $15.30 (+80%)
Stop Loss: $6.38 (-25%)
Position Size: 2% of portfolio
Risk Level: Moderate — recent volatility and low confidence
Katy AI Signal
Bullish bias, recovery potential after 7.96% drop
Predicted mean reversion toward $220–$230 range
40.2% swing range position favors upside
Technical Context
Current Price: $201.30 (< VWAP $206.97) → potential bounce
Key Resistance: $219.07
Support: $185.63
Trend Strength: Weak, but setup favors upside
Candlestick Patterns: None detected
Broader Market: STRONG_BULLISH; SPY & QQQ bullish
Options Flow
Neutral flow, low time decay risk
No unusual activity — potential for momentum shift
Trade Setup & Strategy
Why This Trade: Combines oversold bounce potential with broader market tailwinds
Timing Advantage: Enter after sharp single-day drop; favorable risk/reward
Risk Mitigation: Tight stop loss, small position size, scale in if needed
Oracle (ORCL) rebounded on renewed AI momentum.
Surging Alphabet (GOOGL) and revived Nvidia (NVDA) stock prices are leading the AI momentum. Oracle (ORCL), which fell over 40% from its high on amplified doubts over its 300 bln USD computing contract with OpenAI, saw a rebound.
Deutsche Bank assessed the drop in ORCL stock as providing an attractive entry point. They valued the current price as reflecting no positives, citing EPS (ex-OpenAI costs) at 17 USD and FCF at 31 bln USD, both below company guidance.
HSBC also issued a Buy rating on ORCL, expecting various financing strategies for data center costs to be announced, thereby mitigating balance sheet burden and diversifying risk.
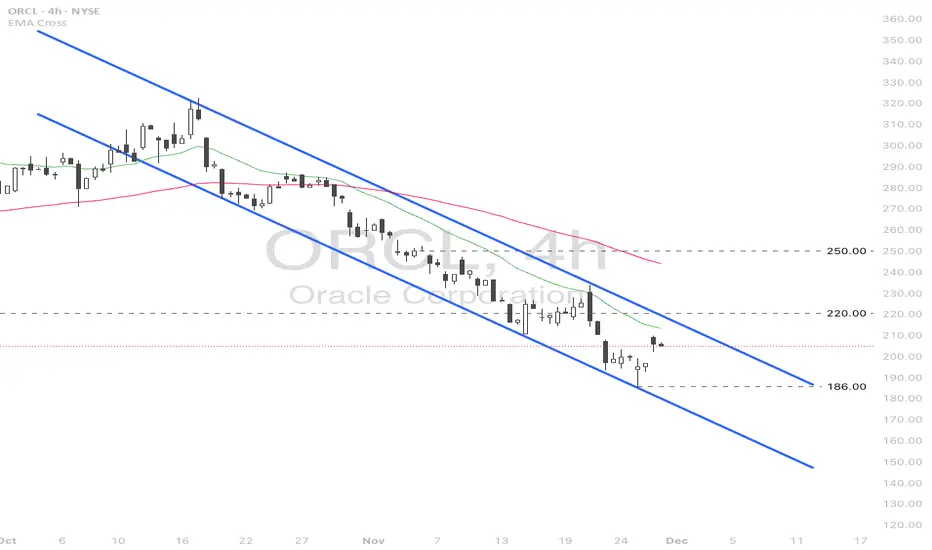
ORCL briefly tested the 186.00 low before slightly rebounding. The price remains within the descending channel and below the bearish EMAs, indicating the potential downtrend extension. If ORCL breaches above EMA21 and 220.00, the price could advance toward the next resistance at 250.00.
Conversely, if ORCL fails to close above EMA21, the price may retreat toward the following support at 186.00.
QS V3 ORCL Weekly Momentum Breakout AlertORCL (QS V3 Weekly | 2025-11-24)
Direction: BUY CALLS
Confidence: 60%
Expiry: 2025-11-28 (4 days)
Strike Focus: $192.50
Entry Range: $9.20 – $9.65 (mid: $9.43)
Target 1: $15.10
Stop Loss: $5.66
Weekly Momentum: Bullish (+1.82% 1W)
Flow Intel: Neutral
Risk Level: ⚠️ Moderate Risk
Katy AI Forecast: Predicts move toward $233.28 (+16.7%) by Nov 26–27, with peak near $247.
Support: $196.87
Resistance: $234.75
VWAP: $205.75
Volatility: VIX 23.43
Recommended Position Size: 3%
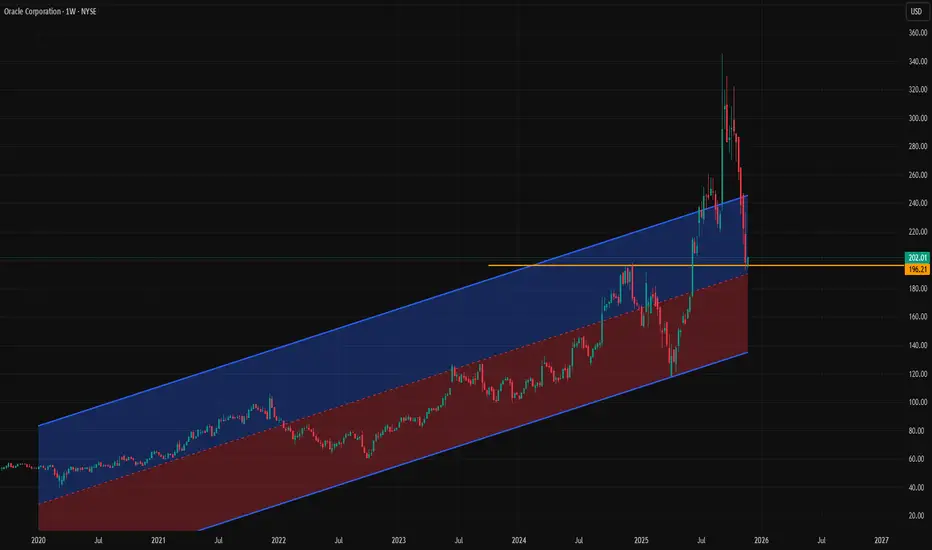
Oracle LongOracle is at the regression line from the start of 2020 (covid to date) and retesting the previous top as a support. If market won't go into full panic it might be a good place to enter.
ORACLE The collapse won't stop here.Oracle (ORCL) has been correcting violently ever since its early September news-related pump that made new All Time Highs (ATH). The correction has already almost reached the 1W MA50 (blue trend-line), resembling the technical pull-back of both December 2024 - April 2025 and the 2022 Inflation Crisis.
Based on the 1W RSI, we expect Oracle to follow that Bear Cycle and seek its 1W MA200 (orange trend-line) for Support, which has been he most optimal long-term buy entry of the past 5 years.
If this Channel Up holds, this time the bottom should be above the 0.5 Fibonacci retracement level. Our Target is $170.
---
** Please LIKE 👍, FOLLOW ✅, SHARE 🙌 and COMMENT ✍ if you enjoy this idea! Also share your ideas and charts in the comments section below! This is best way to keep it relevant, support us, keep the content here free and allow the idea to reach as many people as possible. **
---
💸💸💸💸💸💸
👇 👇 👇 👇 👇 👇

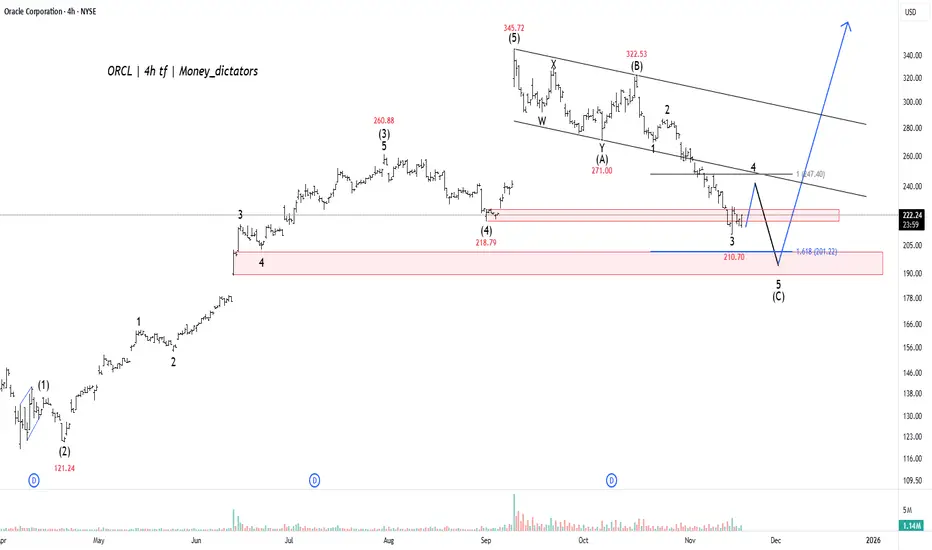
ORCL - Launchpad to New HighsWave Projection of Oracle (ORCL) suggests the stock is currently in the final stages of a major correction, specifically concluding the last downward leg, wave (C), of a larger pullback. The chart indicates that after a temporary bounce, the price is expected to make one final, sharp drop to complete this corrective phase. This action is essential for the market to "reset" before the next significant rally.
The critical support area for the end of this correction is identified in a tight range between $207.72 (the $1.618$ Fibonacci extension) and the immediate low of $210.70 . This zone offers strong confluence with previous structural support, making it the highest probability area for the market to find a decisive bottom. The analysis projects that the current selling pressure will exhaust itself within this $207-$211 range.
Once the price successfully reaches and holds this projected support zone, the analysis anticipates the launch of a major, long-term bullish impulse wave, likely the start of the final wave (5) of a large-scale uptrend. This new wave is expected to drive the stock significantly higher, with a target to surpass the previous all-time high of $345.77 . This pattern suggests that the current decline should be viewed as a final buying opportunity before a powerful upward trend begins.
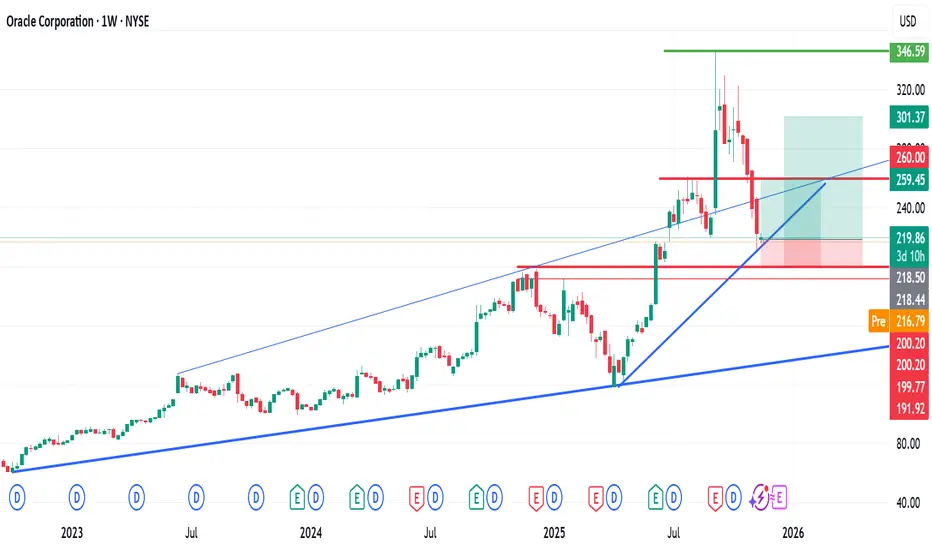
What’s Next for ORCL After a 39%+ Decline? Potential Buy Oracle recently surged to an all-time high of approximately $346, followed by a sharp correction of more than 39%, bringing the price into the key Fibonacci 61.8% retracement zone.
This level has historically acted as a strong technical area for potential reversals.
The decline has also resulted in the development of an ascending trendline, which is currently serving as a major support zone on the chart.
Technical Outlook
Potential Buy Zones:
Entry Zones: $219.86 (Entry 1 & 2)
Target Levels:
TP 1: $260
TP 2: $300
Risk Consideration
If the ascending trendline fails to hold, the chart suggests a possible additional downside of approximately 8% before the next support region.
As always, apply strict risk management and adjust your position sizing accordingly.
Feel free to share your views—and kindly follow for more chart breakdowns and market insights.
ORCL Bearish Momentum — Short-Term Trade OpportunityORCL QuantSignals Katy 1M Prediction 2025-11-14
Ticker: ORCL
Current Price: $220.57
Trend: Bearish
Confidence: 75%
Volatility: 34.3%
📊 AI & Technical Forecast
30-Minute Target: $218.05 (–1.14%)
Final Prediction: $213.61 (–3.15%)
Strong bearish momentum projected over short-term horizon
Insights:
ORCL exhibits declining trend with controlled volatility
Katy AI indicates high probability of short-term downside
🎯 Trade Setup
Parameter Value
Direction PUT
Entry $220.57
Target $215.00
Stop Loss $223.88
Expected Move –3.15%
Confidence 75%
🚨 Risk Notes
Short-term trade, monitor closely
Stop loss above $223.88 limits risk
Summary
ORCL presents a high-confidence short setup based on Katy AI 1M prediction with a clear downside target, suitable for traders seeking short-term bearish exposure.

$ORCLExecutive Summary:
Oracle Corporation ( NYSE:ORCL ) has experienced a significant bearish catalyst following its earnings report on Tuesday, September 9th, leading to a pronounced breakdown of its previous technical structure. The violation of a key Bull Flag pattern has invalidated the prior consolidation's bullish implications and suggests a new near-term downtrend is now in force. In this context, our strategy shifts to identifying strategic support levels for potential capital allocation once the selling pressure subsides. Key Fibonacci retracement levels at $205.61 and $167.52 provide initial targets, while the major psychological support at $200.00 presents a high-conviction buying zone where long-term value and technical support are expected to converge.
Detailed Technical Breakdown:
1. The Catalytic Event and Pattern Breakdown:
The bearish gap down and subsequent sell-off post-earnings on September 9th represent a fundamental shift in market sentiment. This event acted as the decisive catalyst that shattered the technical picture.
Bull Flag Failure: The pattern that was previously interpreted as a Bull Flag—a typically bullish continuation signal—has now been conclusively broken to the downside. Instead of pausing before a move higher, the pattern has failed, indicating that the underlying supply (sellers) has overwhelmed demand (buyers). This breakdown signals that the path of least resistance has shifted downward, and the pattern's prior support level has now become a new resistance zone.
2. Revised Support Framework and Downside Targets:
Given the newly established downtrend, we utilize Fibonacci retracement levels of the stock's major prior upward swing to identify logical areas where the decline may find footing and buyer interest may return.
Initial Support (Shallow Retracement): 61.8% Fibonacci Level at $205.61
This level, known as the "Golden Ratio," is a deep but common retracement zone in a strong stock. A hold here would suggest that the long-term uptrend remains structurally sound despite the recent earnings-driven setback. However, given the magnitude of the breakdown, a mere bounce at this level may be temporary.
Secondary Support (Deep Retracement): 78.6% Fibonacci Level at $167.52
A retracement to this depth would indicate a more severe correction is underway, potentially shaking out weaker hands. While this suggests greater near-term weakness, it also represents a more significant "washout" level that could create a powerful long-term base and a higher-risk, higher-reward entry point.
3. The High-Conviction Value Zone: The $200.00 Psychological Support
Beyond the Fibonacci calculations, the $200.00 threshold stands as a critical major support. This round number carries immense psychological weight and often serves as a magnet for price action and a focal point for institutional buyers. The convergence of this major psychological level with the deep 61.8% Fibonacci retracement in the $205-$200 range creates a high-probability zone for a substantial buyer response.
Strategic Outlook & Scenario Planning:
Bearish Scenario (Immediate): The near-term momentum is bearish. Rallies are likely to be sold into, with the broken Bull Flag pattern (now resistance) capping any upward movements. The initial downside target is the $205.61 support zone.
Accumulation Scenario (Strategic): Our primary interest lies in the $205-$200 support band. A stabilization and reversal from this area, particularly on bullish volume patterns, would signal that the corrective phase may be complete and offer a compelling opportunity to establish or add to a position. A further decline toward the $167.52 level would represent a steeper de-valuation but would require a reassessment of the fundamental thesis.
In conclusion, while the breakdown is unequivocally bearish in the short term, it is also creating a potential value opportunity. The strategy is to exercise patience, allowing the sell-off to exhaust itself near the key technical and psychological supports at $205-$200, where the risk-reward profile becomes increasingly favorable for a strategic long-term entry.
