Bitcoin AnalysisBitcoin is currently moving within a defined price channel, and at the moment, it is trading near the top (resistance) of the channel.
This area often acts as a supply zone, where sellers tend to step in. Therefore, it may be a good opportunity to consider a short position, especially if it's supported by confirmation signals like divergence, reversal candlestick patterns, or other technical resistances.
As always, don’t forget to apply proper risk management, set your Take Profit levels, and consider Risk-Free strategies in case the market turns unexpectedly — especially in the high-volatility crypto environment.
Oscillators

QQQ, Weekly RSI has reached oversold territory just 4 other timeIt's also came at or near a long-term bottom.
If you're a long-biased trader looking for high-probability entries, this setup deserves your attention.
The weekly RSI just hit oversold territory — something that’s only happened 4 times in the last 10 years. Each of those times? It marked a major bottom or the start of a strong bullish trend.
We’re also bouncing near long-term horizontal support (~$420) and holding above a rising trendline that’s defined the bull market since 2018.
If price continues to hold this zone and RSI starts curling back up, I’ll be looking to go long.
Stop below $420. Reward-to-risk looks solid if momentum confirms.
Not calling the exact bottom — just positioning where the risk makes sense.

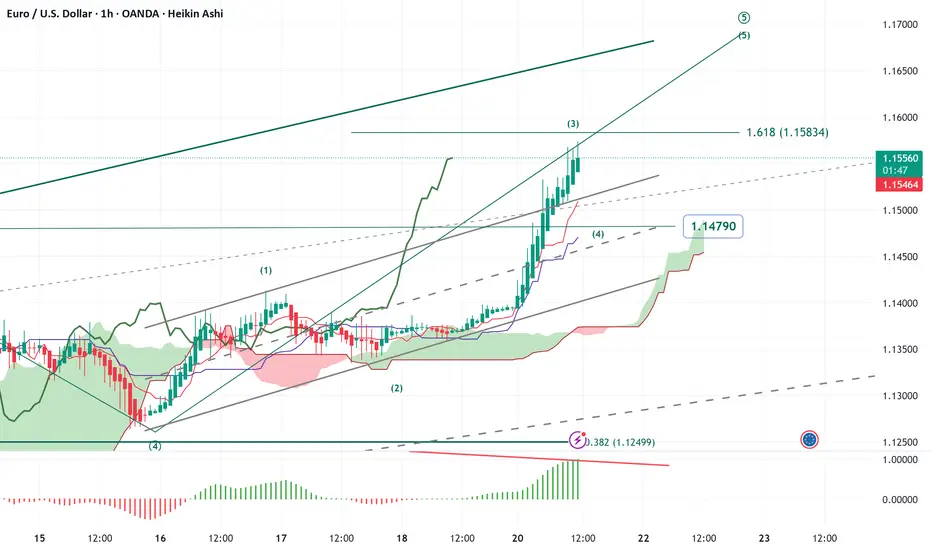
EWTSU EURUSD H1 minuette ((iii)) is going to end
Elliott wave trade setup EURUSD H1
minuette ((iii)) is going to end
micro wave ((5)) of subminuette v of minute (iii) is going to end in five waves:
micro wave degree is developping -> (3)-(4)-(5)
once minute ((iii)) is finished corrective minuette (iv) should follow
EWTS XAUUSD H1 subminuette v developping
Elliott wave trading setup XAUUSD H1
subminuette wave v of minuette wave (i) going to end in 5 micro waves.
once minuette wave (i) is finished then minuette wave (ii) should follow in a corrective mode

What If Trump’s Tariffs Are Actually Bullish for SPX ?Hello Traders 🐺
In this idea, I want to take a closer look at SPX and break down why the new U.S. tariffs and Trump’s economic policies could either boost or damage the U.S. economy in the coming months. So make sure to stay with me until the very end.
🔍 Let’s start with the chart:
As you can see, SPX is currently holding above a weekly support level, marked by the orange ascending trendline. So far, so good. However, we’re also seeing a massive bearish divergence on the RSI — and in my opinion, this was one of the key reasons behind the recent Black Monday-style selloff.
⚠️ But here’s the deal: If SPX breaks below this orange trendline, the next strong support is around 3375 — aligned with the 0.5 Fibonacci level and the monthly blue trendline inside our green support zone.
🤔 Should we be bearish on SPX and the U.S. economy?
That’s the big question… and it’s tricky to answer right now. Let’s break it down.
🔧 1. Tariffs and Trump: What’s really going on?
We’re currently in a pause phase of the ongoing tariff war — with countries negotiating to avoid escalation. But here’s the catch: markets hate uncertainty, and that’s why we saw panic selling recently.
Still, most people miss the bigger picture here.
The U.S. has long been a consumer-driven economy, importing heavily from other nations. Meanwhile, U.S. producers have struggled to compete — both domestically and internationally — due to low tariffs at home and high tariffs abroad.
So what do Trump’s new tariffs do?
✅ They level the playing field for U.S. companies at home
✅ They push other countries to lower their tariffs through negotiation
✅ They reduce dependency on foreign imports and support domestic production
In short, if combined with smart monetary policy, these moves could actually help revive U.S. manufacturing and strengthen the economy in the mid-to-long term.
📉 Final thoughts on SPX:
I personally don’t believe the bearish breakdown is coming — but as a trader, I focus on reality, not preference. Right now, we’re still holding above major support, and unless that breaks, the bullish scenario remains in play.
Let me know what you think about this macro setup in the comments.
And as always remember:
🐺 Discipline is rarely enjoyable, but almost always profitable 🐺
🐺 KIU_COIN 🐺

Bitcoin UP!A new Bitcoin ATH appearance is possible after saying Hello! to our green rising trend line from way back!
Relationship between trendline and StochRSI
Hello, traders.
If you "Follow", you can always get new information quickly.
Please click "Boost".
Have a nice day today.
-------------------------------------
I think that everything used in chart analysis should be objective so that everyone can understand it.
If not, I think that if we start complaining about the different interpretations used in chart analysis, the essence may be damaged.
Therefore, I am trying to present a method that anyone can understand and draw in the same way.
In that sense, I have talked about the method of drawing trendlines several times.
Today, I will explain additional parts that were not covered in the previous drawing methods.
To set it like the StochRSI indicator on this chart,
- Source value: ohlc4
- Setting value: 14, 7, 3, 3 (RSI, Stoch, K, D)
You can set it like this.
-
A trend line is literally a line drawn to find out the trend.
It can also be used to predict how the current trend will change in the future.
However, since a trend line is drawn for chart analysis, what we need to draw importantly is the support and resistance points on the 1M, 1W, and 1D charts.
-
The trend line currently drawn is as follows.
Trend line (1): Trend line between lows drawn on 1W chart
Trend line (2), (6): Trend line between lows drawn on 1D chart
Trend line (3), (4): Trend line between highs drawn on 1D chart
Trend line (5): Trend line drawn on 1M chart
Therefore, in order to continue the uptrend in the medium to long term, the price should be maintained above trend line (1).
Similarly, in order to continue the uptrend in the long term, the price should be maintained above trend line (5).
-
The trend line is drawn by connecting the points between the highs or lows of the StochRSI indicator.
The StochRSI indicator creates waves in any case.
However, when creating waves, you should consider that the points necessary for drawing the trend line have been formed by touching the overbought and oversold areas and draw them.
Therefore, the points of the A and B sections of the StochRSI indicator are ambiguous points for drawing trend lines.
The solution to these points is the same as the trend line drawn above.
That is, the trend line is operated by connecting the points of the A section or the B section based on the last point created by touching the overbought or oversold section.
At this time, the important thing is that it must have escaped the overbought or oversold section.
The trend line (3) and trend line (4) drawn in this way form an expansion channel.
Therefore, once the decline begins, you can see that there is a possibility of a large decline.
However, as I mentioned earlier, the trend line was drawn to analyze the chart.
Therefore, you need to check the importance of the support and resistance points drawn in the area to see if it will actually lead to a decline.
Currently, the important support and resistance range from a short-term perspective is 76322.42-78595.86.
And, from a medium- to long-term perspective, the important support and resistance range is 69000-73499.86.
Therefore, even if it falls below trend line (4) and shows a large decline, it is expected that it will not be easy to touch trend line (3).
-
Trend line (2) and trend line (6) are trend lines drawn between low points on the 1D chart.
Therefore, even if it falls, it is highly likely that the area around trend line (6) will be the maximum.
In other words, even if the decline begins, it is highly likely that it will re-confirm the support around 76322.42-78595.86.
-
In any case, this volatility period ended without any significant movement.
The next volatility period is around April 25-29.
Since the StochRSI indicator is clearly showing a downward trend in the overbought zone, the key is whether there is support around 83423.84-84591.59.
If the price is maintained above the 1D chart, there is a high possibility of maintaining a short-term uptrend.
However, from a trading perspective, it should show support near the HA-Low indicator on the 1D chart to be a trading period.
Therefore, whether there is support near 89294.25 is important.
-
Therefore, we are troubled.
Should we buy when it is supported in the current zone, 83423.84-84591.59, or should we buy when it is supported near 89294.25?
If the StochRSI indicator rises above the 50 point, it is better to focus on finding a time to sell, and if it falls below the 50 point, it is better to focus on finding a time to buy.
If you look at the chart again with this information, you can decide that it is better to wait a little longer rather than proceed with the current transaction.
-
In the previous idea, I said that if it rises to around 89294.25, there will be a psychological feeling that it will rise further, and you will try to make a breakout trade.
At this time, what we should be interested in is whether the trend line between the lows and the trend line between the highs are formed in the same direction.
And, whether the StochRSI indicator shows an upward trend below the 50 point.
If it does not show such a movement, it is highly likely that it will shake up and down with a large fluctuation range.
Therefore, it is absolutely necessary to check whether it is supported near 89294.25.
Checking support and resistance is a tedious and difficult task.
Checking support and resistance requires checking the movement for at least 1-3 days.
-
The fact that the HA-Low indicator was created means that it rose from the low point range.
Since it has currently fallen below the HA-Low indicator, it can be interpreted that it has fallen back to the low point.
Therefore, in order for an uptrend to begin, the trading volume must increase when confirming support near the HA-Low indicator.
If the trading volume does not increase and it rises, it may not rise much and turn into a downtrend, so you should think about a countermeasure for this.
-
Thank you for reading to the end.
I hope you have a successful transaction.
--------------------------------------------------

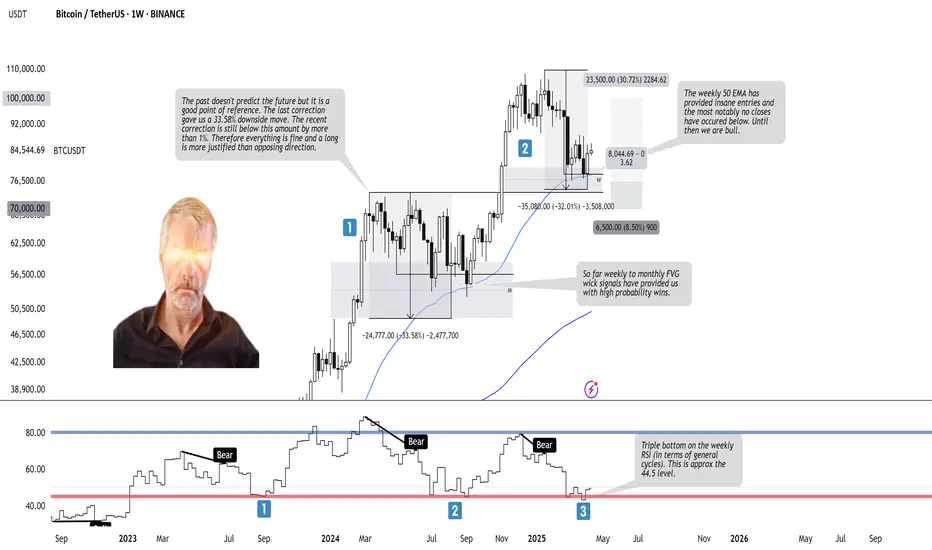
BTCUSDT - Trade Log BTCUSDT – Weekly Bullish Outlook
Weekly Context: Price has held the weekly Fair Value Gap and bounced off the 50 EMA, with clean wick rejections signaling strong buyer demand. The recent pullback (~32% from ATH) remains within historical correction bounds, and the tiny current retrace (<1%) suggests low downside risk. A triple bottom on the weekly RSI cycle around 40 further supports a bullish reversal.
Trade Plan (Long):
– Entry: Add longs near the weekly FVG / 50 EMA (around 75–87k).
– Stop: Place just below the FVG low (≈70k), risking ~5% of account.
– Target: First at 100k (psychological level), then previous ATH region for a 1:3+ RRR.
Bullish Catalysts:
• Weekly 50 EMA has only closed below twice—support intact.
• Weekly FVG wick signals have historically delivered high-probability bounces.
• Triple bottom on weekly RSI signals major capitulation is complete.
• Macro backdrop (equities & gold) remains positive for BTC.
Stay alert for any decisive weekly close below the EMA—until then, the bulls remain in control. 🚀
LINK Potential Falling Channel Reversal + RSI SignalsBINANCE:LINKUSDT has been in a downtrend since December, grinding inside a falling channel for 2 months, and it's now sitting right above the key ~$10.00 demand zone.
Price Action
• Price is respecting both bounds of a well-defined falling channel.
• Currently consolidating just above the demand area, early signs of potential strength.
RSI Insights
• Clear bullish divergence at demand zone retest.
• RSI could be approaching a breakout of its multi-month downtrend — worth watching closely.
Key Zones
• Support: $9.5–$10.5 is critical. It held last time and could fuel a reversal. If broken, it would invalidate the setup.
• Resistance: Falling channel upper boundary.
• Confirmation: RSI breakout + channel breakout = potential confirmation of trend reversal.
Also watch $15.5-$16 (previous S/R) and the whole $18-$20 area, which previously acted as support and has a high volume traded. Both could be good levels to take profits, together with the main supply zone in the $25-$27 area.
Still in a No-Trade Zone until a breakout is confirmed.

These 3 Things Will Show You How To Take Profit On Trades.Its been a crazy week.This is because i am developing
a new trading strategy.Trying to learn something new
is not easy at all.
When you look at this chart you will see:
-The cross below the 20 level
-The blue line is above the orange line
-The Stochastic has coordinates
These 3 things will show you how to take profit on
trades.Also they will show you when to enter them.
i had to change Stochastic coordinates
to show you the "Dip Buy" Strategy.
This strategy is based on buying
prices that are cheap.
It is not easy to follow.Because when you decide to
buy at these prices,You are going against the crowd.
To take profit , you have to exit at the top of this indicator.
This is why these coordinates are important.The purpose
is to show you when to take profit, and how to take profit.
This will help you on your trading path.
Rocket boost this content to learn more.
Disclaimer:Trading is risky please risk management
and profit taking strategies.Also feel free to
use a simulation trading account.

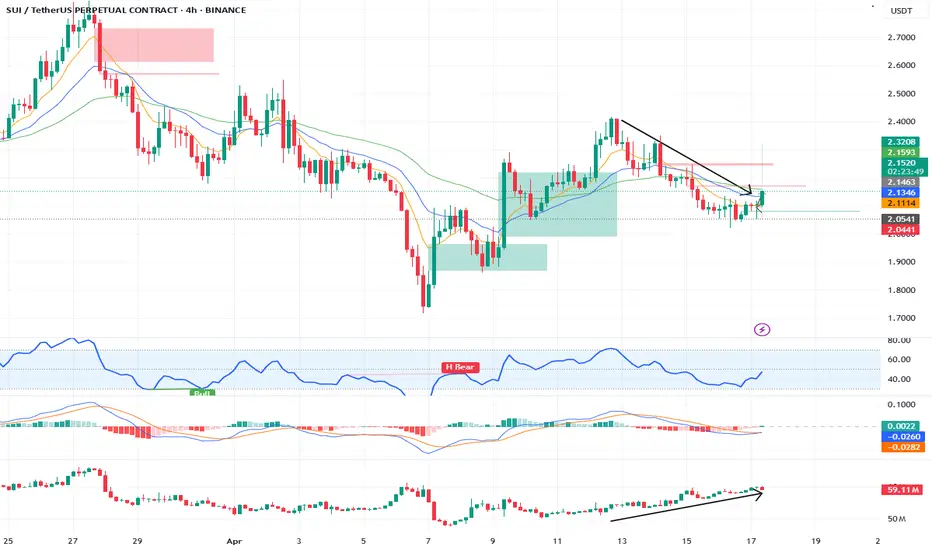
Long setup on SUISetting up long for SUI.
Using 4H time frame.
You can see OI increasing and Price decreasing which is divergence.
Silver Bulls Breaks Resistance, Eyes on $34.57 RetestThe upside risk we flagged earlier this week has now materialised for silver, with the spot price staging a bullish break above the 50-day moving average, resistance at $32.73, and the December 2024 uptrend on Wednesday.
Having closed above this former resistance zone, it may now provide a base for fresh longs targeting a retest of the March 28 swing high at $34.57. Levels to watch in between include Wednesday’s high at $32.16 and $33.50 which acted as support around the turn of the month. A stop loss beneath the uptrend would offer protection should the trade move against you.
While momentum indicators remain more neutral than outright bullish, the bias is to the upside following the breakout and ongoing trends in RSI (14) and MACD.
Good luck!
DS

Apple – More Pain to come? Apple’s NASDAQ:AAPL chart right now? Honestly, it’s a mess. It’s one of those setups where you can’t confidently say much with conviction , but one thing feels clear to me: it should go lower before it gets better.
Zooming out to the 3-day timeframe , you can spot something interesting: the downtrend from 2022 to 2023 looks almost identical to the one we’ve seen from July 2023 to April 2024 — same structure, same slow bleed, and almost the exact same duration. That kind of symmetry doesn’t happen by accident.
After that, we had a massive rally from April/May 2024 , but now we’re already seeing a sharp retracement — down over 35%. My take? We probably need one more leg lower to really shake things out before Apple makes a meaningful move higher, maybe toward $250–$260 .
To get there, I think we still need to retest the $160–$150 zone. If we break below that and head toward $120, then we’re in real trouble structurally — that would shift the whole outlook.
Yes, the recent bounce from the VWAP level was clean , and it looked strong — but I wouldn’t rule out one more flush before we get the real recovery. Apple is in no-man’s-land right now, and until we hit key levels or reclaim broken structure, it’s caution over confidence.

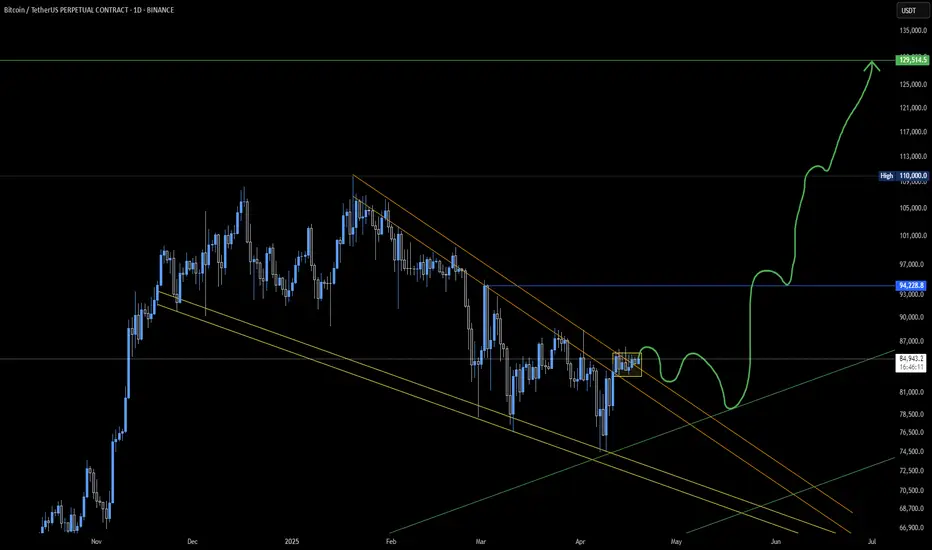
Bitcoin is heading into its final low before bull market?Bitcoin got rejected at the 1-Day Cycle top and is now pulling back toward the 1-Day Cycle lows.
While most investors are getting bored and slowly shifting their attention elsewhere, crypto is quietly consolidating and gearing up for a BIG move...
Will we break above $100K, or are we heading into a recession and full-on bear market mode?
Next week will be a decisive one for the entire crypto market this year.
If Bitcoin manages to hold above $77,000 as the 1-Day Cycle hits Day 20, we could be on the verge of a run toward $100K. But if we drop below the previous 1-Day Cycle low, trouble’s coming.
Confused? Just check out this chart.
It’s easy to lay out both the bullish and bearish cases—but it’s a whole different game to quantify, commit to a position, and wait for the more probable outcome to play out.
Which scenario is more likely?
In short: the green one . Here’s why:
The 2-Week Cycle has spent over 4 weeks below 20, completely crushing bullish sentiment.
The 1-Week Cycle has been below 20 for over 2 months—the longest stretch in the past 5 years.
The 3-Day Cycle hasn’t fully reset, but reversed to the upside last week due to positive price action.
We’re on Day 46 of the 60-Day Cycle, and price has been holding up well. We’ve tested the $80K zone a couple of times, and Bitcoin still seems eager to push higher.
For the first time in a while, there are more bears than bulls (according to Polymarket).
On that note—check the Polymarket predictions

BTC.D Bitcoin Dominance!Are you ready for a big Altcoin rally? We are facing an Altcoin Season that may not last long. Load Your Bullets!

Bitcoin: Shooting Star Breaks Wedge, Bearish Bias BuildsDownside risks appear to be growing for bitcoin with Tuesday’s shooting star candle triggering a bearish break of the rising wedge it had been sitting in over the past week.
Shorts could be established on the break with a stop above Tuesday’s high for protection. Some may opt for the 200DMA as a trade target, but the preference would be to look for a return to the lows beneath $75,000 hit last week.
The neutral momentum picture is also showing signs of turning bearish, with RSI (14) breaking its uptrend as a result of the latest pullback. While RSI is trending higher, it remains in negative territory, indicating downside momentum is only lessening—not reversing entirely.
Good luck!
DS
