Warning signs build for bullsContinued topside failures combined with an evening star pattern on the daily should have silver traders on alert for potential downside in the days ahead.
You can’t help but notice how feeble the bounce has been relative to the rout seen in October, with price consistently struggling above $49, which just happens to be the 38.2% fib retracement of the October high-low range. Five separate failures above the level were telling, perhaps explaining why we saw an eventual pullback on Monday, delivering an obvious evening star pattern on the daily that warns of downside risk. With momentum indicators turning neutral, the price signal suggests short setups may be the way to play near term.
$48.00 has seen plenty of action either side recently, making it a candidate to build a bearish setup around. Shorts could be set beneath with a stop above for protection, targeting either $46, which offered support previously, or the October 28 swing low of $45.56. In between, the 23.6% fib of the October high-low is found at $47.67. Given the price has respected other retracements, it’s a level of note. Minor support is also located 40 cents lower at $47.27. Unless you’re only interested in ultra-short-term setups, price action at these levels should be monitored rather than treated as targets for the trade.
Good luck!
DS
Oscillators

BCHUSDT- Bears Taking Control? Massive Downside Move Loading!Yello Paradisers, BCHUSDT is showing signs of a potential bearish move as it has displayed a bearish CHoCH with bearish divergence on MACD histogram after an accumulation and manipulation phase, which increases the probability of a downside move.
💎 For entries, we can expect a rejection from the FVG zone and target the liquidity levels below. Safe traders can wait for a bearish candlestick pattern confirmation around the FVG area before entering to ensure a higher probability setup.
💎 However, if the price breaks out and closes a candle above the invalidation level, it will invalidate our entire bearish idea.
💎In that case, it would be better to wait for more favorable price action to form before taking any positions.
🎖Strive for consistency, not quick profits. Treat the market as a businessman, not as a gambler.
MyCryptoParadise
iFeel the success🌴

EUR/AUD downside pressure intensifiesEUR/AUD finds itself just above a key zone consisting of horizontal support at 1.7600 and the key 200-day moving average, providing decent two-way trade setups depending on how the near-term price action evolves.
Should we see a break and close beneath both levels, it would allow for shorts to be established below the 200DMA with a stop above for protection, targeting 1.7465 or 1.7400 initially depending on desired risk/reward from the trade. The option would also be there to sell the break should we see a close beneath 1.7600, allowing for a stop to be placed above targeting the same levels. However, consider squaring or even flipping the trade should the price be unable to break beneath the 200DMA.
Should the price continue to hold above 1.7600, you could flip the setup and establish longs, allowing for a stop to be placed beneath the 200DMA for protection. 1.7726 or the intersection of the 50DMA with horizontal resistance at 1.7800 screen as logical targets.
Momentum indicators favour downside over upside, increasing the appeal of bearish setups. RSI (14) is trending lower beneath 50, pointing to building downside pressure. MACD has confirmed the bearish message, crossing the signal line from above before pushing into negative territory.
Good luck!
DS

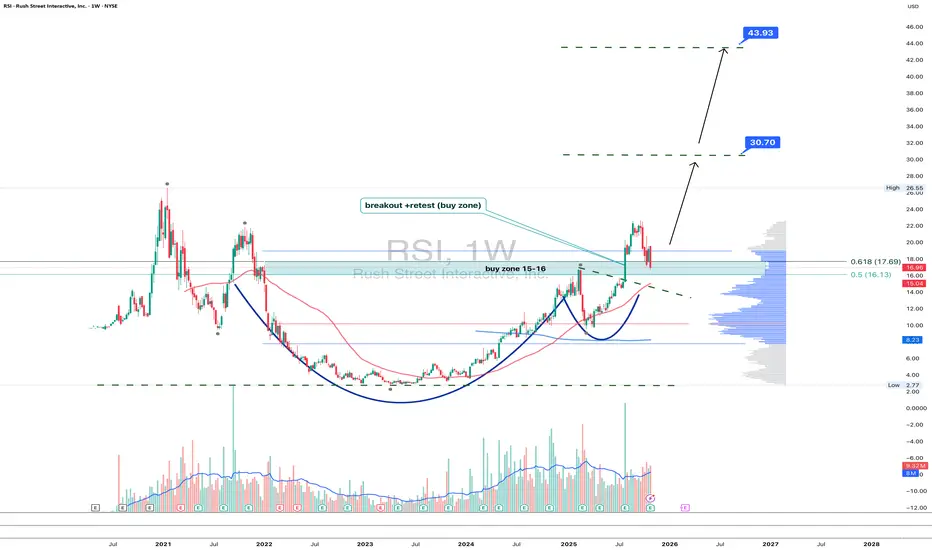
RSI 1W - gambling or smart retest?Rush Street Interactive (RSI) just confirmed a breakout above the 15–16 zone with a textbook retest - a classic bullish setup. The weekly chart shows a clean “cup and handle” structure backed by rising volume. Current pullback is forming right inside the buy zone, suggesting potential continuation.
Fibonacci extensions highlight 30.7 and 43.9 as key upside targets. As long as price holds above 15.5–16.0, the bullish bias stays intact. A breakout above 18.0 would confirm the next leg higher.
Fundamentally , RSI benefits from ongoing online gambling legalization across the US and improving profitability in core states, which could attract institutional inflows.
In the gambling world, luck rarely repeats - but this chart looks like the house might finally lose.
Let it continue.Positive news.
OTHERS remained above the 50 line on the RSI.
Volatility is increasing, judging by the SQZMOM.

Has Bitcoin already priced in its next move ? | Day 56☃️ Welcome to the cryptos winter , I hope you’ve started your day well.
⏰ We’re analyzing BTC on the 1-Day timeframe .
👀 Bitcoin on the daily timeframe. After the flash crash it experienced, Bitcoin is almost building a box with a top at $114,559 and a bottom at $106,431, which by breaking these areas, it can get out of this trading range and give us a position.
The noteworthy point in the recent days is the Monday meeting between Trump and the President of China, which can determine the destiny of the market and give it a good direction.
🧮 The RSI oscillator, two key zones have formed for us in the areas of 54.5 and 36, and by the fluctuation limit crossing these areas, the next move of Bitcoin can begin.
🕯 Bitcoin’s volume on the daily timeframe has increased sharply after recording a new all-time high, and this has been a tendency toward increasing selling pressure. In the image, it is completely clear that you can see exactly what happened to the market after the flash crash it experienced.
📈 To take a position with this structural style that we currently have, you can refer to the multi-timeframe analysis of Bitcoin and extract the long and short position triggers, and if Bitcoin gives you an entry, enter the position around the anticipated top or bottom with low risk so that later you can add more volume to your position at higher or lower levels.
❤️ Disclaimer : This analysis is purely based on my personal opinion and I only trade if the stated triggers are activated .

ASX SPI futures test key uptrend as bears circleAustralian ASX 200 SPI futures look vulnerable, with bearish signals continuing to pile up on the charts.
On the left-hand side, we can see price trading beneath the 50-day moving average, a level it bounced from strongly when tested earlier in the year. Having closed beneath it on Thursday, another bounce was seen in overnight trade where volumes are typically far lower than the day session. However, so far, the rally was sold into, leaving price dangling just above uptrend support.
While it comes with the disclaimer that price action around month-end always needs to be treated with caution, unless we see a solid bounce during the day session, the unconvincing price action over the past week may be enough to encourage bears to seek out lower levels.
The momentum picture has turned noticeably over recent weeks, with RSI (14) trending lower and now beneath 50, indicating pressure is swinging to the downside. MACD also points to waning topside pressure, having crossed the signal line before moving sharply lower towards negative territory. At the very least, it suggests momentum is turning, increasing the probability of bearish setups playing out.
On the weekly timeframe on the right, as things currently stand, we’re staring at a bearish engulfing candle—another warning sign that downside may be looming. It’s obviously not completed yet, but without a meaningful rally on Friday, it may not be lost on other traders, especially given how poor price action has been recently.
If we see a break and close beneath the May uptrend, shorts could be established below the level with a stop above for protection. Possible downside levels to target include 8830, 8750 or 8600, depending on desired risk-reward from the trade.
Should price continue to hold the uptrend and bounce back above the 50DMA and close there, the setup could be flipped, with longs established above the moving average and a stop beneath the uptrend. A break above minor resistance at 8950 could open the door for a potential run back towards the record highs.
Good luck!
DS

#ZECUSDT #1D (ByBit) Rising wedge near breakdownZcash had a great bull run but looks exhausted right now on daily TF.
It's printing a bearish divergence between price and volume + RSI, a retracement seems likely.
⚡️⚡️ #ZEC/USDT ⚡️⚡️
Exchanges: Bitget Futures
Signal Type: Regular (Short)
Leverage: Isolated (3.0X)
Amount: 3.9%
Current Price:
353.99
Entry Zone:
355.71 - 392.39
Take-Profit Targets:
1) 298.48
2) 241.58
3) 184.67
Stop Targets:
1) 437.28
Published By: @Zblaba
CRYPTOCAP:ZEC BYBIT:ZECUSDT.P #1D #Zcash #Privacy z.cash
Risk/Reward= 1:1.2 | 1:2.1 | 1:3.0
Expected Profit= +60.6% | +106.2% | +151.9%
Possible Loss= -50.7%
Estimated Gaintime= 1-2 months

Kroger May Be CrumblingKroger hasn’t made a new high since August, and some traders may think the grocery chain is starting a downtrend.
The first pattern on today’s chart is the September 11 candle after quarterly results. KR tried to rally but couldn’t hold the gains. Two weeks ago, it stalled near that session’s high of $69.89. Has new resistance been established below the old peak?
Second, the 50-day simple moving average (SMA) is on the verge of a potential “death cross” below the 200-day SMA. That may suggest the long-term trend is getting bearish.
Third, the 8-day exponential moving average (EMA) crossed below the 21-day EMA. MACD is also falling. Those signals are potentially consistent with short-term bearishness.
TradeStation has, for decades, advanced the trading industry, providing access to stocks, options and futures. If you're born to trade, we could be for you. See our Overview for more.
Past performance, whether actual or indicated by historical tests of strategies, is no guarantee of future performance or success. There is a possibility that you may sustain a loss equal to or greater than your entire investment regardless of which asset class you trade (equities, options or futures); therefore, you should not invest or risk money that you cannot afford to lose. Online trading is not suitable for all investors. View the document titled Characteristics and Risks of Standardized Options at www.TradeStation.com . Before trading any asset class, customers must read the relevant risk disclosure statements on www.TradeStation.com . System access and trade placement and execution may be delayed or fail due to market volatility and volume, quote delays, system and software errors, Internet traffic, outages and other factors.
Securities and futures trading is offered to self-directed customers by TradeStation Securities, Inc., a broker-dealer registered with the Securities and Exchange Commission and a futures commission merchant licensed with the Commodity Futures Trading Commission). TradeStation Securities is a member of the Financial Industry Regulatory Authority, the National Futures Association, and a number of exchanges.
TradeStation Securities, Inc. and TradeStation Technologies, Inc. are each wholly owned subsidiaries of TradeStation Group, Inc., both operating, and providing products and services, under the TradeStation brand and trademark. When applying for, or purchasing, accounts, subscriptions, products and services, it is important that you know which company you will be dealing with. Visit www.TradeStation.com for further important information explaining what this means.

Frame shift. We pay so much attention to the opposition between OTHERS and BTC...
But when I opened the weekly chart for OTHERS.D/BTC.D, I didn't find anything remarkable. The RSI curve is in the middle of the range and showed a decline, but without any extremes.
But when I opened OTHERS.D/ETH.D and turned on Reverse RSI (you can also find it on the good old RSI by simply drawing lines by hand), the situation turned out to be much more interesting.
I have a theory for you. The last altcoin dump occurred primarily in ether pairs. And it was associated, among other things, with a cunning capital outflow.
Back in August, the RSI in this pair reached a historic low, never having fallen into the “basement” since 2017.
Now look at the October drop.
This is a bullish divergence. In addition, there is a bullish momentum indicator.
Most likely, we are seeing a very slow flow into altcoins, for which the price of OTHERS was sharply knocked down through ether pairs.
The candle found support on the moving average.

WTI bounce in the making?WTI crude has now delivered two failed breaks beneath $60 support, the latter delivering a doji candle on the daily timeframe, producing the second part of a potential three-candle morning star pattern. With risk sentiment perking up again as traders anticipate a likely deal between Donald Trump and Xi Jinping to reset trade relations between the U.S. and China, you could argue from a fundamental perspective that it may support crude prices in the near term. That outcome would likely see the bullish reversal pattern completed.
Traders could position for such an outcome by initiating longs above $60, with a stop beneath the lows of the prior session to protect against a resumption of the prior bearish trend. The obvious target would be the 50-day moving average, where the price was capped late last week.
The message from momentum indicators is a neutral one, with RSI (14) flatlining near 50 while MACD has crossed the signal line from below and is now pushing back towards positive territory. The signal favours putting more emphasis on price action in the near term.
Good luck!
DS

Ford’s 50% RetracementFord Motor jumped last week, and some traders may think there’s still gas in the tank.
The first pattern on today’s chart is the rally after third-quarter results beat estimates. The surge overcame a resistance level from earlier in the month and established a new 15-month high for the Dearborn automaker.
Second, F pulled back but is holding a 50 percent retracement of the move. That may confirm its direction is pointing higher.
Third, MACD is rising. The 8-day exponential moving average (EMA) is also above the 21-day EMA. Those signals may reflect a bullish short-term trend.
Finally, F is an active underlier in the options market. (Its average volume of about 260,000 contracts per session in the last month ranks 15th in the S&P 500, according to TradeStation data.) That could help traders take positions with calls and puts.
TradeStation has, for decades, advanced the trading industry, providing access to stocks, options and futures. If you're born to trade, we could be for you. See our Overview for more.
Past performance, whether actual or indicated by historical tests of strategies, is no guarantee of future performance or success. There is a possibility that you may sustain a loss equal to or greater than your entire investment regardless of which asset class you trade (equities, options or futures); therefore, you should not invest or risk money that you cannot afford to lose. Online trading is not suitable for all investors. View the document titled Characteristics and Risks of Standardized Options at www.TradeStation.com . Before trading any asset class, customers must read the relevant risk disclosure statements on www.TradeStation.com . System access and trade placement and execution may be delayed or fail due to market volatility and volume, quote delays, system and software errors, Internet traffic, outages and other factors.
Securities and futures trading is offered to self-directed customers by TradeStation Securities, Inc., a broker-dealer registered with the Securities and Exchange Commission and a futures commission merchant licensed with the Commodity Futures Trading Commission). TradeStation Securities is a member of the Financial Industry Regulatory Authority, the National Futures Association, and a number of exchanges.
Options trading is not suitable for all investors. Your TradeStation Securities’ account application to trade options will be considered and approved or disapproved based on all relevant factors, including your trading experience. See www.TradeStation.com . Visit www.TradeStation.com for full details on the costs and fees associated with options.
Margin trading involves risks, and it is important that you fully understand those risks before trading on margin. The Margin Disclosure Statement outlines many of those risks, including that you can lose more funds than you deposit in your margin account; your brokerage firm can force the sale of securities in your account; your brokerage firm can sell your securities without contacting you; and you are not entitled to an extension of time on a margin call. Review the Margin Disclosure Statement at www.TradeStation.com .
TradeStation Securities, Inc. and TradeStation Technologies, Inc. are each wholly owned subsidiaries of TradeStation Group, Inc., both operating, and providing products and services, under the TradeStation brand and trademark. When applying for, or purchasing, accounts, subscriptions, products and services, it is important that you know which company you will be dealing with. Visit www.TradeStation.com for further important information explaining what this means.

INTC Target Hit, Now Showing Another Bullish Setup!INTC - CURRENT PRICE : 41.53
My earlier INTC buy call has reached its projected targets. The previous analysis is shared below for reference.
Technical Highlights
1) New 52-week High – Price has broken into a fresh yearly high, confirming strong bullish momentum.
2) Pennant Breakout – The breakout from a bullish pennant pattern suggests continuation of the prior uptrend, with a potential target of $49 based on the pattern projection.
3) Golden Cross Intact – The 50-day EMA remains above the 200-day EMA, maintaining the long-term bullish bias.
4) RSI in Bullish Territory – RSI remains above 70, indicating strong momentum and persistent buying strength.
ENTRY PRICE : 40.00 - 42.00
FIRST TARGET : 45.00
SECOND TARGET : 49.00
SUPPORT : 36.43 (the low of 23 OCTOBER 2025 candle)

$GOLD is COOKED! Rotation into $BTC Soon!!MARKETS ARE SIGNALING RISK-ON 🔥
TVC:GOLD is so unbelievably COOKED 👨🍳
3 Black Crowes printed on the Daily, with a decisive close below the 20MA 🗡️
Waiting on the final nail in the coffin to close below the DANGER ZONE ~$3,900 where we will then see GOLD retest the 50MA along with the 50% Gann retrace $~3,750 ⚠️
I very much expect the rotation into CRYPTOCAP:BTC soon 👑

USD/CAD: Bears Take Control as 200DMA CracksFrom a technical standpoint, the short-term directional bias for USD/CAD is now swinging lower. While the longer-term uptrend remains firmly in place, the pair now finds itself in a minor downtrend, grinding lower for much of the past few weeks. Ahead of the FOMC and BoC decisions, the latest leg lower through minor support at 1.3980 saw it breach and close beneath the 200-day moving average.
One glance at the charts underlines just how important the level has been this year, capping and supporting the price for long periods once crossed. Now sitting above the pair with a negative slope, it may embolden bears to seek out further downside, allowing for setups where stops can be placed above it to protect against the risk of an abrupt reversal. For those considering bearish setups on the break, the preference would be to see a retest and rejection at the 200-day moving average before entry, with a sustained push beneath 1.3940 only enhancing the merits of the trade.
1.3900 looms as an initial target given it acted as both support and resistance earlier this year. With the 50-day moving average found just below it, the confluence of these levels will likely provide a decent hurdle for bears, should the price get there. 1.3830 is a minor level found below with the July uptrend sitting around the same region today.
Should the break of the 200-day moving average prove to be a bear trap with a reversal soon to follow, the favoured bearish setup could be flipped, allowing for longs to be established above with a stop below for protection. Again, if a reversal were to take place, the preference would be to see a back-test and bounce from the 200-day before entering the trade. 1.3980 looms as the first potential target with 1.4050 and 1.4080 options after that.
The momentum picture has changed noticeably over the past fortnight, with RSI (14) now trending lower beneath 50, indicating slowly building downside pressure. MACD has also staged a bearish crossover of the signal line but remains in positive territory, providing a cautionary message to bulls that directional strength is shifting.
Good luck!
DS

Will Nucor Start Moving?Steelmaker Nucor has done little for years, but some traders may think it’s ready to start moving again.
The first pattern on today’s chart is the basing pattern between $132 and $140. Prices have broken above that range this week and also crossed the 50-day simple moving average (SMA). That may suggest a period of consolidation has ended.
Second, longer-term moving averages have aligned in a potentially bullish way. The 50-day SMA had a “golden cross” above the 200-day SMA in August and the 100-day SMA rose above the 200-day SMA last month. (See white arrows.)
Third, the 8-day exponential moving average (EMA) just crossed above the 21-day EMA. MACD is also rising. Those signals may be consistent with shorter-term bullishness.
Finally, traders may eye the August peak of $151.32 as a potential trigger for a breakout.
TradeStation has, for decades, advanced the trading industry, providing access to stocks, options and futures. If you're born to trade, we could be for you. See our Overview for more.
Past performance, whether actual or indicated by historical tests of strategies, is no guarantee of future performance or success. There is a possibility that you may sustain a loss equal to or greater than your entire investment regardless of which asset class you trade (equities, options or futures); therefore, you should not invest or risk money that you cannot afford to lose. Online trading is not suitable for all investors. View the document titled Characteristics and Risks of Standardized Options at www.TradeStation.com . Before trading any asset class, customers must read the relevant risk disclosure statements on www.TradeStation.com . System access and trade placement and execution may be delayed or fail due to market volatility and volume, quote delays, system and software errors, Internet traffic, outages and other factors.
Securities and futures trading is offered to self-directed customers by TradeStation Securities, Inc., a broker-dealer registered with the Securities and Exchange Commission and a futures commission merchant licensed with the Commodity Futures Trading Commission). TradeStation Securities is a member of the Financial Industry Regulatory Authority, the National Futures Association, and a number of exchanges.
TradeStation Securities, Inc. and TradeStation Technologies, Inc. are each wholly owned subsidiaries of TradeStation Group, Inc., both operating, and providing products and services, under the TradeStation brand and trademark. When applying for, or purchasing, accounts, subscriptions, products and services, it is important that you know which company you will be dealing with. Visit www.TradeStation.com for further important information explaining what this means.

USD/CNH Break Lower Could Target 7.0000Is a possible reset in relations between the world’s two most powerful nations about to see the Chinese yuan strengthen sharply? USD/CNH is coiling in a descending triangle formation, and the risk of a break lower is arguably increasing—even if the reset proves short-lived.
After breaking beneath the 50-day moving average on August 28, USD/CNH tried twice to reclaim the level earlier this month but failed to sustain the move. The pair has since resumed its push lower, leaving it teetering on support at 7.1000 today. The last time USD/CNH attempted to break beneath this level, it triggered a sharp reversal, printing a hammer candle on the daily chart that marked the start of a squeeze higher.
While that move failed, this one may have more success, arriving just before a likely trade deal between the U.S. and China on the sidelines of the APEC summit in South Korea later this week. There’s always the risk the framework could unravel quickly, but the backdrop screens as supportive for the yuan: the Fed is widely expected to cut rates again while retaining a dovish bias, and risk appetite is strong across Asia.
Given the triangle pattern, a close beneath 7.1000 may spark a fresh wave of selling, putting the pair on track for a possible move toward the psychologically important 7.0000 level, based on the height of the triangle.
Shorts could be considered below 7.1000 with a stop above, targeting the September 17 low of 7.0850 initially. Beneath that, price action at 7.0600 and 7.0400 may provide clues as to whether the ultimate target of 7.0000 is likely to be reached.
Momentum indicators are generating strengthening bearish signals. RSI (14) is trending lower below 50 but is not yet oversold. MACD has confirmed by staging a bearish crossover of the signal line in negative territory, indicating downside pressure is building.
Good luck!
DS

EUR/CHF: Watch .9268 for Break or FadeEUR/CHF sits at an interesting level, pressing against the intersection of horizontal and downtrend resistance at .9268 after bouncing from key support at .9211 last week. With momentum indicators now far less bearish than earlier this month, near-term moves could prove instructive for longer-term directional risks. Given we’re dealing with two European currencies, price signals during the European session carry extra weight.
If resistance at .9268 holds, shorts could be considered beneath the level with a stop above to guard against a bullish continuation. The obvious target would be .9211, though price action around .9245 warrants close attention as it aligns with the uptrend from the October 21 low.
Conversely, a close above .9268 would signal the potential start of a new trend, putting higher levels in play. .9300 is not the cleanest level but screens as an initial target, followed by the intersection of the 50DMA and horizontal resistance at .9325.
Momentum shows diminishing downside pressure, with RSI (14) trending higher but still below 50, while MACD is on the cusp of confirming the cautionary message to bears, about to cross the signal line from below while remaining under zero. Selling rallies is therefore marginally favoured, but don’t be wedded to the idea if price signals clearly contradict.
Good luck!
DS

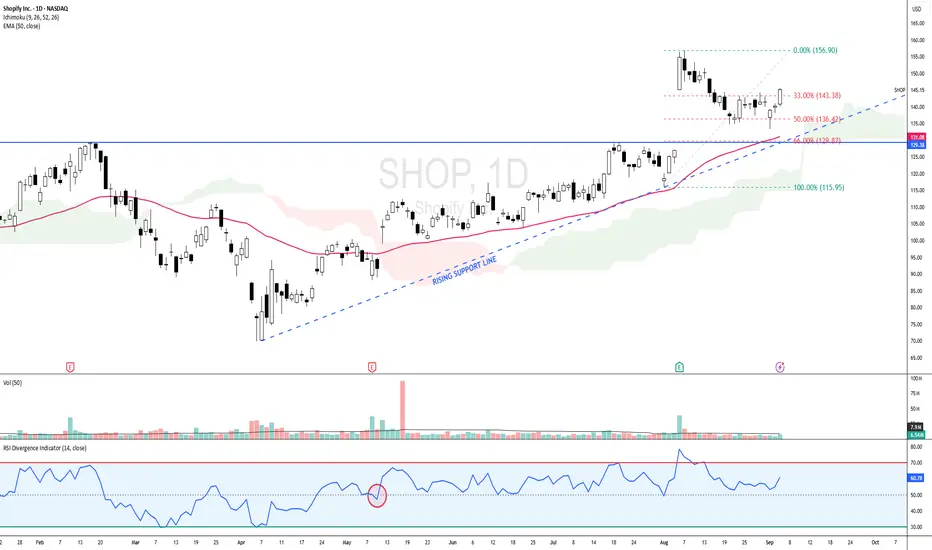
SHOP - BULLISH SCENARIO since 12 MAY 2025 SHOP - CURRENT PRICE : 145.15
SHOP is bullish as the share price is above 50-day EMA. Price action on 12 MAY 2025 is considered starting of bullish scenario because supported by several key indicators :
Share price gap up
Price broke out 50-day EMA
Price moving above ICHIMOKU CLOUD
RSI moving above 50
From 1 August (near 50-day EMA support) to 6 August, the stock recorded a strong upward rally. Following this advance, prices entered a corrective phase and retraced approximately 50% of the prior upswing. According to Dow Theory, such a retracement is considered a normal and healthy correction within an ongoing uptrend. Retracements in the range of one-third to two-thirds of the prior move are typical, with the 50% level often serving as a natural equilibrium point where buyers re-enter the market. Sustaining above the 50% retracement level would reinforce the bullish structure, while a recovery from this zone could pave the way for a retest of the recent highs. However, a decisive break below the 61.8% retracement may imply weakening momentum and a deeper corrective phase.
Take note that until now the share price is still above 50-day EMA and ICHIMOKU CLOUD while RSI also moving steadily above 50 level. There is also rising support line - strengthening bullish outlook.
ENTRY PRICE : 141.00 - 145.50
TARGET : 159.00 and 175.00
SUPPORT : 50-day EMA (CUTLOSS below 50-day EMA on closing basis)
Gold Uptrend in DangerGold is approaching a potentially important moment that could either reinforce the bullish trend or set the stage for a corrective move lower, pushing back towards the intersection of long-running uptrend support and minor horizontal support at $4060.
Twice last week, the price tested this support zone only to bounce strongly, including last Friday when a hammer candle printed on the daily chart. That only reinforces its importance. However, with a three-candle evening star forming if Monday’s candle finishes near current levels, and with RSI (14) and MACD pointing to rapidly diminishing upside strength, directional risks are shifting quickly lower. A break beneath the uptrend, especially on a close, may signal gold has begun a new trend, putting downside levels in play.
If a bearish break occurs, traders could sell with a tight stop above the uptrend to protect against reversal, targeting the psychologically important $4000 level initially. If that gives way, $3950 and $3895 are other nearby support levels, providing multiple target options depending on desired risk/reward.
Alternatively, if the support zone continues to hold, the setup could be flipped with longs established above the trendline and a stop below for protection. $4100 has seen some action recently over shorter timeframes, as have $4155 and $4180. All screen as possible targets.
Good luck!
DS

Recovery is needed.Damn, the picture looks like a carbon copy TSLA.
There may be a few more sideways candles,
but the overall picture points to a correction.
My Steps On how To Improve Forex Trading Win / Loss Ratio In this video we talk about the three elements of the new plan that I have designed based on different types of schools and educational sources.
The plan elements consist of SMC (Smart Money Concepts), Classical School (Support & Resistance, Trend Lines, Febonacci Retracement (not all the time)), and the Stochastic Indicator.
The stochastic is of two timeframes, One is weekly and the other is daily but both are shown on the daily timeframe. This is something that I loved here about TradingView; is the ability to show an indicator of a different timeframe.
Last week I opened a couple of positions based on the new plan, but one of them was opened with haste and not totally adhered to my trading Plan rules.
I show the exact trading rules that I am using and how this will affect my risk management plan.

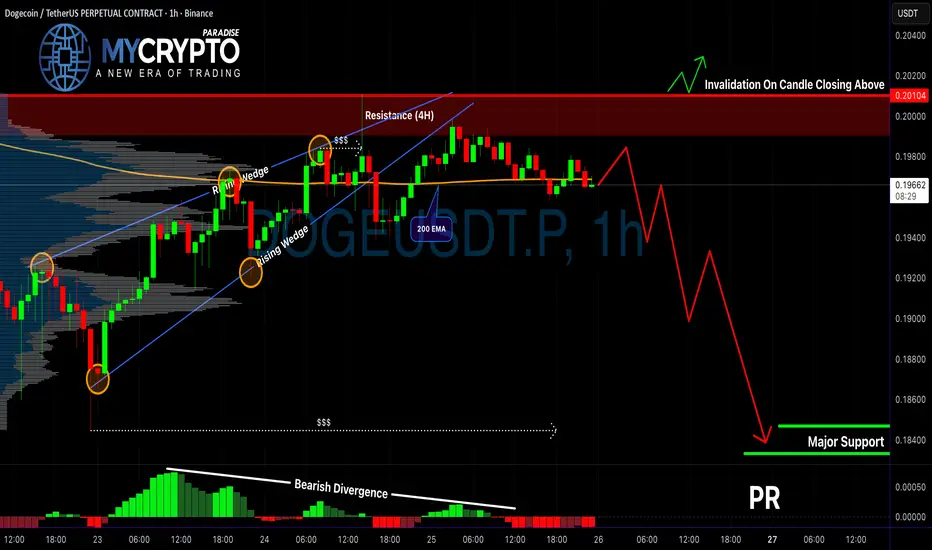
DOGE Is Setting Up for a Trap?Yello Paradisers, are you thinking of shorting DOGE right now? Be careful—this setup might look obvious, but it could also be the start of a classic trap. Let’s dig into what the charts are really telling us.
💎DOGEUSDT is currently reacting from a strong 4H resistance zone, which already gives us an early warning of potential rejection. Zooming into the 1H timeframe, price has broken down Rising wedge with bearish divergence. This isn’t just a random move; it's supported by confluence, especially with the 200 EMA acting as dynamic resistance on the 1H. That kind of layered rejection significantly increases the probability of a further bearish continuation.
💎For aggressive traders, there’s a potential to enter at the current price, but that comes with higher risk. For those who prefer a safer approach, the better play is to wait for a proper pullback and retest of the resistance zone. If the price returns to that level and forms a bearish candlestick pattern, it could provide a much cleaner and higher-probability short setup—along with a bigger reward-to-risk ratio.
💎However, if DOGE breaks out and closes a candle above the resistance zone, this would invalidate the entire bearish scenario. In that case, we’ll need to stay patient and wait for more reliable price action before making any decisions.
🎖Strive for consistency, not quick profits. Treat the market as a businessman, not as a gambler.
MyCryptoParadise
iFeel the success🌴