OSTK


$OSTK in a higher degree Correction completing Wave A of C
Given that Wave A & C are usually equidistance a 50% correction would be the midpoint at 42.84. At this point it is unknown whether Wave A of C is complete.
Disclaimer: I have been trading in the markets for about a year. After several months of charting various instruments, my eyes have gotten trained to recognize different candle formation patterns like Bear & Bull Flags, Head & Shoulders, and others. This was good. But, not enough for me to accurately forecast the next following moves and market structure after these patterns had been completed.
For me my next evolution as a Trader came with a more fine-tuned approach to Market Structure, The Elliott Wave Theory. There are two books that were recommended to me as I started this journey.
1. Elliott Wave Principle: Key to Market Behavior by Robert Prechter and A. J. Frost, www.elliottwave.com
2. Visual Guide to Elliott Wave Trading by Wayne Gorman and Jeffrey Kennedy, www.elliottwave.com
I am still learning. I accept the fact that my analysis may be wrong. But, these are my charts as I continue my journey. I am open to all feedback on my analysis as I continue to improve.

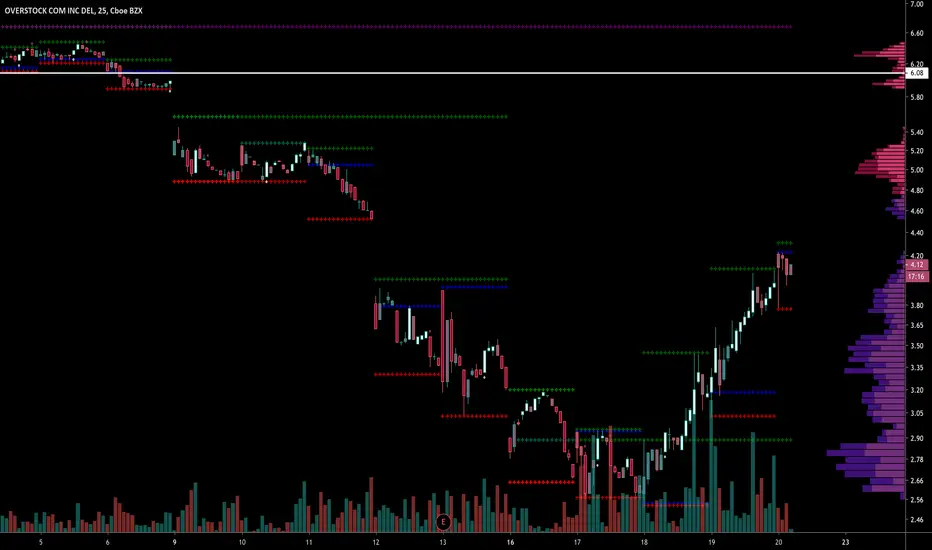
$OSTK - Strong waves up, weak(er) waves down.$OSTK - Strong waves up (GREEN), weak(er) waves down (YELLOW). Represents solid buying with (expected) intermittent profit taking on the way up. "Angle of Ascent" on this latest Wave is pretty steep again, much like it was in Wave 3. Momentum indicators remain strong even during the times of retracements in the overall trend. 50MA still angling solidly up. Always trade in the dominant direction of the market! Follow @MarketTrendAdv on Twitter for additional trend trading ideas. Starting to now post to TradingView also. Feel free backcheck previous Twitter calls dating back to the beginning of 2020. Best of Luck in your trading...
twitter.com

$OSTK Holding $20 Support$OSTK Holding $20 Support - Playing for a near term bounce.
Target - $25.00

OSTK LongOSTK Long, since this is a speculative stock I expect huge returns, "investors" confidence has returned in conjunction with the short term move to the downside make this a great opportunity to go long.

Overstock broadening wedgeNASDAQ:OSTK broadening wedge forming. I think it will go up eventually.
Related names: OTC:OSTKO COINBASE:BTCUSD KRAKEN:XTZUSD NASDAQ:EBIZ AMEX:ONLN NYSE:W

Overstok $OSTK in uptrendIt is following very smooth uptrend line so far and hit the fib 0.618 level. Pulled back to 20SMA zone and expect to move and break out.
If you find my charts useful, please leave me "like"
thx

OSTK Bull Run ContinuationBTC pumping, market pumping, Wayfair pumping, tech pumping.... this move is obvious.


Massive Inverse Head & Shoulders.It appears as though Overstock has formed a nice rounding bottom, which is now turning into a Cup & Handle potentially..
There's a few bullish indicators & even more so there's Macro events taking place with blockchain in China that are likely going to take this stock to new All Time Highs.
tZERO said Hong Kong-based private equity firm GoldenSand Capital (formerly known as GSR Capital) has bought a 5 Million stake in the company. I wouldn't be surprised If Chinese investors are supporting this stock heavily now, especially since China is rolling out their new digital currency.
McDonald’s and Starbucks are reportedly part of China’s digital currency trial.
China has rolled out a digital currency trial in Xiong’an, an area southwest of Beijing in the Hebei province, according to state-backed media reports.
McDonald’s, Starbucks, and Subway are the only three American firms among 19 companies participating in the trial.
The People’s Bank of China (PBOC) has been working on a digital yuan for the past few years but has made clear that it has not yet officially launched.
McDonald’s and Starbucks are among a handful of companies taking part in a new pilot program for China’s upcoming digital yuan, according to state-backed media, as the world’s second-largest economy pushes forward with its plans for an electronic currency.
This is the main reason why China propaganda has become dangerously provocative in America.
China is rolling out a cryptocurrency, a lot of the details have not been divulged.
I can tell you the cryptocurrency China’s rolling out will likely be backed by gold. China’s got 20,000 tonnes of gold or more, add the fact they are dumping U.S debt & treasuries at an alarming rate, it's plausible they'll bring back a gold standard for the new century.


Is OSTK trading in a Ascending Triangle?It appears as though $OSTK is holding support above the 200 Day MA & potentially trading in a Ascending Triangle.
The trendlines of a triangle need to run along at least two swing highs and two swing lows.
Ascending triangles are considered a continuation pattern, as the price will typically breakout of the triangle in the price direction prevailing before the triangle. Although, this won't always occur. A breakout in any direction is noteworthy.
A long trade is taken if the price breaks above the top of the pattern.
A short trade is taken if the price breaks below the lower trendline.
A stop loss is typically placed just outside the pattern on the opposite side from the breakout.
A profit target is calculated by taking the height of the triangle, at its thickest point, and adding or subtracting that to/from the breakout point.

$OSTK setting up to double in price from the lows after reversalPeople got overly pessimistic on OSTK, taking it down to $6.60. Q4 should look a lot better judging by housing numbers and positive retail indicators.

OSTK enters buy zoneIf OSTK can hold the support at 9.50, we can expect a big profit.
Stop loss: 9.00
Target 1: 12.00
Target 2: 14.80
Target 3: 18.90

$OSTK div dates will soon start to drive priceUnusually $OSTK bottoming process commonly coincides with periods of lower volume.

OSTK Swing Trade IdeaWaited for OSTK to come back to the 9.4 - 10.4 range and with the strong reversal and MACD cross on the daily - historically this has been a strong indicator, at least as of recent.
Lots of concern still around this entire company and the day or day operations coupled with their vision / side investments but worth it for a small swing with the rest of the market being dragged down by political / international concerns. Tight SL set w/ entry at 10.4....
Trying to make some dry powder in a sea of red can be dangerous but past 48hrs has shown incredible strength, let's just hope it continues.
PT1: 14.5
PT2: 21.10
PT3: 26.79
Will trim as we move up or let the SL do its job. Trade wisely - GLTA

Still room to short OSTK - further downside until $9OSTK has been inundated with negative news since founder and former CEO Patrick Byrne stepped down in August. The stock has seen some intense volatility.
Shorting the stock has proven profitable recently. There is still time to be short, despite the heavy losses already sustained.
On September 16th, OSTK plunged through its 9-Day MA and has been in freefall ever since. There is nothing keeping it from falling further until long-term support at $9.00.

Great Potential 20%+ Return on OSTKOSTK has shown a horizontal trend over the past couple months and has reached a strong support at about 14.50. Great low risk buy opportunity for a potential 20%+ return.


OSTK OSTK’s innovation outlook is trending down based on a current score of 50 out of 99, outperforming sector average. Jobs growth over the past year has decreased and insiders sentiment is neutral. It is most exposed to Verizon Communications Inc. as its supplier. Over the past 4 quarters OSTK beat earnings estimates 1 time.
For more analysis and articles visit our website .

OSTK ZigZag Analysis LongExpected trend for OSTK should go to around $22.00 within 150 Days and to 13-14 in 70 Days
Following the ZigZag Pattern I've seen over the past few months.
Thanks For Reading
