The Hidden Skill Every Great Trader Masters; And It’s Not Chart!Most traders spend years perfecting chart patterns, indicators, and entries…
Yet only a handful ever master the real skill that separates professionals from the rest, the art of waiting.
📉 Anyone can draw support and resistance.
📈 But not everyone can wait for price to reach them.
The market rewards patience, not predictions.
It’s not about catching every move, it’s about being ready when your setup aligns perfectly.
That’s when you strike. That’s when probability works for you, not against you.
Think of trading like fishing 🎣:
You don’t chase the fish, you position your line where it’s most likely to bite, then you wait.
So next time you feel the urge to jump in early, remind yourself:
You’re not just a trader. You’re a waiter, paid in precision and patience.
📚 Key takeaway:
Great traders don’t predict, they prepare.
They let the market move first, then respond with clarity.
⚠️ Disclaimer: This is not financial advice. Always do your own research and manage risk properly.
All Strategies Are Good; If Managed Properly!
~Richard Nasr
Community ideas

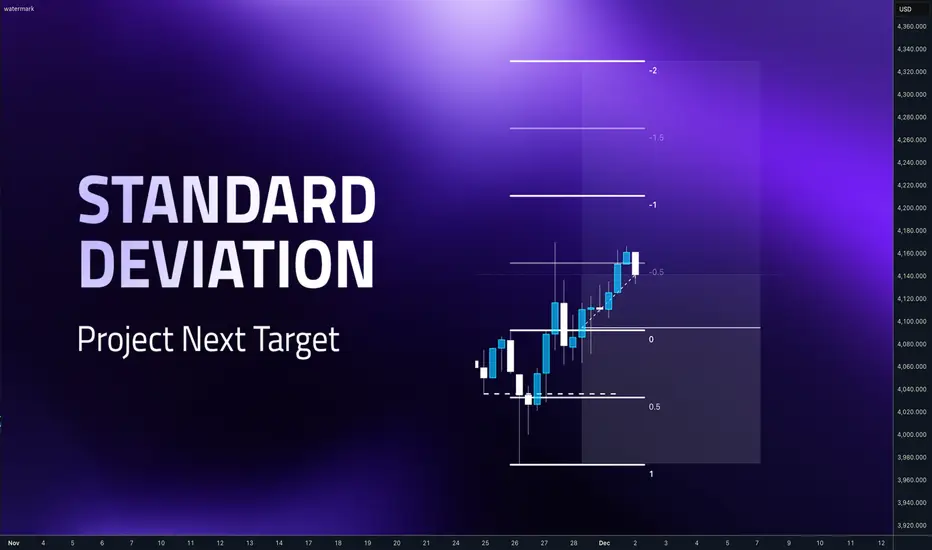
Standard Deviations - How to be exit before the pullbackHey whats up guys, in this post Ill show you easy method which can help you to set your targets, stay in the positions, prevent cutting position too early or hold for too long. You will basically have more objectives to stay in trade and give it a frame to which key levels you should use. Standard deviations are projection deviations of the manipulation leg. Which is the price swing that sweeps liquidity and then changes the order flow. In simple words, it is the move that takes out stops and then flips the structure - Order block.
📌 Fibonacci tool settings
We will be measuring deviations from the order block and here is the Fibonnaci settings
0 - 1 is where you measure the manipulation leg and then you got your projections.
Zone between 2 - 2.5 is my main focus for taking partials of full profits Price obviously can go further but between 2 - 2.5 is where I tend to take something of the table. Because my longterm statistics says most of my trades has 2.3 RR. 📌 What to do at 2- 2.5
Obviously don't start doing what Im saying here on your next trade. First test it and if you find it useful, never put any idea from someone from the internet to your money without verifying by yourself then add it to your arsenal or reject it. If your strategy has fixed TP based on structure stick with it. Standard deviations can be just a little helper. Let's look at few examples.
1️⃣ Example: GBPUSD
This is the example which has Benn posted here on TV And as you can see it has made some gain, didn't hit full TP and reversed, back to the entry. But look where it reversed - Exactly at the 2 - 2.5 I saw it has my average profit and it was Friday so I closed it . as we can see it was a good decision to close position fully here and not sticking to to the full target. Im not saying that closing trader before the initial target is good decision, but considering that its Friday and I got my average 2.3 gains. Its a no brainer to take what the market offers to me. 2️⃣ Example: EURUSD
My strategy is has two defined targets. 50% of the range and full range. After taking 50% partial at 50% I should be targeting opposing range low after the sweep of the liquidity highs. So I should hold the trade until the target. But as it was a Friday and price been between 2 - 2.5 means my trade was around 2.3 RR in profit, which is my average reward so I decided to close it completely and as we can see it was a good decision as the price just completely reversed before hitting my target. 3️⃣ Example: XAUUSD
This is model 2 entry on Weekly range and Model 1 on Daily CLS range. Let's not overcomplicate. Look at the order block our initial point for the measuring our target and check where is the 2 Std. Projecting 2 St.D gave me confidence that CLS highs could be reached easily as it all was aligned with HTF trend so I held the trade for the whole week. Exited little bit bellow, but as it was reaction on LTF OB and Friday, I didnt want to hold in the trade over the weekend. 4️⃣ Example :EURUSD
Another EURUSD trade example after sweeping a low and creating order block We can that 2 STD aligns with CLS highs so its perfect target and we can see sharp expansion to the 2 St. D then price started retracing and consolidating, If we targeting bigger targets we would be for 2 days in this choppy range now. 📌This tool is not a strategy it self its just something what can help us to set reasonable targets while we don't have to face big pullbacks. Im not saying you should go only for 2.3 RR as I do. If you can hold traders for 3RR and more you are great trader.
📌However I found that when Im targeting 3R and more, I must face pullback and watch how my gains go back to the markets which I dont like. Im still human and have emotions and you know how it feels when you have a great trade developing and then in a blink of the eye its back on your entry.
📌Also by targeting just 2.3 RR is a clean shot and I realized that I can increase my risk per trade for such setups because they are hitting TP more often than 3RR trades. So in the end it's less stress and better profits. But it's all about a personal preferences.
Let me know what is your average RR and reason you targeting it.
David Perk aka Dave Fx Hunter
Working hard yet poor while Others get wealthy, answer is DCAEver wondered why you work so hard yet your wealth doesn’t grow
How some people with the exact same income quietly multiply their assets
The answer is a simple calm strategy that whales follow It is called DCA
Hello✌️
Spend 3 minutes ⏰ reading this educational material.
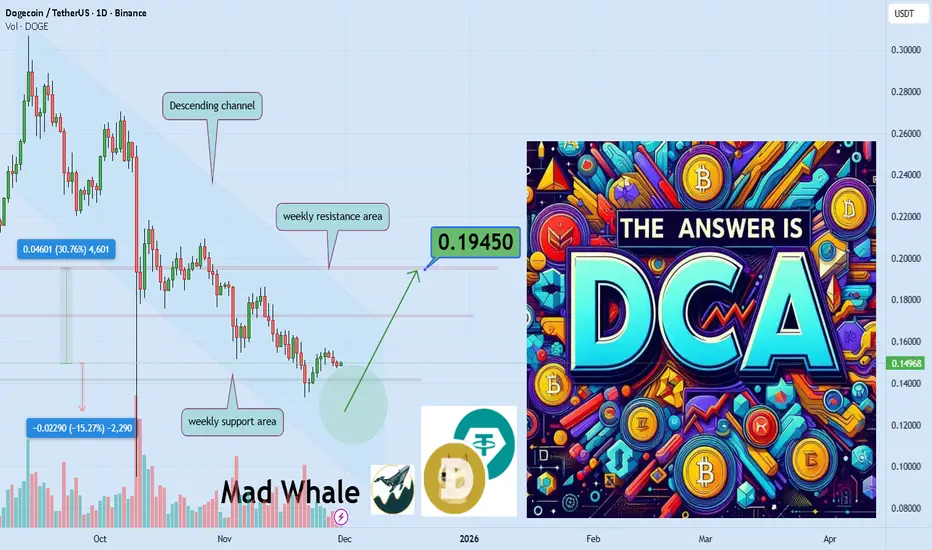
🎯 Analytical Insight on doge:
I expect a much bigger rise for Ripple than what I have shown on the chart. But we should remember that every year when the New Year approaches the market usually goes bearish. We need to wait and pass through that period to see what the final result will be.
Now , let's dive into the educational section,
The problem isn’t the market it is our behavior 🧠
Many wait for the perfect entry and never enter at all
Others rush to buy the top then panic sell the bottom
This behavior kills wealth and wastes precious time
The market never rewards emotional chaos
DCA means order inside crypto chaos ⏳
Crypto volatility punishes the impatient every single time
Buying periodically stops emotional decision making
If price drops you accumulate cheaper
If price rises your position grows stronger
Why whales never act like retail traders 🐳
Whales never throw all capital at once into the market
They use every dip as a quiet accumulation opportunity
DCA is simply whale strategy in a smaller scale
Slow silent and incredibly powerful
Greed is the hidden enemy of retail 🔥
Our mind always asks for fast and huge profits
But real profits go only to the patient ones
DCA isn’t greedy but builds true wealth
Each small buy is one step toward financial freedom
When everyone is hopeless you own the future ⚡
In bear markets emotional traders give up
But DCA traders become the future winners
The market rewards those who continue
Not those who stop because of fear
Your DCA plan must stay simple 📝
Define a monthly amount that never hurts your life
Choose a fixed time so it becomes a habit
Pick strong and credible long term assets only
Most important never break discipline for news or hype
summary 🎯
If you work hard but wealth doesn’t grow
The problem is not effort the problem is no system
TradingView features that make DCA smarter 📈
Price alerts so the market never surprises your entries
Moving averages to confirm trend before new allocation
Support zones marked with horizontal levels for optimal steps
Volume indicator to detect where big money is building positions
Percent labels to track the efficiency of every DCA buy
A clean focused watchlist to keep best assets always visible
survival tips for crypto investors 🔑
Never sacrifice long term patience for short term excitement
Volatility copies your mindset stay balanced and volatility works for you
True wealth goes to those who continue even during deep red days
✨ Need a little love!
We pour love into every post your support keeps us inspired! 💛 Don’t be shy, we’d love to hear from you on comments. Big thanks , Mad Whale 🐋
📜Please make sure to do your own research before investing, and review the disclaimer provided at the end of each post.
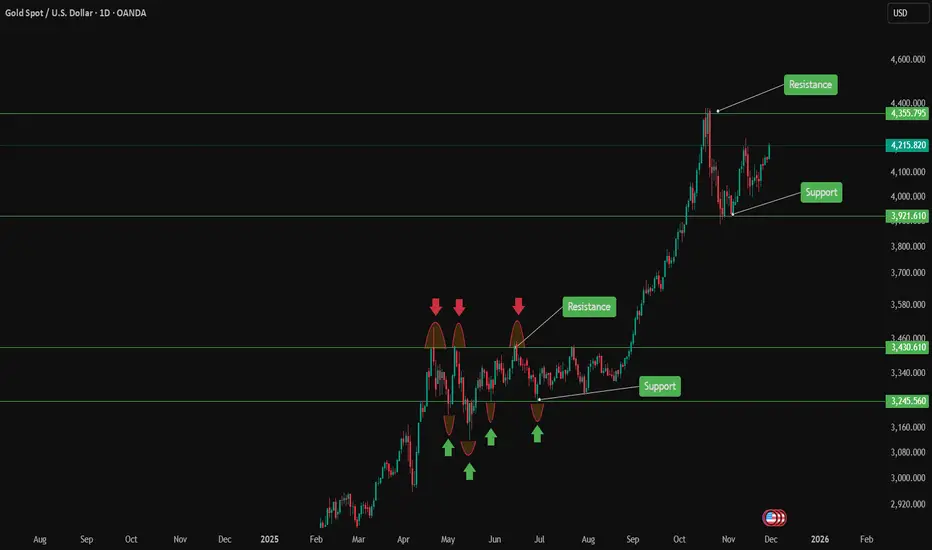
Unlock Hidden Trading Edges: Master Support & Resistance Levels Master Support & Resistance Levels – The Most Powerful Tool in Technical Analysis 📈🔥
Support and Resistance (S&R) are the foundation of price action.
Support = where price tends to stop falling (buyers step in) 🛡️
Resistance = where price tends to stop rising (sellers take control) ⚔️
These levels are not always exact, but when used correctly they give you high-probability entries and exits in Forex, Crypto, and Stocks.
How to Find Strong S&R Levels:
1-Look left → Previous swing highs & lows
The more times price has touched and bounced, the stronger the level becomes.
2-Round numbers & psychological levels
Examples: $50,000 BTC, 1.2000 EUR/USD, $200 AAPL – traders love these!
3-Use TradingView tools
Horizontal Line
Fibonacci Retracement (38.2%, 50%, 61.8%)
Volume Profile (High-volume nodes often act as S&R)
2Role Reversal – The Magic Trick ✨
Broken resistance → becomes new support
Broken support → becomes new resistance
This is where the big moves start!
Real Examples Right Now:
Bitcoin → $100,000 break support → now strong resistance
Pro Tips:
Always check multiple timeframes (Daily + 4H give the strongest levels)
Combine with RSI or volume for confirmation
Place stop-loss just below support / above resistance
When a level breaks with high volume → jump on the breakout!
Start drawing your S&R levels today and watch your win rate improve instantly.
Which market are you trading right now? Drop your favorite S&R level in the comments! 👇
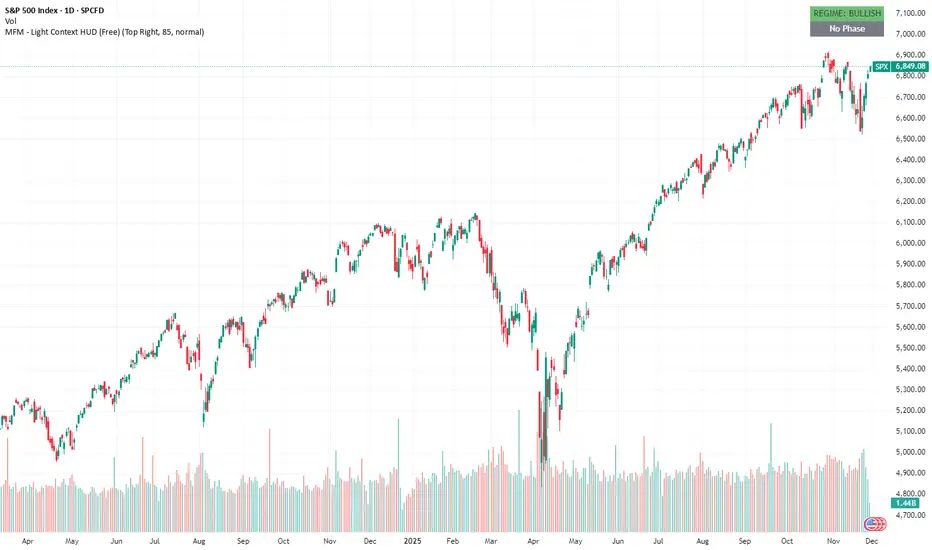
SPX – MFM Light HUD (Free) shows a clean bullish regimeThis post is an educational example of how to interpret the free MFM Light Context HUD. It does not provide trading signals or directional predictions.
The MFM – Light Context HUD (Minimal) gives a simple view of the structural state of the market. On SPX the model shows a clear bullish regime on the weekly momentum ratio. This does not predict direction. It only shows whether the underlying environment is supportive or restrictive.
The phase is currently neutral. That means SPX is not in a volatile phase, not in a compression field, and not in a drift phase. When no phase is active, price tends to behave without strong internal pressure. It is simply the absence of structural imbalance.
What the phases mean
These phases describe structure, not trade signals.
Volatile (Phase 1): fast movement and unstable conditions.
Compression (Phase 2): contracting conditions with slowing momentum.
Drift (Phase 3): more controlled and persistent movement.
Neutral: no clear structural condition.
This is why the HUD is useful. It removes noise and gives a clean top level reading.
You can still use your own strategy or analysis. The HUD just tells you what kind of environment you are operating in.
What you see in this chart
Weekly regime is bullish
No active phase
No signals or forecasts
Only structural context
Why this matters
In strong bullish regimes markets often react differently to pullbacks, volatility spikes or news events. Context does not replace analysis. It frames it.
Disclaimer
The Market Framework Model (MFM) and this indicator are for educational and informational purposes only. Nothing in this script, its visuals, or any documentation should be interpreted as financial advice or as a recommendation to buy or sell any asset.
All examples and historical references are illustrative only and do not imply future results. Trading and investing involve risk, including the potential loss of capital. Users remain fully responsible for their own decisions.
No guarantees are made regarding accuracy, completeness, or reliability. MFM describes structural market context only and should not be used as the sole basis for trading actions.
© 2025 Inratios. Market Framework Model (MFM) is protected via i-Depot (BOIP) – Ref. 155670.
Internal vs External Liquidity: The Skill Nobody Actually MasterMost traders think they understand liquidity…
They mark equal highs, equal lows, and call it a day.
But let me tell you something real:
Knowing liquidity exists is NOT the skill.
Knowing WHICH liquidity matters right now is the real edge.
That’s the difference between:
✔ catching continuations
✔ catching reversals
✔ avoiding trap entries
✔ timing precision entries
✔ and actually staying in profitable moves
Most traders lose because they don’t understand the hierarchy of liquidity.
Let me break this down the way nobody online does:
⸻
🔥 1. Internal Liquidity = Fuel for Continuation
This is the liquidity inside the active range.
It sits between swing points, inside consolidation, above minor highs, below short-term lows.
Internal liquidity gets taken when:
• Market is in trend
• Price is compressing
• Price is building inducement
• Algorithms are collecting “fuel” before delivery
When internal gets swept, DO NOT expect a reversal.
Expect a continuation into the next external pool.
This is why most traders get faked out:
They see a sweep and scream “reversal!”
But they’re reacting to internal liquidity — not the real turning point.
⸻
🔥🔥 2. External Liquidity = The Real Reversal Zones
External liquidity sits at the RANGE BOUNDARIES:
• The major swing high
• The major swing low
• The extreme points of the structure
These are the levels that actually SHIFT trend, cause deep pullbacks, or start major legs.
This is where smart money:
✔ Clears the crowd
✔ Triggers stops
✔ Closes positions
✔ Repositions
✔ Begins delivery in the opposite direction
External liquidity is the turning point.
Internal liquidity is just the build-up.
If you can’t distinguish the two, every reversal will feel random to you.
⸻
🔥🔥🔥 3. Here’s the Rule Nobody Teaches:
If price sweeps internal → expect continuation.
If price sweeps external → expect correction or reversal.
But here’s where MOST traders fail:
They don’t know which one they’re looking at.
If you think a reversal is starting but you’re still inside the range…
You’re not trading a reversal.
You’re trading hopium.
⸻
🔥🔥🔥🔥 4. How Smart Money Chooses Which Liquidity to Target First
This is where your real edge comes in.
Smart money asks ONE question:
“Which pool unlocks the next delivery path?”
If the next objective is above → they’ll sweep internal lows to build power.
If the next objective is below → they’ll sweep internal highs to induce buyers.
Smart money is always targeting what unlocks:
✨ the cleanest path
✨ the imbalanced leg
✨ the untouched zone
✨ the unmitigated order block
✨ the next HTF objective
You think the sweep is the entry.
They see the sweep as the setup.
⸻
🔥🔥🔥🔥🔥 5. Here’s the TRUTH:
Internal liquidity fuels the move.
External liquidity flips the move.
If you master this one skill, your whole trading shifts.
Your confidence shifts.
Your timing shifts.
Your strike rate shifts.
You stop chasing noise.
You stop guessing bottoms.
You stop guessing tops.
You start reading intention — not reacting to candles.
Most of the trading world knows liquidity.
Almost nobody knows when liquidity actually matters.
That’s the part the textbooks don’t teach.
That’s the part the YouTubers don’t show.
That’s why most traders stay confused for years.
Internal liquidity gets you in —
External liquidity gets you paid.
Master the difference and you’ll trade with precision most people only dream of.

Forex Trading Secrets1. Price Action Is the Real King (Not Indicators)
Most beginners clutter their charts with dozens of indicators hoping to find a perfect buy–sell formula. Professionals know the truth: price itself gives the most reliable information. Indicators lag because they represent past price data, not current market intent.
What professionals focus on:
Support and resistance zones
Market structure (higher highs, lower lows)
Liquidity levels (areas where stop-loss clusters exist)
Candlestick strength (rejection wicks, engulfing candles)
When a trader learns to read price action—how candles react to zones, how momentum builds or fades—they can trade profitably even with a clean chart. Indicators become secondary confirmation tools, not primary decision drivers.
2. Liquidity Is What Moves the Market
Here’s a hidden truth: forex markets move to fill liquidity, not because of random price swings. Big players like banks and institutional traders execute massive orders, and they need liquidity to fill those orders efficiently. That means:
Price hunts stop-loss clusters
Price sweeps highs and lows before reversing
Spikes occur to capture pending orders
This is why you often get stopped out right before the market moves in your favor. Understanding liquidity behavior gives traders a powerful edge.
Liquidity concepts include:
Stop hunts
Fake breakouts
Order block zones
Liquidity grabs
Smart traders expect these moves and position themselves accordingly.
3. The Trend Is Stronger Than Your Analysis
One of the biggest secrets is deceptively simple: Trading with the trend dramatically increases win probability. Many traders try to catch tops and bottoms, but institutional players rarely fight the trend—they ride it.
Characteristics of trend-following success:
Higher time-frame confirmation
Entering on pullbacks, not chasing
Using simple trend continuation patterns
Keeping trades open longer during strong trends
The trend holds more weight than any indicator or news event. Fighting the trend is one of the fastest ways to blow up an account.
4. Risk Management Is the Most Guarded Secret
Ask any long-term successful trader their biggest edge, and the answer won’t be a strategy—it will be risk management.
Key risk management secrets:
Never risk more than 1–2% per trade
Position sizing is more important than entries
A trader with moderate accuracy and strong risk rules often outperforms a trader with high accuracy but poor risk control
Understanding when not to trade is also a powerful risk strategy. Not trading low-quality setups protects your capital and mental energy.
5. Trading Psychology Outweighs Strategy
This is the hardest secret for beginners to accept: Your mindset determines your results more than your system.
The psychological traits professionals share:
Patience to wait for ideal setups
Discipline to follow rules consistently
Neutrality—no emotional attachment to wins or losses
Resilience after a losing streak
Confidence built on data, not hope
A trader can have the world’s best strategy, but fear, greed, revenge trading, and impulsiveness will destroy the account. This is why psychology books are more valuable than indicator tutorials.
6. Higher Time Frames Reduce Noise and Increase Accuracy
A hidden secret among consistently profitable traders is that they rely heavily on higher time frames like the daily or 4-hour.
Why higher time frames work:
Clearer market structure
Stronger trend visibility
Fewer false signals
Trades require less screen monitoring
Better risk-to-reward setups
Scalping looks attractive, but it magnifies emotions and often leads to over-trading. Higher time-frame trading reduces mental stress and increases consistency.
7. Fundamental Catalysts Drive Major Moves
Forex is deeply influenced by macroeconomic factors. Professionals use fundamentals to understand why the market is trending and where major volatility will occur.
Major catalysts include:
Central bank interest rate decisions
Inflation data (CPI, PCE)
Employment data (NFP, unemployment rates)
GDP figures
Geopolitical events
Fiscal policies
Ignoring fundamentals means ignoring the very forces that create trends.
But the secret is: You don’t need to be an economist—just know when news is happening and how it affects risk.
8. Smart Money Concept (SMC) Edge
Institutional-style concepts, once hidden from retail traders, are now increasingly discussed. These include:
Order blocks
Fair value gaps (FVG)
Market structure shifts (MSS)
Imbalance zones
Buy-side and sell-side liquidity
These concepts explain how institutions accumulate and distribute positions. Traders who master SMC often experience a major breakthrough in accuracy.
9. Consistency Beats Intensity
This secret is rarely acknowledged.
Successful traders:
Follow a structured routine
Practice the same strategy repeatedly
Keep a trading journal
Backtest regularly
Set trading sessions and stick to them
Failure in forex often comes from randomness—random indicators, random entries, random time frames. Success comes from consistency, not constant experimentation.
10. Forex Is a Business, Not Gambling
Treating forex like a business means:
Maintaining a trading plan
Logging trades
Tracking performance metrics
Identifying weak areas
Improving process instead of chasing profits
Traders who approach forex like gambling lose money. Traders who approach it like a business grow gradually and sustainably.
Conclusion: The “Secrets” Are Not Hidden—They Are Underrated
The real secrets of forex trading are not magic formulas or mysterious tools. They are principles that professionals use every day but beginners often overlook in search of shortcuts.
To summarize:
Price action matters most
Liquidity drives the market
Trend-following improves probability
Risk management is the true edge
Psychology determines consistency
Higher time frames simplify trading
Fundamentals guide long-term trends
SMC offers an advanced structural view
Consistency builds mastery
Treating trading as a business ensures longevity
Mastering these secrets takes time, discipline, and patience. But once internalized, they form the foundation of sustainable forex success.
The Global Trade Market Superpower1. What Defines a Global Trade Superpower?
A global trade superpower is a country (or group such as the EU) that:
✔ Dominates global exports and imports
The ability to supply goods at scale—manufactured, agricultural, technological—creates massive global impact.
✔ Controls key global supply chains
Superpowers are deeply embedded in or outright control production lines, energy routes, shipping, logistics, and commodity flows.
✔ Influences global financial systems
Trade superpowers usually have strong currencies, major stock exchanges, and banking systems that shape global capital movement.
✔ Sets global standards and rules
From trade agreements to environmental norms, superpowers shape what the world must follow.
✔ Maintains military and diplomatic dominance
Economic power is supported by defense capabilities, alliances, and diplomatic networks that protect trade interests.
Countries like the United States, China, and the European Union are prime examples of trade superpowers, while emerging economies like India, South Korea, and ASEAN nations are rapidly rising.
2. Historical Evolution of Trade Superpowers
a. Age of Exploration (1500–1800)
European powers—Portugal, Spain, Netherlands, France, and Britain—dominated global trade through:
Maritime exploration
Colonization
Monopoly control over spices, textiles, gold, and silver
This era established the foundations of global shipping routes and international markets.
b. Industrial Revolution (1800–1950)
Britain was the first global trade superpower driven by:
Mechanized manufacturing
Steamships and railways
Massive colonial markets
Later, the United States and Germany joined as industrial giants.
c. Post–World War II Era (1950–2000)
The United States emerged as the world’s leading trade superpower due to:
Dollar becoming the global reserve currency
Strong manufacturing and innovation
Control over global institutions like IMF and World Bank
Japan and Europe also became major export-driven economies.
d. Rise of China (2000–Present)
China transformed into the “Factory of the World” by:
Massive low-cost manufacturing
Export-oriented economic strategy
Investment in ports, shipping, and global infrastructure
China now rivals the United States in global trade influence.
3. Key Elements That Build a Trade Superpower
1. Industrial Capacity
Large production capability allows superpowers to dominate global markets.
China: electronics, machinery, textiles
United States: high-tech, aerospace, pharmaceuticals
EU: luxury goods, machinery, chemicals
Countries without strong industrial bases cannot gain global influence.
2. Control of Supply Chains
From microchips to crude oil, controlling supply chains decides global power.
Trade superpowers invest heavily in:
Ports and logistics
Manufacturing hubs
Rare earth minerals
Energy pipelines
Shipping fleets
For example, China’s Belt and Road Initiative strengthens its global supply chain control.
3. Strong Currency and Financial Power
A trade superpower’s currency becomes widely used in international transactions.
USD dominates global trade payments.
Euro is second in trade invoicing.
China’s yuan is expanding rapidly through global trade partnerships.
Financial power also helps these nations dictate global economic rules.
4. Technology and Innovation
Trade superpowers lead in:
Artificial intelligence
Semiconductors
Aerospace
Biotechnology
Green energy
Technology ensures long-term global competitiveness.
5. Strategic Trade Agreements
A superpower uses diplomacy to secure favorable trade networks:
Free trade agreements
Regional partnerships
Security alliances
Maritime control
The US-led alliances and China’s RCEP advantage demonstrate how diplomacy supports trade dominance.
4. Current Global Trade Superpowers
1. China
China is now the world’s largest exporter and a major importer of technology, energy, and food. Its strengths include:
Manufacturing scale unmatched globally
Strong logistics network
Belt and Road infrastructure
Dominance in rare earth minerals
Increasing influence in Asia, Africa, and Europe
China’s growth has reshaped global supply chains.
2. United States
The US remains a powerful trade superpower due to:
Dollar dominance
Technological leadership (Apple, Microsoft, Tesla, Boeing)
Agricultural exports
Strong domestic demand
Global financial and defense alliances
Even without being the largest exporter, its innovation and capital markets give it unmatched global leverage.
3. European Union
As a combined economy, the EU is a trade powerhouse:
World’s largest trading bloc
Major exporter of machinery, automobiles, pharmaceuticals
Highly regulated market influencing global standards
EU’s strength lies in quality manufacturing and a unified market.
4. Rising Powers
Countries like India, Japan, South Korea, Brazil, and ASEAN nations are gaining influence through:
Tech innovation
Young workforce
Regional trade agreements
Strategic resource control
India, for example, is becoming a major global service exporter and manufacturing hub.
5. How Trade Superpowers Influence Global Markets
a. Price Setting Power
Superpowers influence global prices of:
Oil and gas
Metals
Electronics
Food commodities
Their policies can cause global price shifts.
b. Sanctions and Trade Restrictions
Trade superpowers can impose sanctions that affect entire industries or nations.
Examples:
US sanctions disrupting global semiconductor trade
EU carbon tariffs influencing manufacturing norms
China’s export controls on rare earth elements
c. Shipping and Logistics Control
Major superpowers operate:
Key global ports
World’s largest shipping fleets
Global air cargo networks
This ensures they can move goods faster and cheaper than others.
d. Standard-Setting Power
From food safety to digital privacy, superpowers write rules the world must follow.
6. Future of Global Trade Power: Who Leads Next?
The global trade landscape is changing rapidly:
China is strong, but faces challenges like geopolitical tensions and shrinking demographics.
The United States remains influential, particularly in technology and finance.
India is the fastest-rising contender, driven by:
Rapid economic growth
Large workforce
Expanding manufacturing
Strong technology sector
India could become the next major trade superpower by 2035.
Regional blocs like ASEAN and Africa are also emerging as significant players.
Conclusion
A global trade superpower is not defined by exports alone, but by the ability to shape global markets, rules, supply chains, technology, and finance. Today, China, the United States, and the European Union dominate the trade landscape, while emerging economies like India are rapidly rising.
Global trade superpowers determine the flow of goods, capital, technology, and influence—ultimately shaping the direction of the world economy.

Startups Reshaping the Global Market1. Innovation as the Core Driver of Market Transformation
Startups thrive on innovation—not just in products, but in processes, platforms, and business models. Traditional firms often struggle with legacy systems, bureaucratic decision-making, and risk aversion. Startups, however, operate with flexibility and a problem-solving mindset, enabling them to test new ideas quickly.
Examples of Startup-Led Innovations
FinTech companies introduced digital banking, mobile wallets, micro-lending, and crypto-based financial services.
HealthTech startups pioneered telemedicine, AI diagnostics, and wearable health monitoring.
CleanTech innovators built new pathways for sustainable energy, including solar SaaS models and electric mobility.
AgriTech startups are transforming farming with precision agriculture, drone monitoring, and smart irrigation.
By challenging traditional norms, startups create entirely new markets and redefine customer expectations.
2. Digital Transformation and the Acceleration of Automation
Startups have significantly accelerated global digital transformation. They adopt technologies like AI, machine learning, blockchain, IoT, cloud computing, robotics, and automation as foundational elements of their products and services.
Key Impacts
AI-driven startups are powering forecasting, personalization, fraud detection, and workflow automation across industries.
IoT startups are reshaping manufacturing, logistics, and smart cities by enabling real-time data flow and predictive maintenance.
Blockchain startups introduced decentralization in finance, supply chain tracking, and digital identity.
The rapid adoption of digital tools by startups forced larger companies to modernize at unprecedented speed. Today, many enterprises partner with or acquire startups to remain competitive.
3. Disruption of Traditional Industries
Startups often succeed by simplifying complex, expensive, or inefficient processes within existing industries. They disrupt markets by offering:
Lower costs
Better customer experience
Faster delivery
Unique value propositions
Personalized solutions
Industry Disruptions
Transportation: Ride-hailing and mobility startups like Uber, Ola, Grab shaped the future of mobility.
Hospitality: Airbnb redefined accommodation by turning homes into global travel assets.
Retail: E-commerce startups forced traditional retail to shift online.
Media and Entertainment: Streaming startups revolutionized how people consume content.
Education: EdTech platforms made learning accessible to anyone, anywhere.
These disruptions create ripple effects, compelling traditional players to adapt or risk extinction.
4. Democratizing Access to Products and Services
Startups often focus on removing barriers—whether financial, geographical, or technological. Their solutions frequently make services accessible to people who previously could not reach them.
Examples
FinTech startups provide digital loans to small businesses lacking access to traditional banking.
EdTech platforms bring high-quality education to rural areas.
HealthTech solutions enable remote diagnostics for patients in underserved regions.
E-commerce startups allow small merchants to sell nationwide.
This democratization gradually levels the playing field and broadens economic participation.
5. Globalization and Cross-Border Expansion
Startups scale quickly due to digital infrastructure, venture capital funding, and cross-border partnerships. Cloud technology and digital marketing allow them to reach global audiences with minimal physical presence.
Global Expansion Strategies
Launching digital-first products
Partnering with global distributors
Leveraging borderless payment gateways
Operating through remote teams
Using international venture ecosystems
China, India, the US, Southeast Asia, and Europe have emerged as startup hotspots, each contributing to the global innovation landscape. Today, a startup founded in Bangalore or Singapore can compete directly with players in Silicon Valley or London.
6. Redefining Work Dynamics and the Future of Employment
Startups have also reshaped the global labor market. Their work culture emphasizes:
Flexibility
Remote work capabilities
Decentralized teams
Innovation-centric roles
Project-based employment
They push the boundaries of traditional corporate structures, preferring flat hierarchies and collaborative environments.
Impact on the Global Workforce
The rise of freelancing and gig economy platforms.
Increased demand for digital skills—coding, analytics, design, marketing.
Hybrid work becoming a global norm.
New roles emerging in AI, Data Science, UX, and Sustainable Tech.
This shift changes how workers engage with employers and how companies attract global talent.
7. India, Southeast Asia, and Africa: Emerging Powerhouses
While Silicon Valley retains its influence, emerging markets are becoming innovation hubs. They offer young populations, rising internet penetration, and business-friendly policies.
India
Thriving FinTech, EdTech, and SaaS sectors
Large talent pool
Increasing unicorn count
Southeast Asia
Digital commerce boom
Mobility and logistics innovations
Rapid adoption of mobile-first solutions
Africa
FinTech revolutionizing financial inclusion
Startups solving local issues like energy and agriculture
These regions contribute to diversifying global innovation beyond traditional Western markets.
8. Venture Capital and Funding Fuel Startup Growth
The global flow of venture capital has empowered startups to scale quickly. Investors provide not only capital but also mentorship, networks, and strategic guidance.
Funding Trends
Focus on AI, deep tech, sustainability, and biotech.
Rise of sovereign wealth funds investing in global startups.
Increase in corporate venture capital.
Growth of startup incubators and accelerators.
This financial ecosystem feeds global innovation and drives market evolution.
9. Sustainability and Impact-Driven Startups
With climate concerns and ESG policies gaining momentum, startups are building environmentally responsible solutions. Sustainability-focused ventures are transforming energy, mobility, packaging, food production, and recycling.
Areas of impact
Renewable energy
Electric mobility
Carbon capture
Biodegradable materials
Circular economy models
Impact startups are pushing both governments and corporations toward greener practices.
10. Challenges Startups Face in Redefining Global Markets
Despite their strengths, startups also encounter significant barriers:
Regulatory uncertainty
High failure rates
Scaling challenges
Funding shortages during downturns
Talent acquisition struggles
Competition from large established companies
However, their ability to adapt quickly helps many survive and flourish.
Conclusion
Startups are no longer just small experimental ventures—they are powerful forces reshaping the global market. By driving innovation, accelerating digital transformation, democratizing services, disrupting traditional industries, and fostering global competition, startups are setting new benchmarks for how businesses operate. Their influence extends across economies, technologies, and societal structures, making them central to the future of global commerce.
In the coming decade, startups will continue to redefine not just markets, but also how people work, collaborate, and consume. Their role in shaping a smarter, more inclusive, and more sustainable world will be one of the defining forces of the global economy.
G7 and G20 Roles in the World Market1. Understanding the G7: Composition and Purpose
1.1 Who Are the G7?
The G7 consists of the world’s most advanced economic democracies:
United States
United Kingdom
Germany
France
Italy
Canada
Japan
(Plus the European Union as a participant)
These nations collectively represent a significant portion of global GDP, technological innovation, financial markets, and political influence.
1.2 Core Purpose of the G7
Formed in the 1970s to address financial crises, the G7 serves as a policy coordination forum for major developed economies. It prioritizes:
Macroeconomic stability
Trade liberalization
Financial market regulation
Technology cooperation
Global security and democracy
Climate change and sustainability
The G7 does not have binding authority, but its decisions shape global market sentiment and policy directions.
2. G7 Roles and Impact on the World Market
2.1 Setting Global Economic Priorities
The G7 acts as a “steering committee” for global capitalism. Its members often set the tone for:
Interest rate expectations
Fiscal policy shifts
Global inflation strategies
Debt management frameworks
Statements from G7 meetings influence market behavior, investor confidence, and foreign exchange flows.
2.2 Leading Global Financial Stability
G7 nations dominate institutions such as:
IMF (International Monetary Fund)
World Bank
OECD
Through these institutions they guide:
Economic bailouts
Structural reforms
Monetary cooperation
Their collective stance is crucial during crises (e.g., 2008 financial crisis, COVID-19 recovery).
2.3 Shaping International Trade
The G7 is a major voice in defending free-market principles. It influences:
WTO policies
Global tariff standards
Supply chain resilience
Technology transfer regulations
Trade-related G7 declarations often impact commodity prices, currency movements, and trade routes.
2.4 Technology and Digital Governance Leadership
G7 countries lead in:
Artificial intelligence
Cybersecurity standards
Digital taxation rules
Their regulations affect global tech companies and cross-border e-commerce.
2.5 Geopolitical Influence on Markets
The G7 imposes sanctions, export bans, and trade restrictions that influence:
Oil and gas markets
Defense spending
Currency movements
Global investor flows
For example, sanctions on Russia shifted energy markets, trade routes, and commodity prices worldwide.
3. Understanding the G20: Composition and Purpose
3.1 Who Are the G20?
The G20 includes 19 countries plus the European Union:
Argentina
Australia
Brazil
Canada
China
France
Germany
India
Indonesia
Italy
Japan
Mexico
Russia
Saudi Arabia
South Africa
South Korea
Turkey
United Kingdom
United States
European Union
This group represents 80% of global GDP, 75% of global trade, and 60% of the world’s population.
3.2 Purpose of the G20
Formed in 1999 after the Asian Financial Crisis, the G20 brings together advanced and emerging economies to address:
Global economic governance
Financial market regulation
Sustainable development
Climate goals
Digital transformation
Trade and investment environment
It is a platform where both developed and developing economies have a voice.
4. G20 Roles and Impact on the World Market
4.1 Ensuring Global Economic Stability
The G20 acts as the primary global economic governance forum, especially during crises. It played a decisive role in:
Coordinating stimulus packages during the 2008 crisis
Managing COVID-19 economic recovery
Structuring global debt relief programs
Its policy coordination helps prevent global recessions and market collapses.
4.2 Strengthening Financial Market Regulations
The G20 instructs institutions like the Financial Stability Board (FSB) to:
Regulate big banks
Improve global accounting standards
Monitor crypto assets
Reduce shadow banking risks
These actions impact global stock markets, banking systems, and capital flows.
4.3 Facilitating Global Trade and Investment
The G20 influences:
WTO reforms
Lowering trade barriers
Cross-border investment rules
Infrastructure partnerships
Initiatives like the G20 Trade and Investment Working Group shape globalization trends.
4.4 Sustainable Economic Development
The G20 pushes global development goals in areas such as:
Renewable energy
Climate financing
Circular economy
Agriculture and food security
Digital inclusion
These priorities influence sectors like green energy, EV markets, and sustainable finance.
4.5 Voice for Emerging Economies
Countries like India, Brazil, Indonesia, and South Africa gain influence through the G20. It provides:
A platform for domestic issues
Opportunities for global partnerships
Access to international funding
Policy alignment with major economies
This fosters investment inflows and boosts regional economic growth.
5. Comparing the G7 and G20 in the World Market
Feature G7 G20
Members 7 developed nations 20 major economies (developed + emerging)
Share of Global GDP ~40% ~80%
Main Focus Policy leadership, geopolitical issues Economic governance, financial stability
Decision-making Political alignment Broader consensus
Influence on Markets Strong on finance, tech, sanctions Strong on trade, global growth, regulation
The G7 sets strategic direction, while the G20 ensures inclusive implementation.
6. How G7 and G20 Complement Each Other
G7 provides ideological leadership and rapid decision-making.
G20 provides global representation and practical solutions.
G7 initiatives often become G20-backed global policies.
Both together stabilize markets, trade flows, and global finance.
7. Conclusion
The G7 and G20 play distinct yet interconnected roles in shaping the world market. The G7 acts as a leadership forum for advanced economies, influencing global finance, technology, and geopolitical strategies. The G20 brings together developed and emerging markets, driving inclusive economic governance, sustainable development, and crisis management. Together, they provide direction, stability, and coordination across global markets, ensuring that the world economy remains resilient, interconnected, and forward-looking.

DXY Surges Explained1. What a DXY Surge Means
A surge in the DXY means the U.S. dollar is strengthening. This strengthening can come from:
Growing confidence in the U.S. economy
Rising U.S. interest rates
Investors seeking safety from global risks
Weakness in other major currencies
Changes in global trade flows
Shifts in central bank policies
When the DXY rises, it often signals that money around the world is flowing into the United States—either for safety, return on investment, or both.
2. Interest Rates: The Primary Driver of DXY Surges
The most influential factor behind a DXY surge is U.S. interest rates. The Federal Reserve has enormous influence on the dollar, as its decisions determine whether global investors find U.S. assets attractive.
Why Higher Rates Boost the Dollar
Higher rates increase the yield on U.S. Treasury bonds.
Investors around the world buy these bonds because they are considered safe and profitable.
To buy U.S. assets, investors must first convert their local currency to dollars.
This surge in demand strengthens the dollar and pushes the DXY upward.
Even expectations of future rate hikes can push the DXY higher. Traders often react not only to actual policy changes, but also to hints from the Federal Reserve.
3. Safe-Haven Demand During Uncertainty
The U.S. dollar is the world’s leading safe-haven asset. When global uncertainty rises—whether due to economic downturns, geopolitical tensions, war, or financial instability—investors flock to the dollar.
Examples of situations that cause safe-haven flows:
Global recessions
Banking crises
Declines in stock markets
Political instability in major economies
Currency crises in emerging markets
During such times, investors search for stability, and they often find it in U.S. Treasuries and other dollar-denominated assets. This buying pressure causes surges in the DXY.
4. Weakness in Other Currencies Helps Push the DXY Up
Because the DXY measures the dollar’s strength relative to other currencies, weakness in those currencies automatically pushes the index higher.
The Euro’s Role
The euro has the largest weight in the index—around 57%.
Therefore, when the euro weakens due to:
Slow European economic growth
Divergent interest rates
Political challenges
Energy crises
…the DXY often rises significantly.
The Japanese Yen Factor
The yen also plays a major role. When the Bank of Japan keeps interest rates low while the U.S. raises rates, investors shift funds into the dollar, causing the DXY to surge.
5. U.S. Economic Strength and Global Confidence
A strong U.S. economy typically results in a stronger dollar. Economic indicators that support a DXY surge include:
Higher GDP growth
Strong employment numbers
Rising consumer spending
Increasing business investment
Robust corporate earnings
These indicators attract global investors to U.S. assets such as stocks, bonds, and real estate. As foreign investors buy these assets, demand for dollars increases, pushing the DXY upward.
6. Global Trade and Dollar Demand
The U.S. dollar dominates international trade. Over 80% of global transactions, commodities, and trade settlements involve the dollar. This creates a structural, persistent demand for dollars.
Why global trade boosts the DXY:
Countries hold dollar reserves to pay for imports like oil, machinery, and technology.
Most global commodities—including gold, oil, and natural gas—are priced in dollars.
During periods of high commodity demand, nations often increase their dollar reserves.
All of this creates momentum for the DXY to strengthen when global trade dynamics shift.
7. Impact of DXY Surges on Global Markets
A. Impact on Commodities
When the dollar strengthens, commodities like oil, gold, silver, and metals generally become more expensive for buyers using other currencies. As a result, commodity prices often fall when the DXY surges.
B. Impact on Emerging Markets
DXY surges create challenges for emerging markets:
Their currencies weaken
Dollar-denominated debt becomes more expensive to repay
Foreign investment outflows increase
Import costs rise
Some nations experience financial stress during strong dollar periods.
C. Impact on U.S. Corporations
A stronger dollar can hurt U.S. exporters because their products become more expensive internationally. Companies such as technology firms, industrial manufacturers, and consumer goods exporters often feel the pressure of a rising DXY.
8. Market Psychology and Speculative Trading
Financial markets react not just to economic data, but also to sentiment and speculation. Traders in the forex market often accelerate moves in the DXY by:
Betting on future interest rate changes
Reacting to central bank statements
Anticipating geopolitical shifts
Speculating on currency volatility
When sentiment aligns strongly toward a stronger dollar, DXY surges can become sharp and rapid.
9. Are DXY Surges Long-Lasting or Short-Term?
DXY surges can be:
Short-term
Driven by market speculation, sudden news events, or temporary crises.
Long-term
Driven by structural trends such as:
Prolonged interest rate cycles
Shifting global trade patterns
Long-term weakness in other currencies
Robust U.S. economic outperformance
The duration of a surge depends on the underlying forces.
Conclusion
A DXY surge reflects a combination of economic strength, monetary policy decisions, global risk sentiment, and comparative currency performance. When the index rises, it signals confidence in the U.S. economy, but also can indicate stress in global markets. The effects are far-reaching: commodities tend to fall, emerging markets can struggle, and U.S. exporters may face headwinds. Yet for investors seeking safety and stable returns, a surging dollar is often a sign of global capital flowing into the United States.
Understanding why the DXY surges helps traders, policymakers, and investors navigate global markets with greater clarity and insight.
Venture Capital’s Global Impact1. Driving Global Innovation
At its core, venture capital exists to fund innovation. VC firms invest in early-stage businesses that have high growth potential but also high risk—companies that traditional banks or lenders would rarely touch.
This willingness to fund experimentation has brought to life some of the world’s most transformative technologies:
The internet and search engines
Smartphones and mobile applications
Artificial intelligence and machine learning
Electric vehicles and clean energy
Biotechnology and precision medicine
E-commerce and fintech platforms
Without venture capital, many of the revolutionary companies we know today—Google, Facebook, Tesla, Uber, Alibaba, Shopify, and countless others—might never have scaled globally. VC acts as the financial fuel behind groundbreaking ideas, enabling startups to test, iterate, and expand at lightning speed.
2. Boosting Economic Growth and Job Creation
One of the most measurable global impacts of venture capital is economic expansion. VC-backed companies consistently outperform traditional businesses in terms of job creation, revenue growth, and market expansion.
Key economic contributions include:
2.1 Employment Generation
Startups supported by venture capital create millions of high-skill jobs across software development, research, engineering, marketing, and operations. These companies often become large-scale employers once they scale, contributing significantly to national employment figures.
2.2 Creation of New Industries
Entire industries—like ride-sharing, cloud computing, online education, and fintech—were built on VC funding. These sectors not only generate direct jobs but also create large support ecosystems.
2.3 Attracting Global Investments
Countries with strong VC ecosystems attract foreign investors, multinational corporations, and global funds. This strengthens the balance of payments and increases capital inflows.
3. Increasing Global Competitiveness
Venture capital plays a crucial role in helping nations remain competitive in the global innovation race. Countries with robust VC networks—such as the U.S., China, India, Israel, the U.K., and Singapore—are also leaders in cutting-edge technology.
3.1 Encouraging Entrepreneurship
VC fosters a culture where innovation is rewarded, raising the confidence of entrepreneurs to take risks and build new enterprises.
3.2 Commercialization of Research
Universities and research centers often commercialize their technology through venture funding. This bridges the gap between academic research and real-world application, making scientific discoveries accessible to industries.
3.3 Regional Development
In many countries, venture capital helps geographically underdeveloped regions grow by funding startups, incubators, and innovation clusters. Examples include:
Bangalore, India
Shenzhen, China
Tel Aviv, Israel
Berlin, Germany
São Paulo, Brazil
These cities became global tech hubs primarily because venture capital supported entrepreneurs and attracted international talent.
4. Supporting Technological Advancement and Transformation
Technology evolves at a rapid pace, and venture capital ensures that the world keeps moving forward. VC firms not only provide money—they bring mentorship, strategic planning, and global networks that help startups commercialize their innovations.
4.1 Accelerating Disruptive Technologies
VC funding pushes forward technologies such as:
Artificial intelligence
Blockchain and Web3
Robotics and automation
Green energy and sustainability
Space technology
Biotech and genomics
By taking early risks, VC funds encourage breakthroughs that later become everyday tools.
4.2 Redefining Traditional Industries
Venture-backed startups are transforming traditional sectors:
Fintech is reshaping banking.
Edtech is revolutionizing education.
Healthtech is changing medical diagnostics and treatment.
Agri-tech is improving farming efficiency.
Clean-tech is transforming energy and climate solutions.
This disruption leads to greater efficiency, lower costs, and improved services worldwide.
5. Strengthening Global Entrepreneurship Ecosystems
Venture capital has a multiplier effect on entrepreneurship. As startups succeed, founders often reinvest capital and experience into newer ventures, creating a self-sustaining cycle.
5.1 Success Stories Inspire Future Innovators
Global VC successes have encouraged millions to start businesses of their own.
Examples:
Silicon Valley unicorns influenced entrepreneurship in Europe and Asia.
India’s startup boom accelerated after Flipkart and Paytm gained global recognition.
China’s tech giants like Tencent and Alibaba inspired an entire generation of Chinese entrepreneurs.
5.2 Growth of Startup Support Networks
VC involvement leads to the development of:
Incubators
Accelerators
Angel networks
Innovation labs
Entrepreneurial universities
This infrastructure builds long-lasting entrepreneurial ecosystems.
6. Encouraging Globalization and Cross-Border Economies
Venture-capital-backed startups often expand internationally faster than traditional companies. This creates a more connected global marketplace.
6.1 Cross-Border Investments
VC firms frequently invest across borders. U.S. VC firms invest in India, China, and Europe; Asian firms invest in Africa and Latin America. This makes capital global and accessible.
6.2 International Market Expansion
Startups scale globally using VC networks, entering multiple continents in just a few years. This globalization drives economic integration, technology exchange, and cultural connectivity.
6.3 Knowledge Transfer
VC-backed companies bring global expertise—operational strategies, product design, marketing models, and technological know-how—to developing markets.
7. Supporting Social and Environmental Change
In recent years, venture capital has expanded beyond purely profit-driven investments. Many funds now prioritize impact investing, focusing on startups that solve global challenges such as:
Climate change
Renewable energy
Clean mobility
Healthcare access
Food security
Education for all
Impact-driven venture capital is driving innovation in sectors essential for sustainable global development.
8. Creating Wealth and Financial Growth
Venture capital has created massive wealth for founders, investors, and employees. This wealth, in turn, fuels new businesses and supports economic development.
8.1 Building Billion-Dollar Companies
Unicorn startups—those valued at over $1 billion—have become common worldwide. They drive national GDP growth and attract new investments.
8.2 Stock Market Growth
Many venture-backed companies go public through IPOs, contributing to stock market expansion and providing investment opportunities for the broader population.
Conclusion
Venture capital’s global impact extends far beyond funding startups. It is a powerful driver of innovation, economic growth, job creation, global competitiveness, and societal transformation. Through risk-taking and visionary investment, VC has shaped modern technology, transformed industries, and accelerated global development. As the world continues to evolve, venture capital will remain at the forefront of unlocking new opportunities and pushing the boundaries of what is possible.

Shipping, Freight, and Logistics Trading1. Introduction to the Global Shipping and Freight Ecosystem
Shipping and freight represent the physical movement of goods, while logistics covers the planning, coordination, and management that make this movement possible. Together, they form a vast network involving shipping lines, freight forwarders, port operators, customs agents, brokers, and traders. Globalization has made this sector indispensable: 90% of world trade moves through the maritime shipping industry.
Shipping is dominated by large vessels—tankers, container ships, bulk carriers—that transport everything from crude oil and LNG to electronics and automobiles. Freight, meanwhile, includes all modes of transportation—sea, air, road, and rail—often combined in multimodal systems. Logistics integrates these modes into a seamless flow, ensuring timely delivery, cost efficiency, and compliance with regulations.
2. How Shipping and Freight Markets Work
Shipping markets operate on supply and demand. Freight rates rise and fall depending on global trade volumes, vessel availability, fuel prices, geopolitical stability, and port congestion. For example:
When China increases steel production, demand for iron ore shipping rises.
If crude oil prices surge, tanker rates typically move higher.
Geopolitical tensions affecting key routes (like the Suez Canal or Red Sea) can cause disruptions and spike spot freight rates.
Freight markets are divided into two broad categories:
a. Spot Market
This is where vessels are chartered for immediate use. Rates fluctuate daily based on market conditions. Spot trading is common in container shipping and bulk carriers.
b. Contract Market
Long-term contracts (time charters, voyage charters) offer stable pricing and predictable supply. Large corporations rely on these for consistent supply chain operations.
Traders, shipping companies, and brokers constantly analyze these markets to capture opportunities in freight rate movements.
3. Types of Freight: Sea, Air, Road, and Rail
1. Sea Freight
Sea freight is the most cost-effective method for bulk goods. There are three core vessel types:
Dry bulk carriers (coal, grain, iron ore)
Tankers (crude oil, petroleum products, LNG)
Container ships (consumer goods, electronics, machinery)
Shipping trading is most active in this segment due to volatile freight rates.
2. Air Freight
Air freight is used for high-value or time-sensitive goods. It is expensive but essential for pharmaceuticals, electronics, perishables, and emergency shipments.
3. Road Freight
Road transport handles last-mile delivery and short- to medium-distance cargo. Trucking markets also have spot and contract rates influenced by fuel prices and driver availability.
4. Rail Freight
Rail is efficient for heavy industrial cargo—coal, steel, fertilizer, and automobiles. It plays a vital role in countries with large landmass, such as India, China, and the U.S.
4. Logistics: The Strategic Framework Behind Freight
Logistics is the science and strategy behind moving goods. It includes:
Inventory management
Warehousing
Distribution planning
Route optimization
Customs clearance
Packaging
Order fulfillment
Supply chain visibility
Advanced logistics uses technology such as GPS tracking, IoT sensors, warehouse automation, robotics, drones, and AI-driven demand forecasting.
Companies like DHL, FedEx, Maersk Logistics, and UPS are leaders in global logistics, providing end-to-end supply chain solutions.
5. Freight and Shipping Trading Markets
Trading in shipping and freight occurs through:
a. Physical Freight Trading
Actual cargo shipments are bought and sold. Traders negotiate:
Freight rates
Vessel chartering
Cargo booking
Port handling
Physical traders manage logistics for commodities like oil, LNG, coal, metals, grains, and chemicals.
b. Forward Freight Agreements (FFAs)
FFAs are financial instruments used to hedge against future freight rate fluctuations. They cover routes such as:
Baltic Dry Index (BDI)
Capesize, Panamax, Supramax segments
Tanker routes (VLCC, Suezmax, Aframax)
FFAs allow traders, ship owners, and charterers to lock in future freight rates, reducing exposure to volatility. They are settled in cash based on index prices.
c. Container Freight Rate Trading
This segment has grown due to global supply chain disruptions. Indices like:
Freightos Baltic Index (FBX)
Shanghai Containerized Freight Index (SCFI)
allow companies to hedge container shipping costs.
d. Logistics Derivatives
Emerging financial products that allow hedging warehousing costs, trucking rates, and port congestion costs.
6. Key Drivers of Shipping, Freight, and Logistics Prices
1. Global Trade Cycles
Economic expansion increases cargo flows, while recessions reduce demand.
2. Fuel Prices
Bunker fuel costs heavily influence freight rates.
3. Capacity and Fleet Supply
An oversupply of vessels leads to low shipping rates; undercapacity pushes rates up.
4. Geopolitics
Conflicts near major routes (Red Sea, Strait of Hormuz, Taiwan Strait) disrupt shipping lanes.
5. Port Congestion
Delays in ports such as Shanghai, Los Angeles, or Rotterdam cause freight surges.
6. Weather and Natural Disasters
Monsoons, hurricanes, and cyclones affect shipping schedules and capacity.
7. Regulations
IMO emission rules increase operational costs, influencing freight rates.
7. Major Players in Shipping and Logistics Trading
Shipping Lines – Maersk, MSC, CMA CGM, Hapag-Lloyd
Freight Forwarders – DHL Global Forwarding, Kuehne + Nagel
Commodity Traders – Glencore, Trafigura, Vitol, Cargill
Port Operators – DP World, PSA International, Adani Ports
Brokerage Firms – Clarksons, Simpson Spence Young
Logistics Integrators – FedEx, UPS, Maersk Logistics
These players create an interconnected ecosystem facilitating global commerce.
8. How Traders Participate in This Market
Shipping and freight traders engage through:
a. Speculating on Freight Rates
Buying FFAs when expecting rates to rise or selling when expecting a fall.
b. Chartering Vessels
Traders take vessels on time charter and sub-charter them at higher spot rates.
c. Cargo Arbitrage
Buying commodities in cheaper markets and shipping them to higher-priced regions.
d. Operational Trading
Managing logistics for commodity trades to optimize cost and efficiency.
e. Hedging Freight Exposure
Manufacturers and exporters use freight derivatives to lock in shipment costs.
9. Future Trends in Shipping, Freight, and Logistics Trading
1. Digitalization and AI
AI-powered routing, predictive freight pricing, and automated documentation.
2. Green Shipping
Zero-emission fuels such as ammonia, hydrogen, LNG, and methanol will transform operating costs.
3. Blockchain for Documentation
Digital bills of lading reduce fraud and speed up transactions.
4. Autonomous Vessels and Drones
Expected to reduce manpower dependency and increase operational precision.
5. Supply Chain Resilience
Companies are shifting to multi-route strategies after disruptions like COVID-19 and geopolitical tensions.
Conclusion
Shipping, freight, and logistics trading form the circulatory system of the global economy. From physical movement of goods to financial trading of freight derivatives, this sector is essential to global trade, commodity markets, and economic stability. Understanding how freight rates work, how logistics integrates each stage of movement, and how traders participate in these markets provides a powerful foundation for anyone interested in global commerce or financial markets.
Forex Market Analysis1. Understanding Forex Market Dynamics
Before diving into analysis techniques, it’s essential to understand what drives currency movements. In forex, currencies trade in pairs, such as EUR/USD, USD/JPY, or GBP/INR, meaning the value of one currency is always measured against another. Their movement is influenced by:
Economic performance of countries
Interest rate differentials
Geopolitical developments
Trade balances & capital flows
Market sentiment and risk appetite
Forex is inherently complex because it reflects global financial health, investor preferences, and government policies. Hence, sound analysis helps simplify that complexity.
2. Fundamental Analysis in Forex
Fundamental analysis examines the economic, political, and social forces that impact currency values. It focuses on macroeconomic indicators and central bank policies to gauge whether a currency is undervalued or overvalued.
a. Economic Indicators
Traders closely monitor key data releases:
1. GDP (Gross Domestic Product)
A growing economy strengthens its currency because foreign investors move capital into that country.
2. Inflation (CPI & PPI)
Moderate inflation is healthy, but high inflation typically weakens a currency. However, higher inflation may force central banks to raise interest rates, supporting the currency.
3. Employment Data
The U.S. Non-Farm Payrolls (NFP) is the most watched employment report globally. Strong job growth boosts currency strength.
4. Retail Sales & Consumer Confidence
Consumer-driven economies like the U.S. and Eurozone react significantly to spending data.
5. Trade Balance
A country with higher exports than imports (trade surplus) usually sees its currency appreciate as foreign buyers demand that currency.
b. Central Bank Policies
Central banks like the Federal Reserve (Fed), the European Central Bank (ECB), and the Reserve Bank of India (RBI) have enormous influence on forex markets.
Interest Rates
Higher interest rates attract foreign capital, increasing demand for the currency.
Monetary Policy Statements
Statements about inflation, economic growth, or recession potential can cause major volatility, even without actual rate changes.
Quantitative Easing (QE) or Tightening
QE usually weakens a currency; tightening strengthens it.
For example:
Fed Rate Hikes → USD strengthens
ECB dovish signals → EUR weakens
c. Geopolitical Events
Political uncertainty can cause currency depreciation:
Elections
Trade wars
International conflicts
Government instability
Investors often move to safe-haven currencies like USD, CHF, and JPY during uncertain times.
3. Technical Analysis in Forex
Technical analysis studies price charts, historical data, and market patterns to forecast future currency movements. Unlike stock markets, forex markets are highly liquid and more technical in nature, making chart analysis extremely effective.
a. Price Charts
Common chart types:
Candlestick charts (most popular)
Line charts
Bar charts
Candlesticks offer information about market psychology through patterns like:
Bullish engulfing
Doji
Hammer
Shooting star
These patterns help traders identify reversals and continuations.
b. Trend Analysis
Identifying market direction is central to technical analysis:
Uptrend: Higher highs, higher lows
Downtrend: Lower highs, lower lows
Sideways trend: Ranging market
Trendlines, channels, and moving averages help determine momentum and potential breakout points.
c. Technical Indicators
Key indicators used in forex trading include:
1. Moving Averages (MA & EMA)
Used for trend direction and dynamic support/resistance.
50-day and 200-day EMA crosses often signal major trend shifts.
2. RSI (Relative Strength Index)
Measures overbought (>70) and oversold (<30) conditions.
3. MACD (Moving Average Convergence Divergence)
Tracks momentum and helps identify trend reversals.
4. Bollinger Bands
Indicate price volatility; when bands contract, breakouts usually follow.
5. Fibonacci Retracement
Used to identify pullback levels and continuation zones during trends.
d. Chart Patterns
Forex traders heavily rely on chart structures:
Reversal Patterns
Head and shoulders
Double top and bottom
Inverse head and shoulders
Continuation Patterns
Triangles (ascending, descending, symmetrical)
Flags and pennants
Rectangles
Chart patterns help predict price breakout direction and potential targets.
4. Sentiment Analysis
Sentiment analysis captures how traders feel about a currency pair. It reflects crowd psychology and risk appetite.
a. Risk-On vs Risk-Off Behavior
Risk-On: Investors buy higher-yield or riskier currencies (AUD, NZD, emerging markets).
Risk-Off: Investors move to safe-haven currencies (USD, JPY, CHF).
b. Commitment of Traders (COT Report)
Published weekly by the CFTC in the U.S., it shows how institutional traders are positioned—long or short—on major currencies.
c. Market News & Headlines
Breaking news immediately shifts sentiment:
Natural disasters
Political announcements
Sudden policy changes
Sentiment often triggers short-term volatility, even if fundamentals remain stable.
5. Intermarket Analysis in Forex
Currencies are deeply connected to other asset classes:
a. Bonds and Interest Rates
Bond yields strongly influence currencies.
Higher yields → stronger currency.
b. Commodities
Some currencies move with commodities:
CAD with crude oil
AUD with gold and minerals
c. Stock Markets
Strong equity markets attract foreign investment, supporting the domestic currency.
6. Developing a Forex Analysis Strategy
Successful forex traders integrate all three analysis types:
1. Fundamental View
Understand the economic backdrop and long-term direction.
2. Technical Setup
Find entry and exit points using charts, patterns, and indicators.
3. Sentiment Confirmation
Assess whether market mood supports the trade idea.
Example:
If fundamentals signal strong USD,
Technical charts show bullish breakout on USD/INR,
Sentiment moves “Risk-Off”,
→ A long position is valid.
7. Practical Tools for Forex Analysis
1. Economic Calendars
Track upcoming news releases.
2. TradingView & MetaTrader Charts
For chart analysis and indicators.
3. Forex News Platforms
Bloomberg, Reuters, and central bank websites.
4. Volatility Indicators
ATR and VIX (indirectly) help assess risk levels.
8. Importance of Risk Management in Analysis
Even perfect analysis fails without risk control. Forex is highly leveraged; thus:
Always use stop-loss
Avoid over-leveraging
Diversify trades
Respect market volatility
Keep emotions in check
Risk management ensures long-term survival despite inevitable losses.
Conclusion
Forex market analysis is a powerful framework that combines economic understanding, technical expertise, and sentiment reading to interpret currency movements. As the world’s most liquid market, forex responds instantly to global developments, requiring traders to be informed, agile, and analytical. The best results come from blending fundamental views with technical setups and sentiment signals, along with disciplined risk management. With consistent practice and a structured approach, traders can navigate forex markets more confidently and effectively.
Why We Loaded $MSTR at $169 (5:1 Risk/Reward to $355)Have you ever watched a stock pull back 65% and wondered if it was opportunity or disaster?
Have you ever missed a major setup because fear told you to stay away?
This analysis breaks down why NASDAQ:MSTR at $169 presented a textbook geometric retracement opportunity with exceptional risk/reward asymmetry.
Hello ✌️
Spend 3 minutes ⏰ reading this educational breakdown of structure-based position entry.
🎯 Analytical Insight on MSTR
MicroStrategy pulled back from $543 to $169 a 65% retracement that brought price directly into a major accumulation zone. This wasn't random. It aligned perfectly with:
Fibonacci retracement from 2020 lows to 2024 highs
A long-term ascending trendline dating back to 2020
The monthly $112 support zone that held as a floor
Our position entry: $169
Our invalidation level: $131.80 (below structure)
Our first target: $360 (previous resistance zone)
Risk: $37.20 per share
Reward: $191 per share
Ratio: 5.13:1
This setup didn't require predicting the future. It required identifying where risk was defined and reward was probable based on historical price structure.
📚 Educational Section: Why Geometric Retracements Work
The Psychology of Pullbacks
When price drops 65%, most traders experience:
Fear that it will continue falling forever
Doubt about whether the trend is still valid
Paralysis from watching others panic sell
Professional traders see the same chart differently:
Defined risk at structural support
Historical patterns of mean reversion
Favorable asymmetry when risk is small relative to potential reward
The majority fears what professionals buy.
📉 Understanding Market Structure
Markets don't move in straight lines. They:
Trend in one direction (impulse)
Retrace to gather liquidity (correction)
Resume the primary direction (continuation)
The 0.618 to 0.786 retracement zone historically shows the highest probability of reversal in trending assets. Why?
Early sellers have exhausted
Value buyers recognize the discount
Risk can be defined tightly below support
At $169, MSTR offered:
Clear invalidation below $131.80
Multiple timeframe confluence
Structural support from prior consolidation
🎯 Why This Entry Made Sense
Risk Was Defined
Below $169, the next logical support was $131.80. If price broke below that level, the bullish structure would be invalidated. This gave us a clear exit point before entering.
Reward Was Probable
The previous resistance zone at $360 represented a 113% gain from entry. Even a conservative 50% retracement would target $220+, still offering excellent reward.
Structure Aligned
Monthly support held
Trendline from 2020 intact
Retracement zone tested multiple times
Volume showed exhaustion, not acceleration
📊 Tools Used for This Analysis
Fibonacci Retracement
Identified the 0.786 level as a deep pullback zone where buyers historically step in.
Trendline Analysis
The ascending line from 2020 provided dynamic support that price respected.
Volume Profile
Showed accumulation at lower levels with decreasing selling pressure.
Horizontal Support Zones
The $105-110 monthly level acted as a psychological floor, preventing further collapse.
Risk/Reward Calculator
Entry: $169
Stop: $131.80
Target: $360
Result: 5.13:1 asymmetry
🛡️ Risk Management Framework
Stop Loss Below Structure
Our stop at $131.80 was placed below the invalidation point. If price reached that level, our thesis would be wrong and we'd exit with controlled loss of $37.20 per share.
Position Sizing Based on Risk
With $37.20 risk per share, position size was calculated to risk only 1-2% of total capital. This meant even if wrong, the account remained intact.
Target Based on Structure, Not Hope
$360 wasn't arbitrary. It represented previous resistance where sellers had historically appeared. We planned to reduce exposure at that level.
🧠 Trader Psychology: Why Most Miss These Setups
Fear of Catching a Falling Knife
After a 65% drop, the brain assumes it will continue. But without defined support, there's no knife just falling into the void. At $169, support was visible and the stop at $131.80 was clear.
Recency Bias
The most recent price action (the drop) feels like it will continue forever. Historical structure suggests otherwise, but emotions overpower data.
Herd Mentality
When everyone is bearish, contrarian positions feel uncomfortable. But the best risk/reward setups rarely have crowd consensus.
Waiting for Confirmation
Many traders wait for price to "prove" itself by moving higher first. By then, risk has expanded and reward has diminished. Entry at $169 with $37.20 risk is superior to entry at $250 with $118.20 risk to the same stop level.
📌 Proper Entry Execution
We didn't enter the entire position at once:
First third at $169 (initial position)
Second third at $155 if support retested (average down if structure held)
Final third reserved if $140 tested (closer to stop but maximum opportunity)
This scaling approach:
Reduced emotional pressure
Improved average entry if structure tested
Maintained discipline through volatility
🏆 What Professionals Do Differently
They Don't Chase Momentum
Entry at $543 (the top) felt safe because price was rising. Entry at $169 felt dangerous because price was falling. Professionals understand that perceived safety is often maximum risk.
They Define Risk First
Before asking "how much can I make," they ask "how much can I lose." The $131.80 level answered that question clearly.
They Accept Being Wrong
If MSTR broke $131.80, the position would be exited without hesitation. No hoping, no averaging down into a broken structure. Wrong is wrong.
They Journal Every Decision
Entry logic, risk parameters, and target zones were documented before entry. This removes emotion from exit decisions later.
🎯 Key Takeaways
✅ Risk/reward asymmetry matters more than being right: A 5:1 setup allows you to be wrong multiple times and still profit overall if position sizing is consistent.
✅ Structure defines opportunity: Random entries have random outcomes. Entries at defined support with clear invalidation have statistical edges.
✅ Emotions are the enemy: When $169 felt scary, that was the signal. When $543 felt safe, that was the warning.
✅ Patience beats prediction: We didn't predict $169 was the bottom. We identified it as a zone where risk was small ($37.20) and reward was large ($191). That's enough.
⚠️ Important Disclaimers
This analysis is educational and reflects a specific position entry based on technical structure. It is not financial advice or a recommendation to buy or sell MSTR or any security.
Position entries, stop losses, and targets are shared for educational purposes to demonstrate risk management principles. Your risk tolerance, timeframe, and capital allocation should differ based on your individual circumstances.
Past price structure does not guarantee future performance. MSTR could have broken $131.80 and invalidated this setup entirely, resulting in a controlled loss. Not all setups work, which is why risk management exists.
Always conduct your own analysis, consider your risk tolerance, and consult with a financial professional before making investment decisions. All trading and investing involves risk of loss.
✨ Support This Content
If this breakdown helped you understand structure-based entries and risk management, leave a comment with your thoughts or questions. Your engagement helps us create more educational content like this.
📜 Do your own research. Manage your risk. Trade with discipline.

Stop Loss: Feelings vs. Statistics (Why Fixed SL Fails)Most traders set their Stop Loss based on feelings: "I’ll put my stop below this wick" or "I always risk 50 points."
The problem? The market doesn't care about your 50 points.
The market has a natural heartbeat called Volatility. If you use static rules (fixed pips) in a dynamic market, you are gambling, not trading. Today, we replace "feelings" with Statistics using the Average True Range (ATR).
1. The Statistical Reality
Market volatility expands and contracts.
In low volatility: A 50-point move is a trend change.
In high volatility: A 50-point move is just "noise" (random fluctuation).
If your Stop Loss is placed inside the "Noise Zone," you will get stopped out even if your direction was correct. You are paying the market a fee for being too tight.
2. The Solution: The ATR Bands
The Average True Range (ATR) measures the average size of the last 14 candles. It calculates the "noise."
Instead of a fixed number, your Stop Loss should be dynamic. The Rule: A statistical stop loss should be outside the current noise—usually 2x the ATR.
3. The Tool in pinescript example
I have written a simple script for you. It draws a "Noise Channel" around the price.
If price is inside the gray zone: It is just noise.
If price breaks outside the band: The trend is statistically significant.
Open your Pine Editor and paste this in : ( before you paste the code to your pine editor keep the first line which is the version 6 then delete everything and past this code )
indicator("Kodologic: ATR Noise Bands", overlay=true)
// 1. Input for Sensitivity
multiplier = input.float(2.0, title="ATR Multiplier (Stop Distance)")
length = input.int(14, title="ATR Period")
// 2. Calculate the 'Heartbeat' (Volatility)
atrValue = ta.atr(length)
// 3. Define the Upper and Lower Statistical Bands
upperBand = close + (atrValue * multiplier)
lowerBand = close - (atrValue * multiplier)
// 4. Plotting
// The Gray Zone represents 'Market Noise'.
// A safe Stop Loss usually belongs OUTSIDE this zone.
p1 = plot(upperBand, color=color.new(color.red, 50), title="Statistical Short Stop")
p2 = plot(lowerBand, color=color.new(color.green, 50), title="Statistical Long Stop")
fill(p1, p2, color=color.new(color.gray, 90), title="Noise Zone")
4. The "Secret" to Consistency
When you switch to ATR stops, your Stop Loss distance will vary. Sometimes it will be wide, sometimes tight.
"But what if the ATR stop is too far away for my account?"
Do not tighten the stop. Lower your position size.
Amateurs try to force the market to fit their account size.
Pros adjust their position size to fit the market's reality.
Trade the data, not the hope.
I am building a series on how to move from subjective trading to objective, data-driven strategies using Pine Script. Follow for the next update.

Top 4 Price Action Signals For Beginners. Forex, Gold Trading
I will reveal 4 accurate price action signals that even a newbie trader will manage to easily recognize.
Watch carefully because these signals alone will help you to make a lot of money trading Forex, Gold or any other financial market.
Change of Character
Change of character is a strong signal that indicates a trend violation and a highly probable market reversal.
In a bearish trend, the change of character will be a bullish violation of the level of the last lower high.
Check how the change of character accurately indicated a bullish reversal on EURJPY pair.
In a bullish trend, a bearish violation of the level of the last higher low will signify a change of character and a highly probable bearish reversal.
Bearish violation of the last higher low level and a change of character on USDJPY gave a perfect bearish signal.
Breakout of Consolidation
No matter what time frame you trader, you probably noticed that quite often the markets become weak and start consolidating .
Most of the time, the prices tend to consolidate within horizontal ranges.
Breakout of one of the boundaries of the range can give you a strong trading signal.
Check how the price acted on GBPCHF.
The breakout of the support/resistance of the range always gave an accurate signal, no matter what was the preceding direction of the market.
Trend Line Breakout of a Pattern
There are a lot of trend line based bullish and bearish price action patterns: the ranges, the wedges, the triangles, the channels.
What unites these patterns is that the violation of the trend line of the pattern gives a strong trading signal.
A bullish breakout of a resistance line of a falling wedge, a bullish flag and a symmetrical triangle will give us a strong bullish signal.
Just look how EURUSD bounced after a bullish breakout of a resistance line of a falling wedge pattern.
While a bearish breakout of a support line of a rising wedge, a bearish flag or a symmetrical triangle will indicate a highly probable bearish continuation
Here is how a bearish breakout of the support of a symmetrical triangle formation helped me to predict a bearish movement on Gold.
Neckline breakout of a horizontal pattern
There are a lot of different price action patterns.
One element that unites many of them is the so-called horizontal neckline.
In bearish price action patterns like double top, head and shoulders, descending triangle, triple top, etc. a horizontal neckline represents a support from where buyers are placing their orders.
Bearish violation of such a neckline will be considered to be an important sign of strength of the sellers and a strong bearish signal.
In bullish price action patterns like double bottom, inverted head and shoulders pattern, ascending triangle, cup & handle, etc. a horizontal neckline represents a resistance where sellers a placing their orders.
Its bullish violation will a strong bullish signal.
Below is a perfect example how a bullish breakout of a neckline of an inverted head and shoulders pattern on Bitcoin triggered a strong bullish rally.
Here is how a breakout of a neckline of a double top on USDCAD confirmed an initiation of a bearish correctional movement.
The most important thing about these price action signals is that it is very simple to recognize them. You should learn the basic price action rules and a couple of classic price action patterns, it will be more than enough for you to identify confirmed bullish and bearish reversals on any time frame and any trading instrument.
❤️Please, support my work with like, thank you!❤️
I am part of Trade Nation's Influencer program and receive a monthly fee for using their TradingView charts in my analysis.

How Trading Markets Show Growth1. Price Appreciation: The Most Visible Sign of Market Growth
The most straightforward indicator of market growth is price appreciation. When the overall market rises, major indices such as the NIFTY 50, S&P 500, or Dow Jones show upward movement. Price growth reflects confidence, strong earnings, and bullish sentiment.
Why Prices Rise:
Higher corporate profits
When companies post strong earnings, investors expect future growth and push stock prices higher.
Lower interest rates
Cheaper borrowing costs encourage businesses to expand and consumers to spend.
Favorable global cues
Positive geopolitical stability or rising global demand often boosts markets.
Increasing liquidity
When more money flows into markets, it naturally drives prices upward.
However, price growth alone doesn’t always reflect true market strength. Sometimes markets rise due to speculation rather than fundamentals. Therefore, analysts look at other indicators to confirm growth.
2. Market Breadth: How Many Stocks Are Participating?
Market growth is healthier when a large number of stocks across sectors move upward, not just a few heavyweights.
Key Breadth Indicators:
Advance–Decline Ratio (ADR):
A high ADR shows more stocks rising than falling.
New Highs vs. New Lows:
If more stocks hit 52-week highs, it signifies broad participation.
Sector Rotation:
Growth is stronger when multiple sectors—like IT, banking, manufacturing, FMCG—move up together.
A market driven by only a few large companies may look strong on charts but remains vulnerable to sharp corrections. Broad-based rallies indicate sustainable growth.
3. Rising Trading Volumes: Another Major Clue
Volume shows the strength behind price movements. When markets grow with rising volumes, it signals genuine participation by investors.
Why Volume Matters:
Higher trust: More traders and institutions are confident.
Liquidity: Easier to buy and sell without big price swings.
Institutional activity: Large players accumulate stocks during growth phases.
A price rise without strong volume might indicate a temporary or weak rally, but rising prices with strong volume often confirm solid market growth.
4. Increased Market Capitalization: A Structural Indicator of Growth
Market capitalization—total value of all listed companies—offers a long-term view of market expansion.
What Increases Market Cap?
IPOs and new listings
Rising stock prices
Expanding corporate earnings
Sector development (e.g., renewable energy, AI, EVs)
When a market’s total capitalization rises consistently, it reflects economic expansion, more investor participation, and confidence in the business environment.
5. Positive Earnings Trends and Corporate Expansion
Markets fundamentally grow when companies grow.
Corporate actions that signal market growth:
Increasing revenues and profits
New product launches and innovation
Expansion into foreign markets
Large capex (capital expenditure) cycles
Dividend growth
When companies deliver strong results consistently, investors reward them by driving prices higher. Markets often show sustainable growth during periods of economic expansion and rising profit cycles.
6. Foreign Institutional Investment (FII) Inflows
FIIs are major market movers in developing economies like India. When foreign investors increase their holdings, markets grow rapidly because FIIs bring large amounts of capital.
Why FIIs invest more:
Stable government policies
Rising GDP
Favorable interest rate cycle
Strong currency
Attractive valuations
FII inflows often push markets to new highs, indicating global confidence in the region’s economic future.
7. Lower Volatility and Higher Stability
Growth phases are typically marked by lower volatility. When markets rise steadily without large swings, it signals:
Confidence among investors
Predictable economic environment
Stable business cycle
Indicators like the VIX (volatility index) are monitored to gauge stability. Declining volatility during rising markets is a classic sign of sustainable growth.
8. Technological Advancements and Higher Participation
Modern markets grow not only due to fundamentals but also due to structural improvements.
Technology-driven growth factors:
Online trading platforms
Faster execution
AI-based analytics
Increased financial literacy
Global accessibility through mobile apps
The rise of retail participation, especially after 2020, shows how technology boosts market growth by democratizing access.
9. Growth in Economic Indicators
Trading markets reflect the health of the overall economy. When major economic indicators turn positive, markets also show growth.
Key Indicators:
GDP growth
Declining unemployment
Rising industrial production
Higher consumer spending
Stable inflation
Markets often rally in anticipation of strong economic data since investors forecast higher corporate earnings.
10. Strong Business & Policy Environment
Government support can fuel market growth significantly.
Pro-growth policies include:
Lower taxes
Business-friendly regulations
Infrastructure spending
Stable monetary policy
Economic reforms
When the policy environment is supportive, businesses grow faster, which reflects in rising markets.
11. Bullish Investor Sentiment
Sentiment plays a massive role in driving markets upward. When traders feel positive, they buy more aggressively, pushing markets into a bull run.
Sentiment indicators include:
Investor surveys
Derivatives data
Options Put-Call Ratio
Media trends
Social media buzz
Strong sentiment combined with good fundamentals leads to prolonged market growth.
12. The Role of Global Markets
Local markets often mirror global trends. If the U.S., European, or Asian markets rally, emerging markets also show growth due to:
Increased risk appetite
Global capital flows
Lower global inflation
Strong worldwide demand
Trading markets are interconnected, and global strength often signals local growth.
Conclusion
Trading markets show growth through a combination of rising prices, higher participation, healthy economic conditions, strong corporate earnings, and favorable global trends. Growth is not merely a quick rally but a sustained upward movement supported by broad market participation, strong volume, investor confidence, and economic expansion. Understanding these indicators helps traders identify genuine growth phases and avoid temporary or speculative spikes.
The Importance of Reserves in Trading1. Definition and Types of Reserves
Reserves generally refer to the assets that a country, financial institution, or corporation keeps aside to meet future obligations, emergencies, or to stabilize economic activities. In the context of trading, reserves are primarily associated with central banks, which maintain foreign exchange reserves, gold reserves, and other liquid assets.
Foreign Exchange Reserves (Forex Reserves): These are holdings of foreign currencies, usually in the form of government bonds or deposits, used to back a country’s currency, manage exchange rates, and intervene in the forex market.
Gold Reserves: Traditionally, gold has been a store of value and a hedge against currency volatility. It is part of a country’s overall reserve portfolio.
Special Drawing Rights (SDRs) and Reserve Assets: Allocated by the International Monetary Fund (IMF), these act as supplementary foreign exchange reserve assets to support international liquidity.
Corporate and Bank Reserves: On a smaller scale, businesses and banks maintain cash or liquid reserves to manage operational risks, meet obligations, and ensure stability in trading activities.
2. Stabilizing Currency and Exchange Rates
One of the primary reasons reserves are important in trading is their role in stabilizing a country’s currency. In international trade, goods and services are often priced in stable foreign currencies, particularly the US dollar, Euro, or Japanese Yen. If a country’s currency fluctuates excessively due to market pressures, trade becomes unpredictable and costly.
Reserves allow central banks to intervene in the forex market by buying or selling currencies to maintain exchange rate stability. For example, if the local currency is depreciating sharply, the central bank can sell foreign exchange reserves to support its currency, preventing sudden spikes in import costs and preserving the competitiveness of exports. This stabilization ensures smoother trade transactions, predictable pricing, and confidence among international trading partners.
3. Ensuring Liquidity and Meeting Payment Obligations
Trade often involves payments across borders, which requires liquidity in foreign currency. Countries and corporations holding sufficient reserves can easily settle import bills, service foreign debts, and maintain creditworthiness. For businesses, maintaining cash reserves ensures that operational transactions, supplier payments, and contractual obligations are met without delay.
In times of economic stress, such as a balance-of-payments crisis, reserves act as a crucial liquidity buffer. They allow a country to continue trading, importing essential goods, and servicing debts even when other sources of financing are constrained. Without adequate reserves, a country risks defaulting on payments, facing higher borrowing costs, or experiencing a freeze in trade flows, all of which can be catastrophic for the economy.
4. Building Market Confidence and Creditworthiness
Reserves are not only about liquidity—they are also a signal of financial strength. Large reserves indicate that a country or institution is well-prepared to handle external shocks, giving confidence to investors, traders, and international financial institutions. This confidence translates into lower borrowing costs, stronger credit ratings, and greater willingness of foreign partners to engage in trade.
For instance, countries with ample forex reserves are perceived as more stable and less risky, which encourages foreign trade and investment. Corporations with healthy cash reserves or liquid assets are considered reliable partners in trade agreements, leading to smoother transactions and more favorable credit terms.
5. Hedging Against Trade Risks
International trade is inherently risky due to fluctuating exchange rates, commodity price volatility, geopolitical tensions, and economic downturns. Reserves act as a hedge against these risks. For example:
If a country faces a sudden surge in import prices due to a weakening local currency, reserves can be used to stabilize the exchange rate.
In commodity trading, reserves of strategic goods or currency assets can prevent supply disruptions or price shocks.
During global financial crises, reserves provide a cushion to continue critical trade operations without resorting to excessive borrowing or austerity measures.
This risk mitigation ensures that trade continues even under adverse conditions, protecting both the domestic economy and international trade relationships.
6. Facilitating Monetary and Trade Policies
Reserves give governments and central banks the flexibility to implement monetary and trade policies. By managing reserves effectively, countries can influence interest rates, control inflation, and maintain competitive export pricing. For instance, a country seeking to boost exports might use its reserves to prevent excessive appreciation of its currency, keeping export goods affordable in the global market.
Reserves also enable governments to implement trade agreements, provide subsidies, or intervene in strategic sectors without destabilizing the economy. They act as a financial lever, giving policymakers tools to balance growth, trade, and economic stability.
7. Supporting Crisis Management
History has repeatedly shown that countries with insufficient reserves face severe consequences during economic crises. Examples include sudden capital outflows, currency collapses, or trade restrictions. Reserves act as a shock absorber, allowing countries to navigate crises with minimal disruption to trade. During the 1997 Asian financial crisis, nations with higher reserves were able to stabilize their currencies faster, maintain trade flows, and recover more quickly than those with depleted reserves.
8. Strategic and Geopolitical Importance
Reserves also carry strategic significance. Countries with substantial reserves can influence global trade dynamics, secure critical imports, and participate in international financial negotiations with greater leverage. In geopolitically tense situations, reserves ensure that trade and essential imports continue uninterrupted, supporting national security and economic sovereignty.
Conclusion
Reserves are much more than a financial metric—they are a critical tool that underpins trading activities at every level. They stabilize currency and exchange rates, ensure liquidity, signal creditworthiness, mitigate risks, and enable effective policy implementation. For businesses, sufficient reserves safeguard operational continuity and international trade reliability. For countries, reserves act as both a shield against economic shocks and a lever for strategic influence in global markets.
In an interconnected and unpredictable global economy, reserves are the silent guardian of trade. They enable economies to operate smoothly, sustain investor confidence, and maintain a competitive edge in international commerce. Countries or institutions that fail to maintain adequate reserves face heightened vulnerability to market volatility, trade disruptions, and financial crises. Therefore, managing reserves prudently is not just an accounting exercise—it is a vital component of sustainable economic growth and successful trading.
Currency Wars and Forex TradingIntroduction
The global financial system is interconnected in complex ways, and one of the most crucial aspects of this system is the movement of currencies. Currency values are not just numbers on a screen; they represent national economic strength, political stability, and global competitiveness. Two concepts that are closely tied to this reality are currency wars and forex trading. Understanding them is essential for policymakers, investors, and traders who navigate the volatile world of international finance.
What are Currency Wars?
Currency wars, sometimes referred to as “competitive devaluations,” occur when countries deliberately devalue their own currencies to gain an advantage in international trade. The primary goal is to make exports cheaper and imports more expensive, stimulating domestic economic growth. For example, if Country A devalues its currency against the US dollar, its goods become cheaper for foreign buyers, potentially boosting exports. Conversely, imports from other countries become more expensive for domestic consumers, which can encourage consumption of locally produced goods.
Historically, currency wars are often associated with periods of global economic stress. The Great Depression of the 1930s and the financial crisis of 2008 both saw nations engaging in strategies to weaken their currencies to protect domestic industries. Currency wars can also arise from competitive monetary policies, where central banks use tools like interest rate cuts or quantitative easing to influence their currency’s value.
Causes of Currency Wars
Trade Imbalances: Countries with persistent trade deficits may attempt to devalue their currency to make exports more competitive and reduce the deficit.
Economic Stimulus Needs: During recessions, weaker currencies can boost domestic growth by encouraging exports.
Monetary Policy Differences: Central banks may adopt divergent policies—like lowering interest rates or engaging in quantitative easing—to influence their currency’s strength.
Global Political Tensions: Geopolitical rivalries can prompt countries to manipulate their currencies to protect economic interests.
While currency devaluation can stimulate exports, it also has risks. It can trigger inflation, erode consumer purchasing power, and provoke retaliatory measures from trading partners. If multiple nations engage in competitive devaluation simultaneously, a currency war emerges, potentially destabilizing the global economy.
Forex Trading: The Global Currency Market
Forex trading, or foreign exchange trading, is the act of buying and selling currencies in a decentralized global market. The forex market is the largest financial market in the world, with daily trading volumes exceeding $7 trillion as of 2023. Traders, investors, corporations, and governments participate to hedge risks, speculate on currency movements, or conduct international transactions.
The forex market operates 24 hours a day across different time zones, spanning financial centers in London, New York, Tokyo, and Sydney. Trading occurs in currency pairs, such as EUR/USD, USD/JPY, and GBP/USD. The value of a currency pair represents how much of the quote currency (the second currency) is needed to purchase one unit of the base currency (the first currency).
How Currency Wars Impact Forex Trading
Currency wars have a profound influence on forex markets. Since forex trading revolves around the relative value of currencies, any deliberate move by a government or central bank to weaken its currency creates volatility and trading opportunities.
Volatility and Speculation: Traders often capitalize on expected devaluations by short-selling the currency of a country engaging in competitive devaluation. Increased volatility can lead to both higher profits and greater risks.
Interest Rate Differentials: Central banks may cut interest rates to weaken their currency, affecting forex markets. Investors seek higher yields, leading to capital flows that influence currency values.
Safe-Haven Currencies: During currency wars, investors often flock to stable currencies like the US dollar, Swiss franc, or Japanese yen, affecting global liquidity and forex pricing.
Market Sentiment: Perceptions of a country’s economic health and political stability, influenced by currency policies, directly affect trading decisions in forex markets.
For instance, during the 2010s, when Japan aggressively pursued monetary easing to combat deflation, the Japanese yen experienced periods of significant depreciation. Forex traders who anticipated these moves were able to profit from yen carry trades and other strategies.
Trading Strategies in a Currency War
Currency wars create unique opportunities and risks for forex traders. Common strategies include:
Carry Trades: Traders borrow a low-interest-rate currency and invest in a high-interest-rate currency. In times of currency wars, the low-interest-rate currency may weaken, amplifying gains.
Technical Analysis: Traders analyze historical price movements, support/resistance levels, and technical indicators to predict currency movements in volatile markets.
Fundamental Analysis: Economic indicators such as GDP growth, trade balances, inflation, and central bank policies are closely monitored to anticipate currency devaluations.
Hedging: Corporations and investors may hedge their exposure to currency fluctuations using options, forwards, and futures contracts to manage risk during competitive devaluations.
However, currency war-induced volatility also carries risks of sudden market reversals. Traders must balance potential gains with the risk of unexpected policy changes or geopolitical developments.
Examples of Currency Wars in History
The 1930s Great Depression: Many countries devalued their currencies to boost exports, leading to trade tensions and global economic instability.
2008 Financial Crisis: Central banks in the US, Japan, and Europe implemented aggressive monetary easing, prompting fears of competitive devaluations.
US-China Trade Tensions (2010s–2020s): Both nations took measures affecting their currency values, impacting global trade flows and forex markets.
These examples show that currency wars are not only about short-term profit but also involve broader geopolitical and economic consequences.
Implications of Currency Wars
Global Trade Disruption: Competitive devaluations can distort trade balances and create uncertainty for exporters and importers.
Inflation Risks: Weaker currencies can increase import costs, driving domestic inflation.
Capital Flow Volatility: Investors may rapidly shift funds to perceived safe-haven currencies, affecting emerging markets.
Policy Retaliation: Countries may impose tariffs, quotas, or other trade barriers, exacerbating tensions.
Thus, currency wars have a dual impact: they influence both macroeconomic stability and micro-level trading opportunities.
Conclusion
Currency wars and forex trading are deeply intertwined. While currency wars involve deliberate attempts by nations to manipulate exchange rates for competitive advantage, forex trading represents the arena where these policies manifest in tangible price movements. Traders who understand the dynamics of currency wars can profit from volatility, but they must also navigate the risks of sudden policy shifts, global economic pressures, and geopolitical events.
In today’s interconnected world, the study of currency wars and forex trading is more relevant than ever. Central banks’ policies, global trade imbalances, and political developments can all cause rapid fluctuations in currency markets, influencing everything from international trade to individual investment portfolios. For policymakers, understanding the consequences of currency devaluation is critical to maintaining economic stability. For traders, monitoring these developments is essential for navigating the high-stakes, fast-moving world of forex markets.
Currency Trading in the World Market1. Understanding Currency Trading
At its core, currency trading involves exchanging one currency for another. Traders buy one currency while simultaneously selling another, seeking to profit from changes in exchange rates. Exchange rates represent the value of one currency in terms of another and fluctuate constantly due to factors like economic performance, interest rate differentials, geopolitical events, and market sentiment.
Currencies are quoted in pairs, such as EUR/USD, GBP/JPY, or USD/JPY, where the first currency is the “base” and the second is the “quote” currency. The quoted price indicates how much of the quote currency is needed to purchase one unit of the base currency. For example, if EUR/USD is 1.1000, it means 1 euro costs 1.10 US dollars.
2. Participants in the Forex Market
The Forex market comprises a wide array of participants, each with different motivations:
Central Banks: Central banks, such as the Federal Reserve (USA) or the European Central Bank, influence currency prices by setting monetary policy, adjusting interest rates, and intervening in currency markets to stabilize or devalue their currency. Their actions are critical drivers of market volatility.
Commercial Banks and Financial Institutions: Large banks dominate currency trading, providing liquidity to the market and executing trades for clients and proprietary trading desks. They are responsible for a significant portion of daily transactions.
Corporations: Multinational companies engage in Forex to hedge currency risk associated with international trade. For example, a US-based company importing goods from Europe may buy euros to pay suppliers, mitigating exposure to currency fluctuations.
Hedge Funds and Investment Managers: These participants trade large volumes in pursuit of profit, often employing sophisticated strategies such as arbitrage, carry trades, and algorithmic trading.
Retail Traders: Individual traders now have easy access to Forex markets through online brokers, trading platforms, and leverage. Although retail trading represents a smaller fraction of the market, it contributes to market depth and liquidity.
3. Major Currencies and Pairs
The Forex market revolves around a few major currencies that dominate global trade:
US Dollar (USD): As the world’s primary reserve currency, the USD is involved in about 88% of all Forex transactions.
Euro (EUR): Represents the Eurozone economy and is the second most traded currency.
Japanese Yen (JPY): Often used in carry trades due to historically low interest rates.
British Pound (GBP), Swiss Franc (CHF), Canadian Dollar (CAD), and Australian Dollar (AUD): Frequently traded currencies, reflecting the economies of major nations.
Currency pairs are classified as:
Major Pairs: Involving USD and another major currency (e.g., EUR/USD, GBP/USD, USD/JPY). They offer high liquidity and tight spreads.
Cross-Currency Pairs: Do not involve USD (e.g., EUR/GBP, AUD/JPY). They provide opportunities for trading without dollar exposure.
Exotic Pairs: Comprise a major currency and a smaller or emerging market currency (e.g., USD/TRY, USD/SGD). They offer higher volatility and risk.
4. Mechanics of Forex Trading
Forex trading is facilitated by brokers, electronic trading platforms, and interbank networks. Traders can execute trades using the spot market, forward contracts, futures, options, and swaps:
Spot Market: The most common form, where currencies are exchanged “on the spot” at current exchange rates.
Forward Contracts: Agreements to exchange currencies at a predetermined rate on a future date, used primarily for hedging.
Futures Contracts: Standardized contracts traded on exchanges to buy or sell currencies at a future date.
Options: Give the holder the right, but not the obligation, to buy or sell a currency at a specific rate by a certain date.
Swaps: Agreements to exchange currencies for a period, often to manage liquidity or interest rate differences.
Leverage is a critical aspect of Forex trading. Traders can control large positions with relatively small capital, magnifying both potential profits and losses. While leverage allows for greater exposure, it also increases risk, making risk management strategies such as stop-loss orders, position sizing, and diversification essential.
5. Factors Influencing Currency Prices
Currency values are influenced by a combination of economic, political, and psychological factors:
Interest Rates: Higher interest rates typically attract foreign capital, strengthening a currency.
Inflation Rates: Low inflation often supports currency value, while high inflation erodes purchasing power.
Economic Indicators: GDP growth, unemployment rates, trade balances, and manufacturing indices can influence investor sentiment.
Political Stability and Geopolitics: Elections, policy changes, conflicts, or sanctions create volatility.
Market Sentiment and Speculation: Traders’ perceptions, news events, and risk appetite can cause rapid price movements.
6. Trading Strategies
Forex trading strategies vary widely:
Day Trading: Involves entering and exiting positions within a single trading day to capitalize on short-term price movements.
Swing Trading: Trades last from several days to weeks, based on medium-term trends.
Position Trading: Long-term strategy relying on fundamental analysis, economic trends, and central bank policies.
Scalping: Very short-term trades aiming for small profits on frequent trades.
Carry Trade: Borrowing in a low-interest currency and investing in a high-interest currency to earn the interest differential.
7. Risks in Forex Trading
Forex trading carries significant risks:
Market Risk: Currency prices can fluctuate sharply due to economic or political events.
Leverage Risk: Amplified losses can exceed initial investment.
Liquidity Risk: Exotic currencies or certain trading hours may have limited liquidity.
Counterparty Risk: Risk of broker or bank default, especially in OTC trading.
Psychological Risk: Emotional decision-making can lead to poor trading outcomes.
Successful traders employ risk management techniques, including diversification, position sizing, stop-loss and take-profit orders, and careful analysis.
8. Technological Impact
Technology has revolutionized currency trading. Online platforms, automated trading systems, algorithmic trading, and access to real-time data have democratized the market. Traders now benefit from advanced charting tools, technical indicators, and AI-driven strategies that enhance decision-making.
9. Global Economic Importance
Forex trading is not just about profit; it plays a vital role in the global economy:
Facilitates international trade and investment by enabling currency conversion.
Helps countries manage currency value and monetary policy.
Provides liquidity, allowing businesses and investors to hedge currency risk.
Reflects and impacts economic stability, inflation, and interest rates.
10. Conclusion
Currency trading in the world market is a complex, dynamic, and high-stakes financial activity. Its size, liquidity, and accessibility make it appealing for a wide range of participants—from central banks to individual traders. Success requires understanding the interplay of economic indicators, geopolitical factors, market psychology, and technical strategies. While the potential for profit is high, so is the risk, emphasizing the need for education, discipline, and effective risk management. The Forex market will continue to evolve, shaped by technological innovation, regulatory frameworks, and global economic developments, remaining the backbone of international finance.
Exchange Rates: The Pulse of Global Trade1. What Are Exchange Rates?
An exchange rate is the price at which one currency can be exchanged for another. For example, if 1 US Dollar equals 83 Indian Rupees, this rate governs how American imports from India are priced and how Indian exports to the US are valued. Exchange rates are determined by the supply and demand for currencies in the foreign exchange (Forex) market, which is the largest and most liquid financial market in the world, with daily trading exceeding $6 trillion.
2. Types of Exchange Rates
There are two main types of exchange rates:
Floating Exchange Rates: Determined by market forces of supply and demand. Most major currencies like the US Dollar (USD), Euro (EUR), and Japanese Yen (JPY) operate on this system.
Fixed or Pegged Exchange Rates: Set and maintained by governments or central banks. For example, the Hong Kong Dollar is pegged to the US Dollar within a narrow band.
Additionally, there are managed floats, where central banks intervene to stabilize currency volatility without fully fixing it.
3. How Exchange Rates Influence Global Trade
Exchange rates play a pivotal role in determining trade flows:
Export Competitiveness: A weaker domestic currency makes exports cheaper for foreign buyers. For example, if the Indian Rupee weakens against the US Dollar, Indian goods become cheaper in the US, boosting export demand.
Import Costs: Conversely, a stronger domestic currency makes imports cheaper, reducing costs for businesses reliant on foreign raw materials or technology.
Profit Margins: Multinational corporations must account for currency fluctuations in their pricing strategies. Unhedged currency risks can erode profits.
4. The Hidden Secrets Behind Exchange Rate Movements
While exchange rates are publicly quoted, the underlying forces often remain opaque to casual observers. Some key “secrets” include:
Interest Rate Differentials: Countries with higher interest rates attract foreign capital seeking better returns. This capital inflow increases demand for the domestic currency, strengthening it. Traders monitor central bank policies closely because even minor rate changes can trigger significant currency moves.
Trade Balances vs. Capital Flows: Many assume trade balances alone dictate currency value, but capital flows—investments in stocks, bonds, and real estate—often have a larger impact. For instance, even a country running a trade deficit may see its currency appreciate if foreign investors are pouring money into its financial markets.
Speculative Forces: The Forex market is dominated by large banks, hedge funds, and institutional investors. Speculators can create short-term volatility by betting on expected currency movements, sometimes disconnecting exchange rates from economic fundamentals temporarily.
Political Risk Premiums: Exchange rates embed expectations of political stability. Elections, policy changes, trade wars, or geopolitical tensions can prompt sudden currency swings. For example, uncertainty about Brexit led to dramatic fluctuations in the British Pound.
Central Bank Interventions: Some central banks actively buy or sell their currency to stabilize trade competitiveness or control inflation. These interventions are often discreet, making their influence seem almost magical to outsiders. For example, Japan’s Bank of Japan has a long history of intervening in currency markets to maintain export competitiveness.
Currency Pegging Strategies: Some nations deliberately maintain undervalued currencies to promote exports. China’s historical management of the Yuan is a classic case; by keeping the currency artificially low, Chinese exports became cheaper globally, boosting economic growth.
5. Exchange Rate Risks in Global Trade
For companies involved in cross-border trade, exchange rates are a double-edged sword:
Transaction Risk: Deals agreed upon in foreign currencies may lose value if the exchange rate moves unfavorably before payment.
Translation Risk: Multinationals converting foreign earnings back to the home currency may see profits shrink due to adverse currency movements.
Economic Risk: Long-term currency trends can affect market competitiveness and strategic planning.
Businesses often use hedging instruments such as forward contracts, options, and swaps to mitigate these risks, but hedging itself requires careful timing and analysis.
6. The Role of Exchange Rates in Trade Policies
Governments and policymakers closely monitor exchange rates as they influence trade balances, inflation, and economic growth. Some subtle but powerful strategies include:
Devaluation: Intentionally lowering a currency’s value to make exports cheaper and stimulate economic growth.
Revaluation: Increasing a currency’s value to reduce inflationary pressures from imports.
Capital Controls: Restricting foreign investment flows to prevent excessive volatility in the domestic currency.
These strategies are sometimes opaque and subject to sudden changes, making the currency markets an arena of both economic and political strategy.
7. Global Trade Patterns and Currency Movements
Currency trends often shape global trade flows in ways that are not obvious:
Commodity Prices: Commodities like oil are priced in US Dollars. Countries dependent on these imports face a hidden “currency tax” if their own currency depreciates.
Regional Trade Blocs: Exchange rates influence regional competitiveness. For instance, the Euro affects intra-European trade and external trade with non-Euro countries.
Supply Chain Costs: Multinational companies adjust sourcing and production locations based on currency trends to optimize costs.
8. Long-Term Insights
Understanding exchange rates requires more than just watching daily quotes. Savvy traders and policymakers analyze:
Purchasing Power Parity (PPP): Long-term equilibrium exchange rates based on relative price levels.
Real Effective Exchange Rate (REER): Adjusted for inflation and trade weight, giving a more realistic measure of competitiveness.
Global Reserve Currencies: US Dollar dominance impacts how other currencies behave in trade. Countries holding large dollar reserves can stabilize their exchange rates and trade flows.
9. Technology and Algorithmic Influence
Modern currency markets are heavily influenced by technology:
Algorithmic Trading: Sophisticated algorithms detect tiny market inefficiencies, executing trades within milliseconds, which can amplify short-term currency volatility.
High-Frequency Trading (HFT): Small price differentials are exploited across different exchanges globally, subtly affecting exchange rates and market liquidity.
10. Key Takeaways
Exchange rates are central to global trade, influencing prices, demand, and competitiveness.
Beyond obvious supply and demand, factors like capital flows, speculation, political stability, and central bank strategies profoundly affect currency movements.
Businesses, investors, and governments must actively manage exchange rate risks to protect profits and economic stability.
Understanding long-term fundamentals like PPP, REER, and reserve currencies helps anticipate shifts in global trade patterns.
In short, exchange rates are both a reflection and a driver of global economic dynamics. Mastering their complexities offers a competitive edge in international business and investment—often a “hidden secret” that separates average market participants from those who profit consistently in global trade.
Arbitrage Opportunities Across World MarketsTypes of Arbitrage Opportunities in World Markets
Spatial Arbitrage (Geographical Arbitrage)
Spatial arbitrage occurs when the same asset is priced differently in two different locations. For instance, a stock listed on multiple exchanges, such as a dual-listed company on the NYSE and LSE, may have a price discrepancy due to currency exchange rates, local demand, or time zone differences.
Example: If Company X trades at $50 in New York and £40 in London, and the exchange rate is $1.25/£1, a trader can buy in London and sell in New York, locking in risk-free profit after accounting for transaction costs.
Triangular Currency Arbitrage
This form of arbitrage involves discrepancies in the foreign exchange (FX) market. Traders exploit differences in the quoted exchange rates of three currencies. The process is simple: convert Currency A to B, B to C, and then C back to A. If the resulting amount of Currency A exceeds the initial investment, a profit is realized.
Global FX markets, due to their size and high-frequency trading, often have momentary inefficiencies that allow for this type of arbitrage. However, modern algorithmic systems have significantly reduced the frequency of such opportunities.
Covered Interest Rate Arbitrage
In international finance, covered interest rate arbitrage occurs when interest rate differentials between countries do not align with forward currency rates. For example, if U.S. interest rates are lower than in Germany, a trader can borrow in the U.S., convert to euros, invest in Germany, and simultaneously hedge currency risk using a forward contract. The profit arises from exploiting the mismatch between interest rate differentials and forward exchange rates.
Statistical Arbitrage
Statistical arbitrage leverages mathematical models and historical data to identify pricing inefficiencies across markets. Rather than relying on direct price differences, traders look at correlated assets, market pairs, or index movements to generate returns. While not risk-free in the pure sense, statistical arbitrage is widely used in global equity and derivative markets.
Merger and Acquisition Arbitrage (Risk Arbitrage)
When global companies announce mergers or acquisitions, the stock price of the target often lags behind the expected acquisition price due to uncertainty. Traders can take positions anticipating the deal's completion. For example, if Company A in Japan announces a takeover of a U.S.-based Company B, the price of B may be lower on U.S. exchanges compared to its implied value post-merger. Cross-border arbitrage allows traders to exploit these gaps.
Global Market Dynamics Driving Arbitrage
Several factors contribute to arbitrage opportunities across world markets:
Time Zone Differences
Markets around the world operate at different hours, creating windows where one market may react to news before another. For example, Asian markets close before European markets open, which can lead to temporary pricing mismatches in assets that are traded globally.
Currency Fluctuations
Exchange rate volatility is a major source of arbitrage in international trading. Currency mismatches can cause the same asset to have different values when measured in local currencies. Traders can exploit this by engaging in currency-hedged arbitrage strategies.
Regulatory Differences
Different countries have unique rules on taxation, capital controls, and trading restrictions. Sometimes, these regulatory differences can create temporary price gaps for identical assets across borders.
Market Inefficiencies
Even in highly liquid markets, inefficiencies exist due to information asymmetry, technological delays, or mispricing. For example, an earnings report released in the U.S. may take minutes to reflect in Asian markets. Traders with rapid information access can profit during these periods.
Transaction Costs and Liquidity Constraints
While arbitrage seeks risk-free profits, transaction costs, taxes, and liquidity can limit profitability. Global arbitrage strategies often rely on high volumes and low latency systems to ensure that profits exceed costs.
Examples of Arbitrage Across Global Markets
Equity Arbitrage
Large multinational companies listed on multiple exchanges are prime candidates for arbitrage. For instance, Royal Dutch Shell, historically listed on both the Amsterdam and London stock exchanges, had frequent arbitrage opportunities when share prices diverged due to local market demand.
Commodity Arbitrage
Global commodities such as oil, gold, and natural gas often trade at different prices in different countries due to transportation costs, supply-demand imbalances, and currency differences. Traders can buy in one market and sell in another, factoring in shipping and storage costs.
Cryptocurrency Arbitrage
The cryptocurrency market, still relatively fragmented globally, offers arbitrage opportunities where coins trade at different prices across exchanges. For example, Bitcoin might trade at a premium on a South Korean exchange compared to a U.S. platform due to local demand and capital restrictions.
Risks in Global Arbitrage
Despite being theoretically risk-free, global arbitrage is not without challenges:
Execution Risk – Prices may converge before the trade is executed, erasing profits.
Currency Risk – Unhedged positions in foreign currencies can lead to losses if exchange rates move unfavorably.
Regulatory Risk – Changes in cross-border trading rules or capital controls can disrupt strategies.
Liquidity Risk – Certain assets may be illiquid in one market, preventing the arbitrage trade from being completed.
Technological Risk – Latency in trading platforms or connectivity issues can prevent timely execution of trades.
Technology and Arbitrage
In modern finance, technology has both created and eliminated arbitrage opportunities:
High-Frequency Trading (HFT): Firms use algorithms to detect and exploit price differences across global markets in milliseconds. This has made classical arbitrage rare but opened new avenues in microsecond-level inefficiencies.
Blockchain and Crypto Arbitrage: Decentralized exchanges and crypto platforms offer new arbitrage possibilities globally, though with added cybersecurity and regulatory risks.
Data Analytics and AI: Advanced statistical models help traders identify subtle arbitrage opportunities across correlated global assets, enhancing the scope of international trading strategies.
Conclusion
Arbitrage opportunities across world markets represent the intersection of finance, economics, and technology. They exist due to inefficiencies in pricing, regulatory environments, time zones, and currency fluctuations. Traders exploit these differences to earn theoretically risk-free profits, although real-world factors such as transaction costs, liquidity, and execution delays introduce challenges.
Global arbitrage is evolving with technology, creating sophisticated strategies that rely on speed, analytics, and international market understanding. While pure arbitrage profits have diminished in mature markets due to algorithmic trading, emerging markets and newer asset classes like cryptocurrencies continue to offer lucrative opportunities.
In essence, arbitrage reflects the ongoing dialogue between market efficiency and human ingenuity—a testament to the complexity and interconnectedness of the global financial system.
