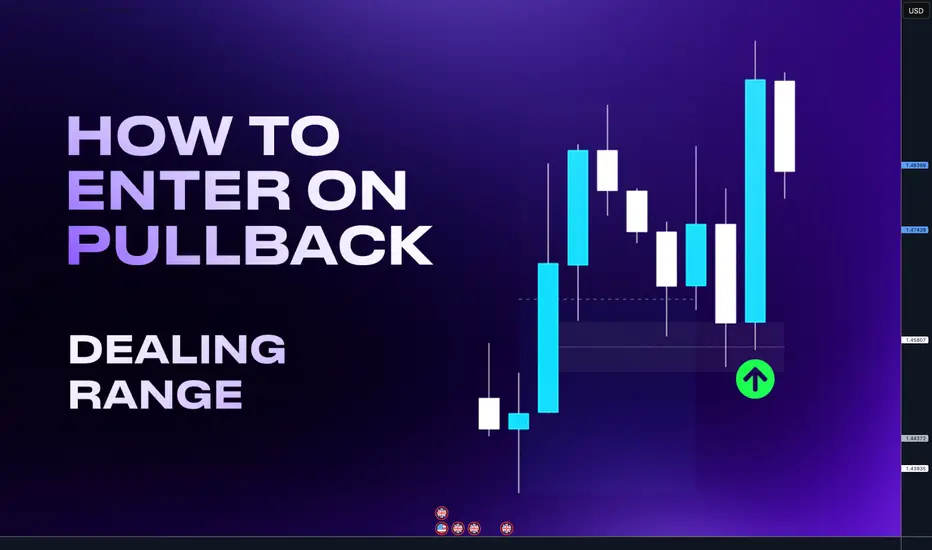
Dealing Ranges - Powerful filter tool to your tradingHello Traders today. I ll break down for you how to enter on a pullback with high accuracy and not being stopped out by using a fibonacci in other words a Dealing range.
A Dealing Range forms when price takes out both a swing high and a swing low, followed by a clear expansion move. That expansion swing becomes the dealing range.
• By dividing the dealing range in half, we get two zones:
• Discount region (lower half) – where buying opportunities are typically more favorable.
• Premium region (upper half) – where selling opportunities are typically more favorable.
• You can think of a dealing range as similar to a PD Array Matrix, but specifically applied to expansion swings rather than consolidation phases.
On the example bellow I drew a Dealing range. If I took the long from the key level in the premium the trade would fail. But if waited for the key level in discount I could get much better RR and explosive move vice versa is happening on the bearish order flow charts. Check on your charts
So why is this situation on the above happening quite often?
It's simple - Liquidity. Market makers needs liquidity to fill their orders so they print nice trade opportunities in the premium where trader enter this setup, for trend continuation.
Setup is technically right. But by placing the trades in premium they creates a stop loss cluster = liquidity in the discount. Then this happen - price go for the liquidity of early buyers in the premium hits key level in the discount and it continue with the trend.
Im not saying that key levels in the premium cant work, in the strong trend there is no always pullback to the discount. But by applying Dealing ranges you will get:
Less but more accurate trades
Higher Risk reward setups
You can build HTF narrative
Use it for targets
Better risk management
Remember, there is not always a key level in the premium and pullback to the discount is not enough. Trade must go from a key level. So if there is not a key level in the premium price is often retracing to the discount key level in order to create a liquidity around a key level price makes a false break which sucks traders in to the market and create a liquidity on a key level.
Dont enter if price is not going from key level its a trap.
Time frame alignments
Always use 2 timeframes Higher time frame (HTF) and Lower timeframe (LTF)
• Higher Timeframe (HTF) = Dealing ranges
• Lower Timeframe (LTF) = Market Profiles / Profiling
Timeframe sequence
HTF Monthly - LTF - Daily / H4
HTF Weekly - LTF - H4 / H1
HTF Daily - LTF H1/ M15
HTF H4 - LTF M15 / M5
Im giving 2x LTF options because sometimes you need to scale lower timeframe to understand price action and best entries. However for the confirmations you can do well with the main sequence of first two.
Apply this rule to any markets. Im adding links to few examples from stocks, crypto an FX where you can see application of this concept. Click to charts to open them and see how price behave in discount and premium.
Examples from successful Tradingview Ideas
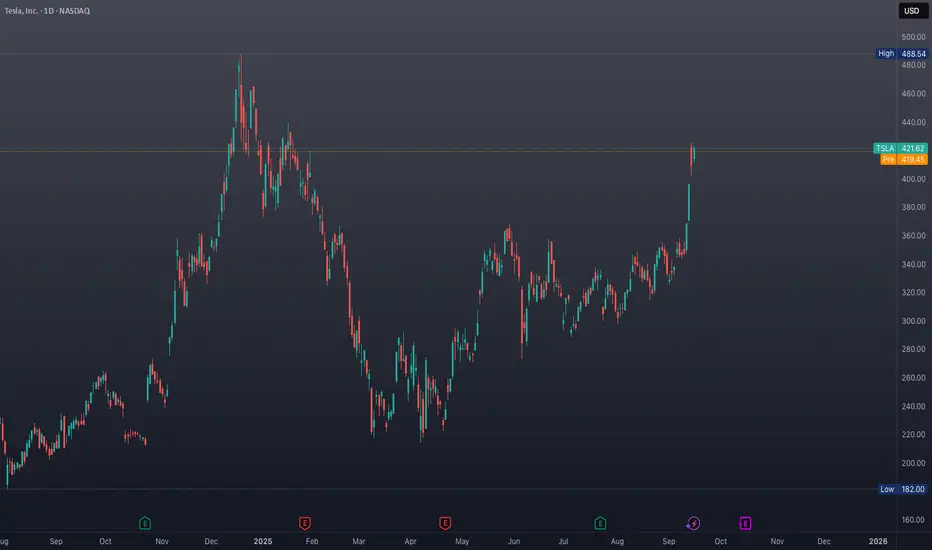
Tesla pullback to the discount - Low created in discount ATH most likely coming
Bitcoin pullback to the discount - Followed by expansion to ATH
Palantir pullback to the discount - followed by expansion to ATH
Bitcoin pullback to the Discount - followed by expansion
GBPCHF - Targeting Liquidity in the discount
Hope this help you in your trading journey. Let me know in the comments
David Perk aka Dave FX Hunter
Community ideas
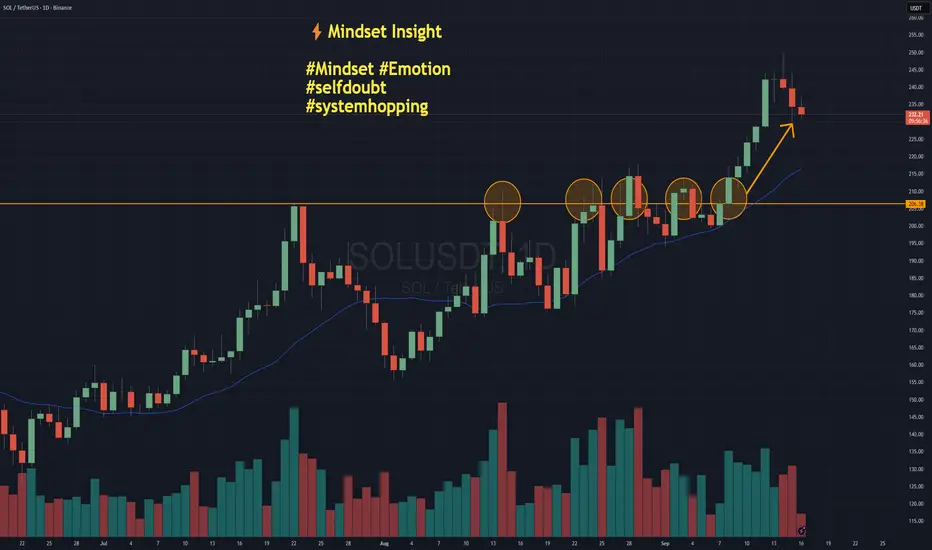
System Hopping - The Hidden Cost of Self-DoubtNOTE – This is a post on Mindset and emotion. It is NOT a Trade idea or strategy designed to make you money. If anything, I’m taking the time here to post as an effort to help you preserve your capital, energy and will so that you are able to execute your own trading system as best you can from a place of calm, patience and confidence.
Here’s a scenario:
You take a loss.
Then another.
Suddenly, the system you trusted yesterday feels broken today.
On this chart of Solana, imagine you were trading a breakout system. You may have had four false breaks that didn’t really follow through before the market finally broke higher. When do you give up on the idea or the system altogether?
How self-doubt shows up:
You start thinking: “Maybe another system would have worked better…”
You switch, tweak, reinvent mid-cycle.
You lose patience with the method you worked so hard to design.
You are in danger of system hopping.
Emotional side:
Self-doubt often disguises itself as “rational analysis,” but underneath it’s uncertainty, frustration, even a tightening in the chest. You hesitate to pull the trigger, second-guess your plan, or overcorrect with a brand-new approach.
It’s rarely your system that’s broken.
It’s the lack of trust in yourself to see it through.
Shift your mindset
Every system has drawdowns. If you abandon yours too soon, you never let it prove itself. So the task really is to find a way to collect the data without blowing out / over extending yourself.
Practical tips … the How:
Write down your system rules and keep them visible, so you trade what’s planned, not what you feel.
Track results over a proper sample size (50–100 trades) before judging performance.
Make sure you are position sizing sensibly. This is an art in and of itself. The key being - do not risk what you can not afford on any one trade / series of trades. Paper trade if you need to to start with just to collect the data on the system.
Journal emotions separately from trade outcomes — so you see when doubt is about you, not the system.
Set a “no system changes” rule during drawdowns. Only review at scheduled intervals.
Closing thought:
Your edge doesn’t come from finding the perfect system.
It comes from trusting a good one long enough to let it work.
The real reason 80% fail to achieve consistent profit?!Why do most traders never achieve consistent profit in crypto?
The problem isn’t strategy, it’s mindset and behavior.
This analysis reveals where hidden mental traps actually lie.
Hello✌️
Spend 2 minutes ⏰ reading this educational material.
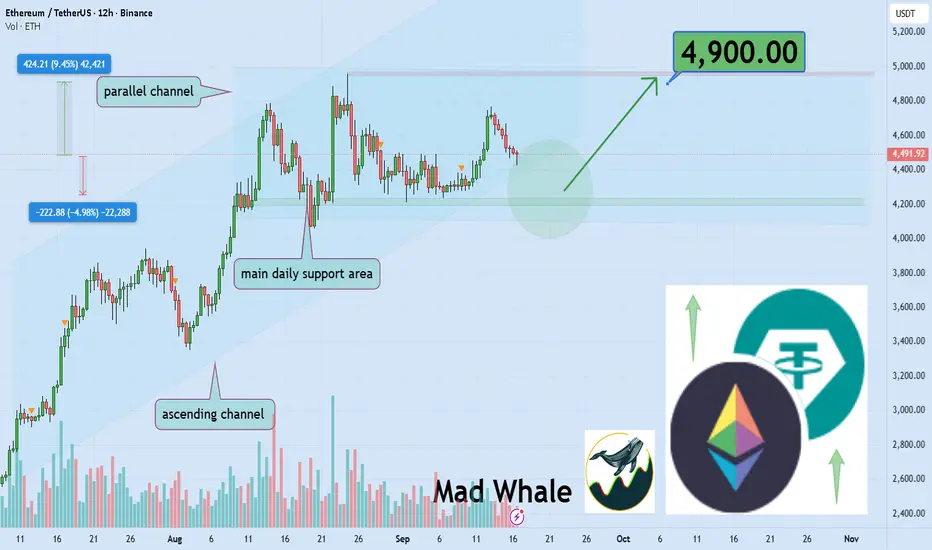
🎯 Analytical Insight on Ethereum:
Ethereum is testing the lower boundary of its bullish channel and key daily support 📉.
If this level holds, a potential 9% upside could target $4,900 🚀.
Now , let's dive into the educational section,
🚀 The cycle of trader failure
Most people enter the market chasing fast wealth.
The first thing they face is extreme volatility.
Fear and greed quickly consume every decision they make.
😱 Fear of losing
When the market dips, many freeze in panic.
Instead of seeing opportunity, they only see growing losses.
Early exits destroy potential profits before they can grow.
💸 Endless greed
In bullish trends, people believe the sky has no limit.
They buy recklessly, forgetting risk management completely.
The result? Getting trapped at the top and facing heavy losses.
🧠 The mindset problem
The truth is technical knowledge alone isn’t enough.
Without mental control, even the best tools are useless.
The market is, above all, a mirror of psychology.
📊 Beginner vs professional
Beginners chase quick wins, professionals chase survival.
One focuses on moments, the other on long-term trends.
This simple difference separates winners from losers.
🎯 The crowd’s blind spot
Most traders trust the collective sentiment of the masses.
But when everyone is fearful or greedy, the trend often flips.
That’s when whales extract maximum profit.
🛑 Lack of strategy
Many don’t even have a basic risk plan.
No stop loss, no position sizing, just gambling.
Inevitably, this leads to a blown account.
🔍 The importance of broader vision
Focusing on one candle or one signal is a trap.
Different timeframes tell completely different stories.
Only with a wide perspective can you read the market.
🛠 Useful TradingView tools
To overcome these challenges, TradingView offers tools that clarify your mindset:
Fear & Greed Index: measures collective psychology of the market.
RSI Indicator: detects overbought and oversold conditions.
Volume analysis: shows real capital inflows and outflows.
Smart alerts: let your actions be data-driven, not emotion-driven.
Support and resistance mapping: builds a solid trading plan.
Each tool becomes powerful only when combined with discipline and mental control.
📌 Conclusion
Most traders fail to achieve consistent profit because they’re trapped by fear, greed, and lack of structure. The path to survival lies in mastering psychology and using tools with discipline.
💡 Three golden recommendations
Always define your exit and stop loss before entering.
Enter trades only when your mind is calm, not emotional.
Consistency comes from daily discipline, not from chasing one lucky setup.
✨ Need a little love!
We pour love into every post your support keeps us inspired! 💛 Don’t be shy, we’d love to hear from you on comments. Big thanks , Mad Whale 🐋
📜Please make sure to do your own research before investing, and review the disclaimer provided at the end of each post.
Opportunities Return, Lost Money Doesn’tGold is making all-time highs like there’s no tomorrow. And yet, I haven’t joined the trendin the past days. I made some money selling last week, but I didn’t ride the wave higher. Am I sorry? Not at all.
This brings me to a principle that guides my trading: I would rather miss an opportunity than lose money.
________________________________________
Confidence Over FOMO
The most important thing in trading is not catching every move — it’s trading with confidence. Even when I lose, I want to know why I lost.
That way, the loss has meaning. It’s part of a process I can trust and refine.
At this moment, my internal radar simply won’t allow me to buy Gold. Sure, it might rise more, but I’m not upset about “missing out.” Why? Because I need to believe in what I trade.
If I don’t, then every tick against me becomes torture, and I start questioning myself at every piece of market noise.
________________________________________
Why Missed Opportunities Don’t Hurt
• Opportunities always come back. The market is generous in that way.
• Lost money doesn’t come back by itself. You need another trade, another risk, another exposure — and usually more stress.
• Confidence compounds. When you only take trades you truly believe in , you build trust in your own process. That trust is what keeps you alive in the long run.
________________________________________
The Psychological Edge
Traders often think missing a trade is painful. In reality, it’s a sign of strength. It means you didn’t bend your rules, didn’t give in to FOMO, didn’t chase a market just because “everyone else” is.
Trading without belief in your setup is like walking into a fight without conviction. You’re already halfway defeated.
________________________________________
Final Thoughts
Yes, Gold is printing all-time highs. Yes, I could have bought and made some money. But I’m fine with that. Because keeping my confidence and protecting my capital matters more than chasing every rally.
Opportunities are infinite. My capital and my confidence are not.
That’s why I’ll always prefer missing an opportunity over losing money.

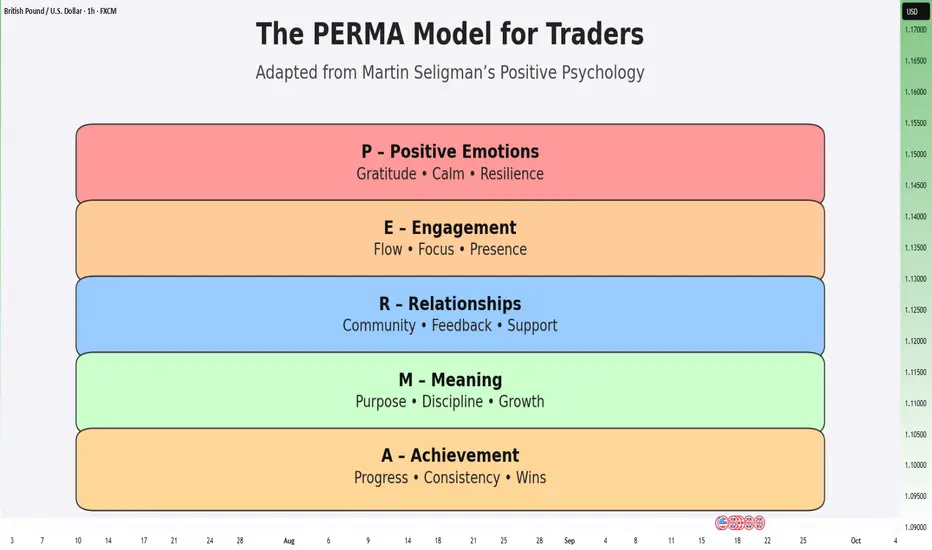
The PERMA Model: A Psychology Framework Every Trader Should UseIntroduction – Why Mindset Beats Strategy
You can have the best system in the world, but if your mind collapses under stress, you won’t follow it. That’s why traders need more than technical skills — they need a psychological framework.
One of the most powerful comes from Martin Seligman, founder of modern positive psychology. He introduced the PERMA model, designed to explain how humans thrive under pressure. And if there’s one place where pressure is constant, it’s trading.
________________________________________
P – Positive Emotions
Trading success starts with balance, not adrenaline. Cultivating gratitude and calm optimism helps you:
• Reduce impulsivity
• Build resilience after losses
• Make clearer decisions
👉 Daily practice: Write down 3 things you did well after each trading session.
________________________________________
E – Engagement
The best trades happen when you’re fully absorbed — no distractions, no second-guessing.
• Deep focus without burnout
• Quick but thoughtful decisions
• A fulfilling process regardless of outcome
👉 Tip: Limit screen time, trade with a plan, cut the noise.
________________________________________
R – Relationships
Trading feels solitary, but support is fuel. Surround yourself with people who grow, not just chase hype.
• Less isolation
• More constructive feedback
• Higher motivation
👉 Find: A community that values discipline over jackpots.
________________________________________
M – Meaning
Without a “why,” trading turns into random gambling. Purpose keeps you steady.
• Helps endure drawdowns
• Keeps you aligned with your rules
• Prevents burnout
👉 Ask yourself: “Why do I really trade? Freedom? Growth? Mastery?”
________________________________________
A – Achievement
Progress > perfection. It’s not about one jackpot, but consistent wins.
• A week of discipline = success
• Following your plan = victory
• Avoiding overtrading = growth
👉 Celebrate: The process, not just the P&L.
________________________________________
Conclusion – PERMA Could Be Your Hidden Edge
Seligman built PERMA as a blueprint for a fulfilling life. For traders, it’s more than theory — it’s a mental operating system.
If you want consistency, don’t just master charts. Master your mindset.
👉 Challenge: Pick one PERMA element and apply it this week. Journal the impact, and watch how your trading psychology changes. 🚀
GOLD FALL TIME Lets Goo , Gold Selling Now
Reason SMT & BEARISH FVG
And Buy Setup Gold From OB / DEMAND ZONE
LETS GOO , HIGH PROBABILITY SETUP
FOLLOW US FOR MORE TRADES

Technology Stocks & The AI BoomIntroduction: The New Tech Gold Rush
In every era of human history, technological revolutions have shaped the way societies evolve and how wealth is created. The Industrial Revolution brought us mechanization, the 20th century gave us electricity, telecommunications, and computers, while the late 1990s introduced the world to the internet revolution. Today, we are living through another seismic shift: the rise of artificial intelligence (AI) and its transformation of the stock market, especially technology stocks.
Investors around the world are eyeing AI as the most powerful catalyst of the decade. Just as oil fueled the 20th century economy, data and AI algorithms are fueling the 21st century economy. The AI boom is not just hype; it is fundamentally changing industries, reshaping business models, and creating trillion-dollar opportunities in stock markets.
This essay will dive deep into the evolution of technology stocks, the rise of AI as their newest driver, the role of big players like NVIDIA, Microsoft, and Google, the risks of a bubble, and what the future holds for investors who ride this wave carefully.
The Evolution of Technology Stocks: From Dot-Com to AI
Technology stocks have always fascinated investors because they sit at the heart of innovation. Let’s rewind a little:
Dot-Com Boom (1995–2000): The internet promised to change everything, and it did. Investors poured money into startups with “.com” in their names, many without real revenue models. NASDAQ soared, then crashed in 2000, wiping out trillions in value. However, companies like Amazon and Google survived and thrived, proving that real innovation eventually wins.
Mobile & Social Media Era (2005–2015): Apple, with its iPhone, reshaped communication. Facebook (now Meta) revolutionized social networking. Google became the “gatekeeper” of information, and Amazon scaled e-commerce like never before. This was the era when “FAANG stocks” (Facebook, Apple, Amazon, Netflix, Google) dominated markets.
Cloud & SaaS Boom (2010–2020): Companies realized that software could be rented as a service (SaaS) instead of sold as a product. Cloud computing giants—Amazon Web Services, Microsoft Azure, Google Cloud—emerged as critical infrastructure providers for the digital economy.
The AI Revolution (2020–present): The launch of ChatGPT in 2022 was a watershed moment. Suddenly, AI wasn’t just research—it was mainstream. From generative AI tools creating text, images, and code to predictive algorithms in finance, medicine, and logistics, AI began touching every corner of life. Stock markets reacted explosively, with NVIDIA becoming the poster child of the AI rally.
Technology stocks thrive on “future potential.” AI fits perfectly into this pattern because its potential is vast, even if not fully monetized yet.
AI as the Core Driver of the Next Tech Wave
Why is AI considered the core driver of the next tech wave? Several reasons stand out:
Exponential Data Growth – AI thrives on data, and we are producing more than ever (social media, IoT devices, sensors, financial transactions, medical records).
Computational Power – Thanks to GPUs from NVIDIA, AMD, and cloud infrastructure, AI models can now be trained at unprecedented speeds.
Real-World Applications – Unlike blockchain hype or metaverse dreams, AI already has immediate, tangible applications: customer service bots, fraud detection, drug discovery, self-driving cars, and personalized recommendations.
Economic Efficiency – Businesses see AI as a way to cut costs, automate repetitive tasks, and improve decision-making. This makes adoption financially attractive.
Government & Military Investment – Nations view AI as a strategic asset. From cyber defense to autonomous weapons, government funding ensures that AI development is not just corporate-driven but also geopolitically critical.
Together, these factors explain why AI has become the magnet pulling technology stocks to new heights.
Major Players in AI & Their Stock Market Influence
The AI boom isn’t evenly distributed—some companies are clear winners. Let’s explore the big players:
1. Big Tech Giants
Microsoft (MSFT): Perhaps the biggest early winner of the AI boom. Its $10B investment in OpenAI made it the first mover. AI features have been embedded into Office, Bing, and Azure Cloud, boosting its value proposition.
Alphabet (GOOGL): Google was an AI pioneer, but it was caught off guard by ChatGPT’s viral success. Since then, it has rolled out Gemini AI and integrated AI into search, YouTube, and cloud services. Its stock continues to ride AI momentum.
Amazon (AMZN): Amazon leverages AI in logistics, Alexa voice assistant, and especially AWS, which powers thousands of AI startups. It’s a hidden but major player.
Apple (AAPL): Apple has been quieter, focusing on on-device AI for iPhones, privacy-focused AI features, and health tech. However, its loyal ecosystem means AI adoption can be rapid when rolled out.
Meta (META): Despite losing billions on its metaverse project, Meta has refocused on AI, using it to improve ads, recommendation engines, and VR/AR devices.
2. AI Chipmakers
NVIDIA (NVDA): The ultimate AI stock. Its GPUs power almost every AI model. In 2023–24, its stock skyrocketed as demand outstripped supply. NVIDIA became the symbol of the AI boom.
AMD (AMD): The challenger to NVIDIA, developing AI chips that are gaining traction. It benefits from diversification across gaming, servers, and AI.
Intel (INTC): Once the king of chips, Intel has lagged in AI but is making aggressive moves to catch up with new AI accelerators.
3. Cloud & SaaS Companies
AI needs infrastructure. That’s why cloud providers (AWS, Azure, Google Cloud) and SaaS companies offering AI-enhanced services (Salesforce, Adobe, ServiceNow) are riding the wave.
4. Emerging AI Startups & IPOs
Just as the dot-com era produced new giants, the AI boom is giving rise to startups that may IPO in coming years—like Anthropic, OpenAI, Hugging Face, and Databricks.
AI’s Impact Across Sectors
The beauty of AI is that it’s not confined to “tech.” It’s transforming every sector:
Healthcare: AI helps discover drugs faster, read medical scans more accurately, and personalize treatments. Companies like Moderna and Pfizer are using AI in R&D.
Finance: AI algorithms drive algorithmic trading, fraud detection, and customer support chatbots. Fintech stocks are adopting AI at scale.
Manufacturing: Robotics powered by AI improve efficiency, predictive maintenance, and supply chain optimization.
Education: Personalized learning platforms powered by AI are reshaping how students learn.
Defense & Cybersecurity: Governments see AI as a weapon and shield. Palantir, Lockheed Martin, and defense tech firms integrate AI heavily.
Opportunities for Retail & Institutional Investors
For investors, the AI boom presents opportunities:
Blue-chip AI Leaders: Microsoft, NVIDIA, Google—these are relatively safer bets for long-term investors.
AI Infrastructure: Cloud computing, chipmakers, data storage companies.
Sector ETFs: Funds like Global X Robotics & AI ETF (BOTZ) or ARK Autonomous Tech & Robotics ETF (ARKQ) give diversified exposure.
SMEs & IPOs: Risky but rewarding. Spotting the next “Amazon of AI” early can be life-changing.
Picks & Shovels Strategy: Instead of betting on end-products, invest in those who provide tools and infrastructure for AI (like semiconductors, cloud).
Future Outlook: AI, Quantum, and Beyond
Looking ahead, AI will evolve alongside other emerging technologies:
Quantum Computing + AI: Could exponentially increase computational power, accelerating breakthroughs.
AI in Everyday Devices: From cars to refrigerators, AI will be embedded everywhere.
Human-AI Collaboration: Workplaces will shift to hybrid models where humans handle creativity and ethics while AI manages data-heavy tasks.
Global Competition: The AI race between the U.S., China, and Europe will shape global power dynamics and, in turn, stock markets.
The AI boom is not a short-term trend—it’s a multi-decade megatrend, much like the internet.
Conclusion: Technology Stocks in the Age of AI
We are standing at the beginning of a new technological era. Technology stocks, once driven by internet adoption and cloud computing, are now being reshaped by AI. From NVIDIA’s chips powering massive AI models to Microsoft embedding AI into productivity tools, the shift is undeniable.
The AI boom is both a gold rush and a landmine field. The opportunity to create wealth is real, but so are the risks of speculation and overvaluation. Just as the dot-com crash wiped out many but birthed trillion-dollar companies, the AI wave will reward those who choose wisely.
In short, the future of technology stocks is inseparable from AI. Investors who balance optimism with caution, innovation with valuation, and hype with fundamentals will be the true winners in this new era.

Rise of Emerging Market Economies1. Defining Emerging Market Economies
The term “emerging market” was popularized in the 1980s by Antoine van Agtmael of the International Finance Corporation (IFC). It referred to economies that were transitioning from developing status toward greater industrialization, integration with global markets, and higher living standards.
Key characteristics of emerging market economies include:
Rapid GDP growth compared to developed nations.
Industrialization and urbanization, with a shift from agriculture to manufacturing and services.
Integration into global trade and finance, often as export powerhouses.
Rising middle classes with growing purchasing power.
Institutional reforms such as liberalization, privatization, and market-oriented policies.
Volatility and vulnerability, due to weaker institutions, dependence on foreign capital, or commodity price cycles.
Organizations such as MSCI, IMF, and World Bank classify emerging markets differently, but the major ones usually include China, India, Brazil, Russia, Mexico, Indonesia, South Korea, Turkey, Saudi Arabia, South Africa, and Poland.
2. Historical Background: The Shift from West to East and South
The rise of EMEs must be understood against the backdrop of post-World War II economic history.
1945–1970: Developed World Dominance
The U.S., Western Europe, and Japan led global production.
Developing nations remained primarily commodity exporters.
1970s–1980s: Debt Crisis and Structural Adjustment
Many developing countries borrowed heavily during oil booms.
The 1980s debt crisis (Latin America, Africa) forced IMF-led structural reforms.
1990s: Liberalization and Global Integration
Collapse of the Soviet Union opened up Eastern Europe.
India liberalized its economy in 1991.
China deepened reforms under Deng Xiaoping, creating Special Economic Zones.
Capital markets opened up, allowing global investors to access EMEs.
2000s: The Emerging Market Boom
China’s WTO entry (2001) accelerated global trade.
Commodity supercycle (oil, metals, agricultural products) fueled growth in Brazil, Russia, South Africa, and Middle Eastern economies.
The acronym BRIC (Brazil, Russia, India, China) gained global attention.
2010s–Present: Consolidation and Diversification
China became the world’s second-largest economy.
India emerged as a digital and service hub.
EMEs accounted for two-thirds of global growth post-2008 financial crisis.
New clusters such as MINT (Mexico, Indonesia, Nigeria, Turkey) and Next Eleven gained traction.
3. Drivers Behind the Rise of Emerging Market Economies
3.1 Demographics and Labor Force Advantage
EMEs often have younger populations compared to aging developed nations.
India’s median age (28) contrasts with Europe (43) or Japan (49).
Large, affordable workforces attracted global manufacturing.
3.2 Market Reforms and Liberalization
Privatization of state enterprises.
Reduction in trade barriers and tariffs.
Adoption of free-market policies encouraged FDI.
3.3 Globalization and Technology
Outsourcing, offshoring, and global value chains benefited EMEs.
ICT revolution allowed countries like India to export software services.
Internet penetration spurred innovation in fintech, e-commerce, and mobile banking.
3.4 Commodity and Resource Wealth
Oil exporters (Saudi Arabia, Russia, Nigeria) enjoyed windfalls during price booms.
Brazil and South Africa leveraged agricultural and mineral resources.
3.5 Rising Middle Class and Domestic Consumption
EMEs are not just export hubs; they are huge consumer markets.
China’s middle class (over 400 million people) drives global demand for cars, electronics, and luxury goods.
3.6 Strategic Government Policies
Industrial policies, subsidies, and infrastructure development.
China’s “Made in China 2025” and India’s “Make in India” exemplify targeted growth.
4. Emerging Markets in Global Trade
Emerging markets have transformed global trade patterns.
China is the world’s largest exporter, dominating electronics, machinery, and textiles.
India has become a service export leader in IT, pharmaceuticals, and business outsourcing.
Brazil exports soybeans, iron ore, and beef to global markets.
Vietnam and Bangladesh are leading textile exporters.
Global Supply Chains:
EMEs play a critical role in global value chains. For example, iPhones are designed in the U.S. but assembled in China using parts from multiple EMEs.
Regional Trade Blocs:
ASEAN, MERCOSUR, African Continental Free Trade Area (AfCFTA) are integrating EMEs into powerful trading networks.
5. Emerging Markets in Global Finance
EMEs attract foreign direct investment (FDI) for infrastructure and manufacturing.
Their stock markets, like Shanghai, Mumbai, São Paulo, and Johannesburg, are increasingly important for global investors.
Sovereign wealth funds from EMEs (e.g., Saudi Arabia’s PIF, Singapore’s GIC) are influential global investors.
EMEs have also become sources of outward FDI. Chinese firms, for example, are acquiring companies worldwide.
Challenges:
Vulnerability to capital flight during global crises.
Currency volatility (e.g., Turkish lira, Argentine peso).
Reliance on external financing makes them sensitive to U.S. Federal Reserve interest rate hikes.
6. Challenges Facing Emerging Market Economies
Despite rapid growth, EMEs face structural and cyclical challenges:
Inequality and Poverty
Growth often uneven, creating income gaps.
Dependence on Commodities
Resource-dependent economies suffer during price crashes.
Political and Institutional Weaknesses
Corruption, weak rule of law, and unstable governance reduce investor confidence.
External Vulnerabilities
Dependence on foreign capital and exposure to global shocks (2008 crisis, COVID-19).
Debt Burden
Rising sovereign and corporate debt, especially in Africa and Latin America.
Environmental Pressures
Rapid industrialization leads to pollution, deforestation, and climate risks.
7. Geopolitical Implications
The rise of EMEs has reshaped global geopolitics:
Shift of Power Eastward: China challenges U.S. economic dominance.
New Institutions: BRICS Bank (New Development Bank), Asian Infrastructure Investment Bank (AIIB) provide alternatives to IMF/World Bank.
South–South Cooperation: Trade and investment flows among EMEs (China–Africa, India–ASEAN).
Geopolitical Rivalries: U.S.–China trade war, Russia–West conflicts.
8. Future Outlook
The future of emerging markets will be shaped by several trends:
Digital Transformation: AI, fintech, e-commerce, and Industry 4.0.
Green Growth: Transition to renewables and sustainable models.
Multipolar World Order: EMEs will demand greater voice in institutions like IMF, WTO, UN.
Resilient Supply Chains: Diversification away from China benefits India, Vietnam, and Mexico.
Urbanization: More mega-cities, infrastructure needs, and consumer demand.
If EMEs can overcome inequality, governance, and sustainability challenges, they will be the central drivers of the 21st-century global economy.
Conclusion
The rise of emerging market economies marks one of the most significant shifts in modern economic history. From being marginalized as poor, unstable, or commodity-dependent nations, they have emerged as engines of global growth, innovation, and consumption. Their contribution to global GDP, trade, and finance has redefined economic geography.
Yet, the journey is complex. EMEs remain vulnerable to external shocks, political instability, and environmental challenges. The next phase of their growth will depend on inclusive policies, sustainable development, technological adoption, and institutional strength.
As the world moves toward a multipolar order, emerging markets are no longer just “catching up”; they are shaping the rules, institutions, and direction of the global economy. Their rise is not only an economic story — it is a story of ambition, resilience, and transformation that will define the future of globalization.

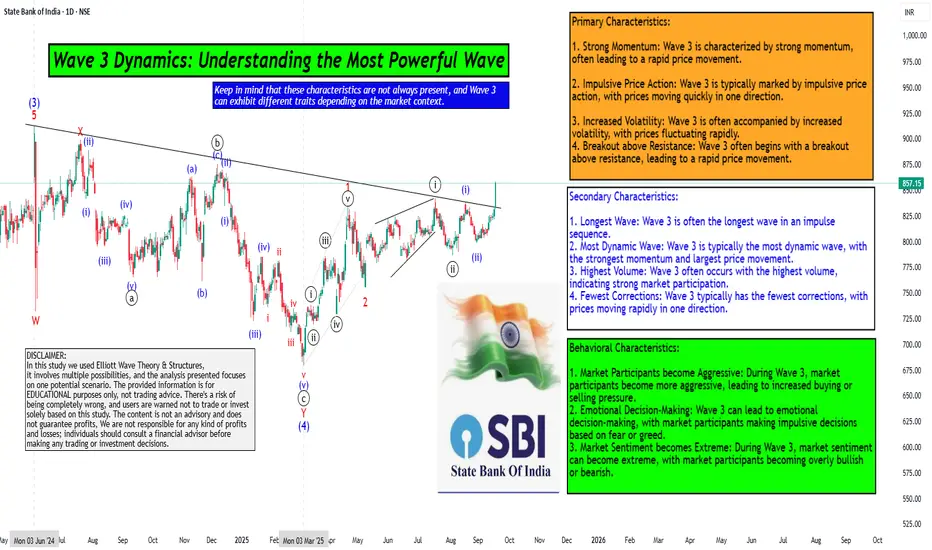
Wave 3 Dynamics: Understanding the Most Powerful WaveHello Friends, Welcome to RK_Chaarts,
For Learning and Practicing chart Analyzing, Today we are trying to Analyse the State Bank of India (SBIN) chart from an Elliott Wave perspective, we can see that the intermediate-degree Wave (3) completed at the June 2024 high. This was followed by a complex correction that ended at the March 2025 low, marking the completion of Wave (4).
We are currently unfolding Wave (5), which will complete the higher-degree Wave ((3)) of Primary degree in black. Within Wave (5), we have five minor-degree subdivisions, which we can see unfolding.
The first minor-degree Wave 1 completed at the 22nd April 2025 high, followed by a Wave 2 correction that ended at the May 9, 2025 low. We are currently in Wave 3, which is a dynamic wave with strong momentum.
Within Wave 3, we have five minute-degree subdivisions, which are unfolding. The first two subdivisions are complete, and we are currently in the third subdivision.
The characteristics of Wave ((iii)) of 3 are evident in the price action, with a strong breakout above the resistance trend line and good intensity of volumes. The Moving Convergence Divergence (MACD) is also positive, and the Relative Strength Index (RSI) is above 60, indicating strong momentum.
The daily Exponential moving averages (50 and 200) are also aligned in favor of the trend. All these parameters support our view, and we can see an inverted head-and-shoulders pattern or a double rounding bottom pattern unfolding.
Overall, the breakout looks promising, and we can expect further upside in SBIN as per Elliott wave theory.
Detailed wave counts on chart
Primary Characteristics:
1. Strong Momentum: Wave 3 is characterized by strong momentum, often leading to a rapid price movement.
2. Impulsive Price Action: Wave 3 is typically marked by impulsive price action, with prices moving quickly in one direction.
3. Increased Volatility: Wave 3 is often accompanied by increased volatility, with prices fluctuating rapidly.
4. Breakout above Resistance: Wave 3 often begins with a breakout above resistance, leading to a rapid price movement.
Secondary Characteristics:
1. Longest Wave: Wave 3 is often the longest wave in an impulse sequence.
2. Most Dynamic Wave: Wave 3 is typically the most dynamic wave, with the strongest momentum and largest price movement.
3. Highest Volume: Wave 3 often occurs with the highest volume, indicating strong market participation.
4. Fewest Corrections: Wave 3 typically has the fewest corrections, with prices moving rapidly in one direction.
Behavioral Characteristics:
1. Market Participants become Aggressive: During Wave 3, market participants become more aggressive, leading to increased buying or selling pressure.
2. Emotional Decision-Making: Wave 3 can lead to emotional decision-making, with market participants making impulsive decisions based on fear or greed.
3. Market Sentiment becomes Extreme: During Wave 3, market sentiment can become extreme, with market participants becoming overly bullish or bearish.
Keep in mind that these characteristics are not always present, and Wave 3 can exhibit different traits depending on the market context.
Here are some snapshots shared below to understand the concept & example
Largest wave among wave 1-3-5
Strong Momentum like 90 degree move, Vertical move, Rapid move & Dynamic move
Breakout with good volumes
Price trading above 50, 100 & 200 Day Exponential Moving Average
RSI Breakout on Daily
RSI Breakout on Weekly
MACD weekly
MACD Daily
Pattern Repeating
I am not Sebi registered analyst. My studies are for educational purpose only.
Please Consult your financial advisor before trading or investing.
I am not responsible for any kinds of your profits and your losses.
Most investors treat trading as a hobby because they have a full-time job doing something else.
However, If you treat trading like a business, it will pay you like a business.
If you treat like a hobby, hobbies don't pay, they cost you...!
Hope this post is helpful to community
Thanks
RK💕
Disclaimer and Risk Warning.
The analysis and discussion provided on in.tradingview.com is intended for educational purposes only and should not be relied upon for trading decisions. RK_Chaarts is not an investment adviser and the information provided here should not be taken as professional investment advice. Before buying or selling any investments, securities, or precious metals, it is recommended that you conduct your own due diligence. RK_Chaarts does not share in your profits and will not take responsibility for any losses you may incur. So Please Consult your financial advisor before trading or investing.
Exit Psychology 1/5 : The Initial StopNOTE – This is a post on Mindset and emotion. It is NOT a Trade idea or strategy designed to make you money. If anything, I’m taking the time here to post as an effort to help you preserve your capital, energy and will so that you are able to execute your own trading system as best you can from a place of calm, patience and confidence.
This 5-part series on the psychology of exits is inspired by TradingView’s recent post “The Stop-Loss Dilemma.” Link to the original post at the end of this article.
Here’s a scenario:
You set a clean initial stop beneath structure. Price drives down, tags just above it, hesitates… Your chest tightens. Thoughts race: “It’s just noise… give it room.” You widen it. Minutes later you’re out with a larger loss, shaken confidence and a strong urge to make it back.
How behaviour shows up with initial/safety stops:
When discomfort builds, many traders start negotiating with themselves. This often leads to small adjustments that feel harmless in the moment, but gradually undermine the original plan:
Widening the stop as price approaches (turning limited risk into larger or open-ended risk).
Nudging to break-even too soon (seeking relief more than edge).
Cancelling the hard stop and promising a “mental stop” (self-negotiation begins).
When traders choose not to place hard stops:
Not every trader chooses to place a hard stop in the market. For some, it’s a deliberate decision, part of their style:
They want to avoid being caught in stop-hunts around key levels.
They prefer to manage risk manually, based on discretion and market feel.
They use options, hedges, or smaller size as protection instead of stops.
They accept gap/slippage risk as part of their style.
These can all be valid approaches. But avoiding a fixed stop doesn’t remove the psychological pressures it simply shifts them:
Discipline under stress : Without an automatic exit, you rely entirely on your ability to act quickly and decisively in real time. Stress can delay action.
Mental drift : A “mental stop” is easy to move when pressure builds. The more you rationalize, the further you drift from your plan.
Cognitive load : Constant monitoring and decision-making can create fatigue and reduce clarity.
Risk of paralysis : In fast markets, hesitation or second-guessing can lead to missed exits or larger losses.
What’s really underneath (the psychology-layer):
So why do these patterns repeat, regardless of style? It’s rarely about the chart itself. It’s about how the human mind responds to risk and uncertainty:
Loss aversion : Losses hurt ~2x more than equivalent gains feel good which leads to an impulse to delay the loss (widen/erase stop).
Regret aversion : After a few “wick-outs,” the mind protects against future regret by avoiding hard stops or going break-even too early.
Ego/identity fusion : “Being wrong” feels like I am wrong and then to protect self-image one moves the line.
Illusion of control : Tweaking the stop restores a feeling of agency, even if it reduces expectancy.
Sunk-cost & escalation : More time/analysis invested makes it that much harder to cut.
Time inconsistency : You planned rationally; you execute emotionally in the moment (state shift under stress).
Physiology : Stress narrows perception (tunnel vision, shallow breath, tight jaw), pushing short-term relief behaviors over long-term edge.
Reframe:
The initial stop isn’t a judgment on you. It’s a premeditated boundary that keeps one trade from becoming a career event. It’s not about being right; it’s about staying solvent long enough to let your edge express itself.
Practical tips … the How:
Turning insight into action requires structure. A few ways to anchor the stop as your ally, not your enemy:
Pre-commit in writing : “If price prints X, I’m out. No edits.” Put it on the chart before entry.
Size from the stop, not the other way around : Position size = Risk per trade / Stop distance. If the size feels scary, the size is wrong, not the stop. Do not risk what you can not afford on any one trade / series of trades.
Use bracket/OCO orders to reduce in-the-moment negotiation. If you insist on mental stops, pair them with a disaster hard stop far away for tail risk.
Tag the behaviour : In your journal, checkbox: “Did I move/delete the stop? Y/N.” Review weekly; if you track the behaviour consciously you will be more likely to respect your stops.
Counter-regret protocol : After a stop-out, don’t chase a re-entry for 15 minutes. Breathe, review plan, then act.
For those that choose not to place stops in the market, but use mental stops instead, I’d offer the following thoughts to help manage the shift from automation to discipline.
Define exit conditions before entry (levels, signals, timeframes) and write them down.
Pair mental stops with “disaster stops” in the system, far enough away to only trigger in extreme cases.
Size positions conservatively so you can tolerate wider swings without emotional hijack.
Use check-ins (timers, alerts) to prevent emotional drift during the trade.
Build routines that reduce decision fatigue so you can act clearly when the market turns.
Closing thought:
A stop isn’t a punishment; it’s tuition. Pay small, learn quickly and keep your psychological capital intact for the next high-quality decision. One of my favourite sayings told to me by a trader many years ago stands true even to this day. Respect your capital and ‘live to trade another day’.
This is Part 1 of the Exit Psychology series .
👉 Follow and stay tuned for Part 2: The Break-Even Stop - Comfort or Illusion?
A link to the original article as promised:

Moving Average IndicatorSnapshot of the signals provided by moving averages and the different types that can be used.

How to Use Fibonacci Levels in Gold Trading. Best Ratios For XAU
I will teach you a simple but efficient way of using Fibonacci levels for Gold analysis.
You will learn the strongest Fib.retracement levels and a proven strategy for XAUUSD trading.
First, let me show you the most powerful Fibonacci retracement levels that you should use for trading Gold.
The most significant ones are: 382, 50, 618, 786.
To use these Fib.Retracement levels properly, you will need to find the strongest 3 impulse legs.
Please, note that you can execute Fibonacci analysis of Gold on any time frame, for the sake of the example, we will do that on a daily.
Here are 3 impulses that I found.
I was simply trying to identify the price waves with the strongest impact. I underlined them from their lows to their highs.
We will draw Fibonacci Retracement levels based on these 3 movements.
We plot Fib.Retracement of a bullish impulse from its low to its high.
We plot Fib.Retracement of a bearish impulse from its high to its low.
That is how it looks.
After that we will need to find a confluence - zones or levels where Fib.Retracement levels of different impulses match .
Such zones will be significant liquidity clusters where market participants will place huge volumes of trading orders.
The first 2 confluence zones that I spotted on a Gold chart will be specific. They are based on 1 and 0 Fib.Retracement levels that match.
These 2 areas are both completion and starting points of our impulse legs.
The fact that significant price movements completed and started after tests of these zones indicates their significance .
Confluence zones 3/4/5/6 are based on a convergence of at least 2 Fib.Retracement levels of different impulses.
Probabilities will be high that these zones will attract the market liquidity.
After we found all confluence zones, I recommend removing Fibonacci levels from the chart to keep it clean .
That is how our complete Fib.Analysis will look.
From these zones, we will look for trading opportunities.
The areas that are above current price levels will be significant supply areas , and we will look for sell signals from them.
The zones that are below Gold spot price will be demand areas. Chances will be high that a strong buying reaction will follow after their test.
Confluence zones that we spotted on Gold chart provide unique perspective. Integrating them in your XAUUSD analysis, you will increase the accuracy of your predictions and trading decisions.
❤️Please, support my work with like, thank you!❤️
I am part of Trade Nation's Influencer program and receive a monthly fee for using their TradingView charts in my analysis.
Central bank week ahead!Central bank week ahead! We've got interest rate decisions out from the Bank of Canada, FED, Bank of England and Bank of Japan.
BoC 17/09 - 25bps cut 94% - First on the chopping board is the BoC who are set to reduce interest rates by 0.25%. This comes amid steady inflation, holding below the 2% target and below recent expectations for an increase, currently at 1.9%. They've also seen unemployment rising to 7.1%, the highest level since 2021. The BoC has acknowledged the weakening labour market but are expected to follow a wait and see approach after todays cut. Current rates 2.75%
FED 17/09 - 25bps cut 98% - The FED's first rate decision after some very rocky labour market data and a surprise dovish tilt from Powell at Jackson Hole. Inflation remains sticky but the FED has stated that their current focus is set on labour market weakness. As well as the rates, we will also receive updated economic and interest rate projections, likely to carry much more weighting and longer term direction. In the economic projections we'll be looking out for the dot plot, GDP, employment and inflation to gauge future expectations for FED rates. This could undermine or support the rate cuts to trade with caution. Current rates 4.25-4.50%
BoE 18/09 - HOLD 100% - The BoE is set to hold rates steady at 4.00% amid elevated inflation data and recently positive labour market data. Inflation data came in lower than consensus earlier this week but still remains well above target at 3.8%. In the previous BoE meeting we saw a surprise hawkish tilt in the way of MPC voting.
2 members shifted from voting to cut to voting for a hold and the scales are expected to remain fairly heavy on the hold side tomorrow. The member voting and minutes will provide much needed context to the potential hold to come. Current rates 4.00%
BoJ 19/09 - HOLD 87% - Rounding a busy week off with the BoJ who is set to hold rates at 0.50%. There has been some hawkish comments from the BoJ in recent times as inflation holds around 3.1% and unemployment recovers from 2.5% to 2.3% but amid political turbulence a bold move from the BoJ in this decision is less likely. However the other potential would be for a surprise rate hike with a current probability of 11%. The BoJ is no stranger to surprises so will be looking out for any action or comments made to support future JPY strength or weakness. Current rates 0.50%
These fresh rates provide the opportunity for divergences between monetary policy. This could park the continuation higher for pairs such as EURUSD and GBPUSD if the fed sticks to a more dovish tilt and supports this in their economic projections.
Other currency pairs such as AUDCAD and AUDNZD provide some clear divergence with the RBA holding higher rates and the BoC and RBNZ cutting with lower rates. Any clear pullbacks within these assets could provide opportunity to get long and hold through for a bigger move

Every counter has a sweet spot. Every counter has a sweet spot. The only question: are you trading it at the right time?
Most traders obsess over what to trade, but few stop to ask when to trade it.
Timing is the difference between a setup that compounds consistently… and one that bleeds capital.
That’s exactly why I built thenexxtradealpha — Adaptive Opening Framework.
It’s designed to identify the optimal timeframe for any counter, so you’re not second-guessing whether you should be looking at the 5-minute, 15-minute, or daily chart.
The framework adapts to the counter itself — helping you trade in alignment with its natural rhythm, not against it.
Because once you know the right time, you stop forcing trades…
And start trading with precision.
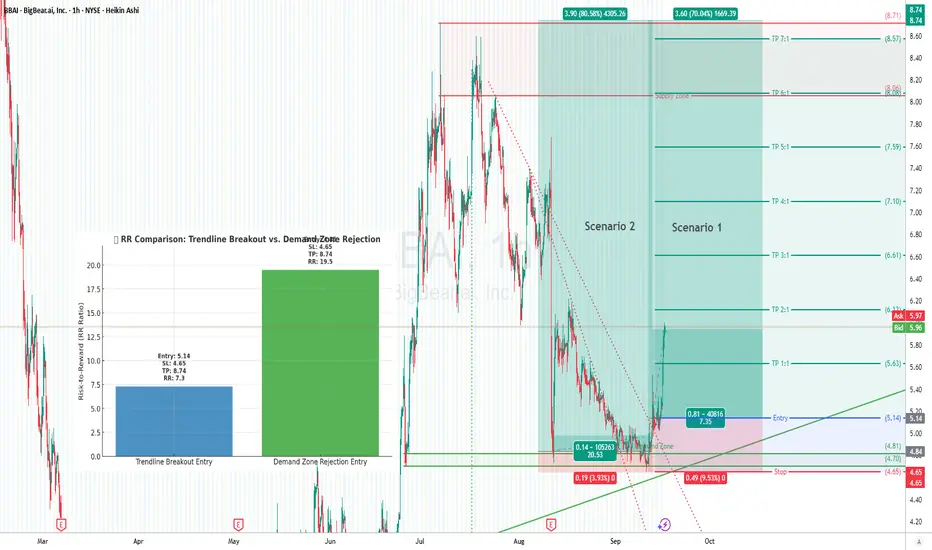
Demand Zone Rejection vs. Trendline Breakout📚 Trading Education:
Demand Zone Rejection vs. Trendline Breakout Entries
In trading, where you enter makes a massive difference in your Risk-to-Reward (RR) ratio. Two common approaches:
🔹 Scenario 1: Entry at the Trendline Breakout
Wait for confirmation → price breaks the downtrend line.
Entry: $5.14
Stop Loss: $4.65 (below demand)
Risk: 0.49
Target: $8.74
Reward: 3.60
RR = ~1:7.3
✅ Higher probability (confirmation from breakout).
❌ Smaller RR because you’re entering later.
🔹 Scenario 2: Entry at the Demand Zone Rejection
Enter aggressively on the first demand zone bounce.
Entry: $4.85
Stop Loss: $4.65
Risk: 0.20
Target: $3.90 upside → $8.74
Reward: 3.90
RR = ~1:19.5
✅ Insane RR potential.
❌ Higher risk of fakeouts (price might pierce deeper before breakout).
The Takeaway
Breakout Entry = safer, confirmed, good RR (~1:7).
Demand Rejection Entry = aggressive, riskier, but monster RR (~1:19).
👉 The best traders scale in: small position at demand, add on breakout. That way you capture the high RR edge while also waiting for confirmation.
⚖️ Risk Management Rule
Always risk just 1–3% of account equity.
Huge RR setups don’t mean overleveraging — stick to risk discipline.
"Opportunities come infrequently. When it rains gold, put out the bucket, not the thimble." – Warren Buffett
Global Recession & Its Impact on Stock Markets1. Introduction
A recession is like a pause button in the economy. It’s a period when growth slows, businesses struggle, unemployment rises, and people cut back on spending. When this happens on a global scale, it’s called a global recession. Such downturns don’t just affect jobs and incomes; they ripple through financial markets, especially stock markets.
Stock markets are sensitive because they reflect future expectations. When investors sense trouble ahead—lower profits, declining consumer demand, tightening credit—they react quickly, often leading to steep market declines. But history also shows that recessions, though painful, open doors to opportunities.
This article explores how global recessions shape stock markets, looking at causes, impacts, sector-wise dynamics, investor psychology, and strategies for navigating downturns.
2. Understanding Global Recession
A global recession occurs when the world economy, measured by international organizations like the IMF or World Bank, faces widespread decline. Typically, it is defined by:
A fall in global GDP growth below 2.5%.
Significant declines in industrial production, trade, and employment.
Synchronized slowdowns across multiple major economies.
Unlike local recessions, which affect only one country, global recessions hit supply chains, trade flows, commodity prices, and investments worldwide.
3. Causes of Global Recessions
Several factors trigger global recessions:
Financial Crises – Banking collapses, credit crunches, or housing bubbles (e.g., 2008 subprime crisis).
Geopolitical Tensions – Wars, sanctions, or political instability disrupting global trade.
Energy Shocks – Surging oil prices in the 1970s led to worldwide stagflation.
Pandemics – COVID-19 in 2020 shut down global economies almost overnight.
Monetary Tightening – Central banks raising interest rates aggressively to fight inflation.
Trade Wars – Tariffs and protectionism disrupting supply chains.
Most recessions are a mix of these factors, magnified by globalization.
4. Historical Lessons
a) The Great Depression (1929–1939)
Triggered by the U.S. stock market crash of 1929.
Global trade collapsed by 65%.
Unemployment soared, banks failed, and stock markets lost 80–90% of value.
Lesson: Over-leveraged financial systems and lack of government intervention deepen downturns.
b) The Global Financial Crisis (2008)
Rooted in the U.S. housing bubble and subprime mortgage lending.
Major banks collapsed (Lehman Brothers), requiring government bailouts.
Stock markets worldwide fell 40–60%.
Lesson: Global financial systems are interconnected; one country’s banking crisis spreads rapidly.
c) COVID-19 Pandemic (2020)
Global lockdowns disrupted supply chains, travel, and production.
Stock markets crashed sharply in March 2020, but stimulus packages led to a record rebound.
Lesson: Policy response (fiscal + monetary) can shape recovery speed.
5. How Recessions Affect Stock Markets
Stock markets respond to future expectations more than current conditions. Recessions affect them through:
Corporate Earnings Decline – Consumers spend less → companies earn less → stock valuations drop.
Credit Crunch – Higher borrowing costs and limited liquidity hurt expansion plans.
Investor Sentiment – Fear leads to panic selling, driving down prices.
Capital Flight – Investors move from stocks to safer assets like gold, bonds, or the U.S. dollar.
Increased Volatility – Markets swing sharply due to uncertainty.
6. Short-Term vs Long-Term Market Effects
Short-Term: Sharp selloffs, extreme volatility, sector-wide declines.
Medium-Term: Recovery in defensive sectors (healthcare, utilities), while cyclical sectors lag.
Long-Term: Markets tend to recover and surpass previous highs, rewarding patient investors.
Example: Despite the 2008 crash, U.S. stock markets (S&P 500) hit all-time highs within a decade.
7. Sector-Wise Impact
Technology: Often resilient but still hit by lower consumer spending.
Energy: Oil demand falls → energy stocks decline.
Financials: Banks suffer from loan defaults and liquidity crises.
Consumer Goods: Luxury items fall; essentials stay strong.
Healthcare & Pharma: Usually defensive, often outperform.
Utilities: Stable demand makes them safe havens.
Real Estate: Highly vulnerable due to lower demand and credit tightening.
8. Emerging vs Developed Markets
Developed Markets (U.S., EU, Japan): More resilient, backed by strong institutions and central banks.
Emerging Markets (India, Brazil, South Africa): More vulnerable due to capital flight, weaker currencies, and dependence on exports.
However, emerging markets often rebound faster because of younger populations and growth potential.
Strategies for Investors During Recessions
Diversification: Spread risk across asset classes.
Focus on Defensive Sectors: Healthcare, FMCG, utilities.
Value Investing: Buy fundamentally strong companies at discounted prices.
Dividend Stocks: Provide stable income during downturns.
Cash Reserves: Keep liquidity to grab opportunities.
Avoid Over-Leverage: Debt magnifies risks during downturns.
Long-Term View: History shows markets always recover.
Future Outlook
The world today faces challenges like:
High global debt levels.
Climate change and energy transition.
Geopolitical tensions (U.S.–China, Russia–Ukraine).
Rising automation and AI disruptions.
Future recessions may arrive faster due to global integration, but recoveries may also be quicker thanks to technological advancements and proactive policies.
Conclusion
A global recession shakes the foundation of stock markets, causing panic, volatility, and steep declines. Yet, for disciplined investors, it also provides opportunities to buy strong companies at bargain prices.
Stock markets are forward-looking: while economies may take years to heal, markets often rebound much earlier, anticipating recovery.
The key lesson? Recessions are temporary, but the market’s upward journey is long-term. Investors who stay patient, diversified, and strategic emerge stronger after every global downturn.
THE ROLE OF EMOTION IN TRADINGThe Role of Emotion in Trading
Trading in the forex market is not only a test of analytical skill but also a battle of emotional control. While charts, strategies, and indicators provide logical frameworks, emotions influence decision-making at every step. Understanding how emotions impact trading is crucial for long-term success.
1. Why Emotions Matter in Trading
Trading involves risk and uncertainty, which naturally triggers emotional reactions. Unlike regular jobs with predictable outcomes, forex trades have probabilistic results, creating anxiety and excitement. Traders often lose money not because of poor strategy, but because emotions override discipline.
2. Key Emotions in Trading
Fear
Fear of losing leads to hesitation and missing good opportunities.
Fear of giving back profits can cause premature exits.
In extreme cases, fear results in paralysis – avoiding trades altogether.
Greed
Encourages traders to over-leverage or chase unrealistic profits.
Leads to holding positions too long, ignoring exit signals.
Often results in big drawdowns after a few winning trades.
Hope
Keeps traders stuck in losing positions, expecting a reversal.
Prevents acceptance of small losses, which then grow larger.
Creates a “gambling mindset” where traders trade on wishes, not logic.
Regret
Regret from missed opportunities creates frustration and overtrading.
Regret from losses encourages revenge trading – trying to win back money quickly.
Constant regret damages confidence and decision-making ability.
3. How Emotions Affect Trading Behavior
1. Overtrading – entering too many trades due to excitement or FOMO.
2. Breaking Trading Rules – abandoning plans under emotional pressure.
3. Poor Risk Management – risking too much out of greed or desperation.
4. Inconsistent Decisions – switching strategies mid-trade.
5. Mental Burnout – constant stress leading to fatigue and irrational actions.
4. Managing Emotions in Trading
Have a Trading Plan : Clear entry, exit, and risk rules reduce emotional decisions.
Use Risk Management : Risking only a small percentage per trade prevents fear-driven panic.
Keep a Trading Journal : Track emotional triggers, wins, and losses to learn patterns.
Practice Patience : Not every market condition requires action.
Detach from Money : View trading as probability, not personal validation.
Take Breaks : Step away after a big loss or win to reset emotions.
5. Professional Trader’s Emotional Discipline
Professionals treat trading as a business, not a lottery.
They know losses are part of the game and do not personalize failure.
They focus on long-term consistency, not individual trades.
By controlling emotions, they turn volatility into opportunity, while amateurs let volatility control them.
6. Conclusion
Emotions are inseparable from trading. Fear, greed, hope, and regret will always surface, but the difference between successful and unsuccessful traders lies in how they manage them. Technical skills and strategies may open doors, but emotional discipline keeps a trader profitable in the long run.

Central Bank Digital Currencies (CBDCs) in World Trading Systems1. Understanding CBDCs
1.1 Definition
A Central Bank Digital Currency (CBDC) is a digital form of a country’s sovereign currency, issued and regulated by its central bank. Unlike bank deposits or private stablecoins, CBDCs are a direct liability of the central bank, making them risk-free in terms of credit and liquidity.
1.2 Types of CBDCs
CBDCs are broadly categorized into:
Retail CBDCs – Designed for everyday transactions by individuals and businesses, functioning like digital cash.
Wholesale CBDCs – Used by banks and financial institutions for interbank settlements, large-scale cross-border trade, and capital market operations.
For world trading systems, wholesale CBDCs are particularly relevant because they address cross-border settlement delays, currency risks, and high transaction costs.
2. Historical Context of Trade & Money
To understand how CBDCs might transform world trade, we need to briefly revisit the evolution of money and trading systems.
Gold & Silver Standard: Ancient trade relied on commodity money (gold, silver, copper), valued for scarcity and intrinsic worth.
Paper Money & Fiat Currencies: With modern nation-states, paper currency and fiat systems emerged, backed initially by gold (Bretton Woods, 1944) and later by trust in governments.
The Dollar Dominance: Post-1971, the US dollar became the world’s reserve currency, dominating global trade settlement, particularly in oil and commodities (Petrodollar system).
Digital Payments & Cryptocurrencies: In the 21st century, fintech innovation and blockchain technology challenged traditional banking, raising questions about efficiency, privacy, and sovereignty.
CBDCs represent the next evolutionary step—a blend of sovereign money and digital innovation—capable of transforming not only domestic payments but also cross-border trade systems.
3. CBDCs in Global Trade: Opportunities
3.1 Faster Cross-Border Settlements
Today, cross-border trade payments often take 2–5 days, relying on intermediaries, correspondent banks, and SWIFT messaging. With CBDCs, settlement can be instantaneous, reducing time and risk.
For example, a Chinese exporter selling goods to an African buyer could receive payment in digital yuan instantly, without waiting for dollar-clearing in New York.
3.2 Reduced Transaction Costs
International trade involves currency conversion, banking fees, and correspondent charges, which can add 3–7% to transaction costs. CBDCs, by enabling direct currency-to-currency exchange via digital platforms, could significantly lower costs.
3.3 Financial Inclusion in Trade
Many small and medium enterprises (SMEs), especially in developing economies, struggle with cross-border payments due to lack of banking access. CBDCs can democratize access, enabling SMEs to engage directly in global markets.
3.4 Bypassing SWIFT & Dollar Dependence
One of the most debated impacts of CBDCs is their potential to challenge US dollar hegemony. Currently, over 85% of global trade is invoiced in dollars or euros. CBDCs like the digital yuan (e-CNY) aim to provide an alternative, especially in Asia, Africa, and Belt and Road countries.
3.5 Programmable Money & Smart Contracts
CBDCs can be embedded with programmability, enabling conditional trade payments. For instance:
A CBDC transaction could release payment automatically once goods clear customs.
Smart contracts could enforce trade finance agreements, reducing fraud and disputes.
4. Key Global CBDC Experiments
4.1 China’s Digital Yuan (e-CNY)
The most advanced large-scale CBDC, piloted in over 25 cities.
Being tested in cross-border trade via Hong Kong, Singapore, and Belt and Road Initiative (BRI) partners.
Aims to internationalize the yuan and reduce dollar dependence.
4.2 India’s Digital Rupee
Introduced by the Reserve Bank of India (RBI) in 2022–23.
Wholesale pilot programs for interbank settlements.
Potentially useful for India’s high-volume trade with Asia, Africa, and the Middle East.
4.3 Europe’s Digital Euro
European Central Bank exploring a digital euro for retail and wholesale use.
Expected to strengthen eurozone trade settlement systems and reduce reliance on US intermediaries.
4.4 Project Dunbar & Project mBridge
Project Dunbar (BIS): A multi-CBDC platform involving Singapore, Australia, Malaysia, and South Africa.
Project mBridge: Collaboration between China, Thailand, UAE, and Hong Kong, enabling real-time cross-border CBDC payments.
These pilots suggest that CBDCs are moving beyond national borders into multilateral trade systems.
5. Implications for World Trading Systems
5.1 Geopolitical Shifts in Currency Power
CBDCs could accelerate the shift from unipolar dollar dominance to a multipolar currency order, where regional CBDCs (digital yuan, digital rupee, digital euro) coexist and compete.
5.2 Trade Alliances & CBDC Zones
Countries may form CBDC trading blocs, agreeing to settle in digital currencies instead of dollars. For example:
BRICS nations exploring a CBDC trade platform.
Gulf states considering digital settlements for oil exports.
5.3 Transparency vs. Privacy
CBDCs offer traceability, reducing trade-based money laundering and fraud. However, this raises concerns about state surveillance of international transactions.
5.4 Impact on SWIFT & Correspondent Banking
If CBDCs enable direct central bank-to-central bank settlement, traditional intermediaries like SWIFT and correspondent banks could lose relevance.
5.5 Exchange Rate Mechanisms
With real-time settlement, CBDCs may require new FX models, possibly leading to dynamic currency baskets for trade invoicing.
6. Challenges & Risks
6.1 Interoperability
For CBDCs to work in world trade, different national CBDCs must interact seamlessly. This requires standardized protocols and cross-border agreements.
6.2 Cybersecurity Threats
CBDCs, being digital, face risks of hacking, cyberwarfare, and systemic attacks, which could disrupt global trade.
6.3 Monetary Sovereignty Conflicts
If a foreign CBDC gains dominance in another country (e.g., digital yuan in Africa), it may undermine local monetary control.
6.4 Technological Divide
Advanced economies may adopt CBDCs faster, leaving developing nations behind, creating digital trade inequalities.
6.5 Political Resistance
The US, benefiting from dollar dominance, may resist widespread CBDC adoption in trade settlement. Sanctions, regulations, and political pressure could slow CBDC globalization.
Critical Perspectives
While CBDCs promise efficiency and inclusivity, critics warn that:
They may fragment global finance if each nation builds incompatible systems.
CBDCs could be used as tools of geopolitical influence, where powerful economies push their CBDCs onto weaker partners.
Privacy concerns and state control may reduce adoption in democratic societies.
Thus, the success of CBDCs in world trading systems depends not only on technology but also on trust, governance, and global cooperation.
Conclusion
Central Bank Digital Currencies are no longer theoretical—they are becoming reality. Their integration into world trading systems could redefine how goods, services, and capital move across borders. CBDCs promise faster, cheaper, and more inclusive trade settlements, reducing reliance on intermediaries and potentially reshaping global monetary power.
Yet, the transition is fraught with challenges: interoperability, cybersecurity, political resistance, and the risk of financial fragmentation. The future likely points to a multi-CBDC ecosystem, coordinated by international institutions, where nations balance efficiency with sovereignty.
In essence, CBDCs represent both a technological innovation and a geopolitical tool. Their impact on global trade will depend not just on design and adoption but on how nations choose to cooperate—or compete—within this new digital financial order.

International Payment Gateways1. Introduction
In today’s digital economy, global trade is no longer limited to large corporations. From small businesses to freelancers, millions of people engage in cross-border transactions every day. A consumer in India can order a gadget from the U.S., a freelancer in Africa can work for a client in Europe, and a retailer in Asia can sell to buyers worldwide. The lifeline that makes all this possible is the International Payment Gateway (IPG).
At its core, an international payment gateway is the digital bridge that securely facilitates financial transactions between buyers and sellers across borders. It ensures that when a customer pays in one country, the funds are processed, converted, and settled appropriately in the seller’s account, regardless of geographic location.
This article explores the concept of international payment gateways in detail—what they are, how they work, their benefits, challenges, and future outlook.
2. What is an International Payment Gateway?
An International Payment Gateway (IPG) is a technology platform that allows merchants and businesses to accept payments from customers around the world. It acts as a middleman between the merchant’s website (or app) and the bank or financial network that processes the payment.
Key Functions
Authorization – Verifies whether the customer has sufficient funds or credit.
Authentication – Confirms the legitimacy of the transaction and prevents fraud.
Processing – Transmits transaction details securely to banks or card networks.
Settlement – Transfers the funds to the merchant’s bank account.
Currency Conversion – Converts customer payments into the merchant’s preferred currency.
In simple words, a payment gateway is like a virtual cash register for online businesses, but with global reach.
3. Evolution of International Payment Gateways
The journey of payment gateways has evolved alongside the growth of e-commerce:
1990s – Early days of online shopping, simple credit card processors emerged.
2000s – Rise of PayPal and other digital wallets made cross-border payments easier.
2010s – Mobile payments, API-driven gateways (like Stripe), and global reach.
2020s and beyond – Blockchain-based solutions, AI-driven fraud prevention, and seamless multi-currency wallets dominate the market.
Today, gateways not only process payments but also provide fraud protection, analytics, compliance, and global settlement infrastructure.
4. How International Payment Gateways Work
Let’s simplify the complex flow of cross-border transactions into steps:
Step 1: Customer Initiates Payment
A customer selects a product/service and chooses a payment method (credit card, debit card, digital wallet, UPI, PayPal, etc.).
Step 2: Encryption
The gateway encrypts sensitive information (card details, banking info) to ensure security.
Step 3: Routing to Processor
The data is sent to the acquiring bank (merchant’s bank) via the gateway.
Step 4: Communication with Card Networks
The acquiring bank sends the request to the card network (Visa, Mastercard, Amex, etc.), which then routes it to the issuing bank (customer’s bank).
Step 5: Authorization
The issuing bank checks funds, fraud risks, and authenticity before approving or declining.
Step 6: Response Sent Back
The authorization result is sent back through the same chain—card network → acquiring bank → gateway → merchant website.
Step 7: Settlement
If approved, funds are deducted from the customer’s account, converted into the merchant’s currency if needed, and deposited into the merchant’s bank account (usually within a few days).
5. Features of International Payment Gateways
Modern international gateways offer a wide range of features:
Multi-Currency Support – Customers can pay in their own currency.
Multiple Payment Methods – Credit cards, debit cards, wallets, bank transfers, cryptocurrencies.
Fraud Prevention – AI-driven monitoring, 3D Secure authentication, tokenization.
Compliance – Adheres to PCI DSS (Payment Card Industry Data Security Standard) and regional regulations.
Recurring Billing – Useful for subscriptions and SaaS businesses.
Mobile Integration – Seamless payments on apps and mobile sites.
Analytics & Reporting – Insights into transactions, chargebacks, and customer behavior.
6. Types of International Payment Gateways
There are several categories of gateways based on their functionality and business models:
1. Hosted Gateways
Redirect customers to the gateway’s payment page (e.g., PayPal, Razorpay checkout).
Easy to integrate, but less control over user experience.
2. Integrated Gateways
Customers enter payment details directly on the merchant’s site.
Requires PCI compliance but offers better branding and user experience.
3. API-Based Gateways
Offer advanced flexibility, customization, and direct integration with apps/websites.
Examples: Stripe, Adyen.
4. Localized Gateways
Cater to regional markets with local currency and payment methods.
Example: Alipay (China), Paytm (India).
5. Cryptocurrency Gateways
Enable payments via Bitcoin, Ethereum, or stablecoins.
Examples: BitPay, CoinGate.
7. Major Players in the International Payment Gateway Industry
Some leading international payment gateways include:
PayPal – Global leader in cross-border digital wallets.
Stripe – Popular with startups and developers for API-based integration.
Adyen – Enterprise-focused, used by companies like Uber and Spotify.
Worldpay – Long-standing provider with global reach.
Authorize.Net – One of the earliest online payment gateways.
2Checkout (now Verifone) – Multi-currency global payments.
Alipay & WeChat Pay – Dominant in China.
Payoneer – Widely used for freelancer payments worldwide.
Razorpay, PayU, CCAvenue – Strong players in India.
8. Benefits of International Payment Gateways
For businesses and consumers, these gateways bring immense advantages:
For Businesses
Access to global customers.
Increased sales through diverse payment methods.
Automated conversion and settlement in preferred currency.
Fraud protection and security compliance.
Easy integration with websites, apps, and e-commerce platforms.
For Customers
Convenience of paying in local currency.
Wide choice of payment methods.
Secure and fast transactions.
Global access to products and services.
9. Challenges of International Payment Gateways
Despite their benefits, IPGs face challenges:
High Transaction Fees – Cross-border fees, currency conversion, and settlement charges can be expensive.
Regulatory Compliance – Different countries have varying rules (KYC, AML, data protection).
Fraud & Chargebacks – International transactions are riskier and prone to disputes.
Currency Volatility – Exchange rate fluctuations affect settlements.
Technical Integration – API complexity and ongoing maintenance can be challenging.
Limited Accessibility – Some regions lack reliable banking or digital infrastructure.
10. International Payment Gateway Regulations
To operate globally, gateways must adhere to strict rules:
PCI DSS Compliance – Ensures cardholder data protection.
KYC (Know Your Customer) & AML (Anti-Money Laundering) – Prevents illicit financial activities.
GDPR (General Data Protection Regulation) – Governs data privacy in the EU.
Local Regulations – RBI (India), FCA (UK), SEC (US), etc.
Conclusion
International Payment Gateways are the unsung heroes of the digital economy. They ensure that whether you’re a small Etsy seller in India, a freelancer in Africa, or a corporation in America, you can send and receive payments globally with just a few clicks.
While challenges like high fees, fraud risks, and regulatory hurdles remain, the benefits far outweigh them. As technology advances—with blockchain, AI, and digital currencies—payment gateways will become even faster, cheaper, and more secure.
In essence, International Payment Gateways are not just about payments—they are about enabling global trade, financial inclusion, and the future of borderless commerce.

AMP Futures - Macro maps: See the world of DataIn this idea we will demonstrate how to use the new macro maps feature in Tradingview.

FOMC has cleared liquidity levels around this technical rangeNews Drivers do not overpower technicals, the fundamentally driven movements are just banging around into huge money pending orders. No way around these mechanics.
That what we saw today, and what will continue to happen forever and ever 💎 Not saying it will always be a ricochet like today, but the orders are always there.

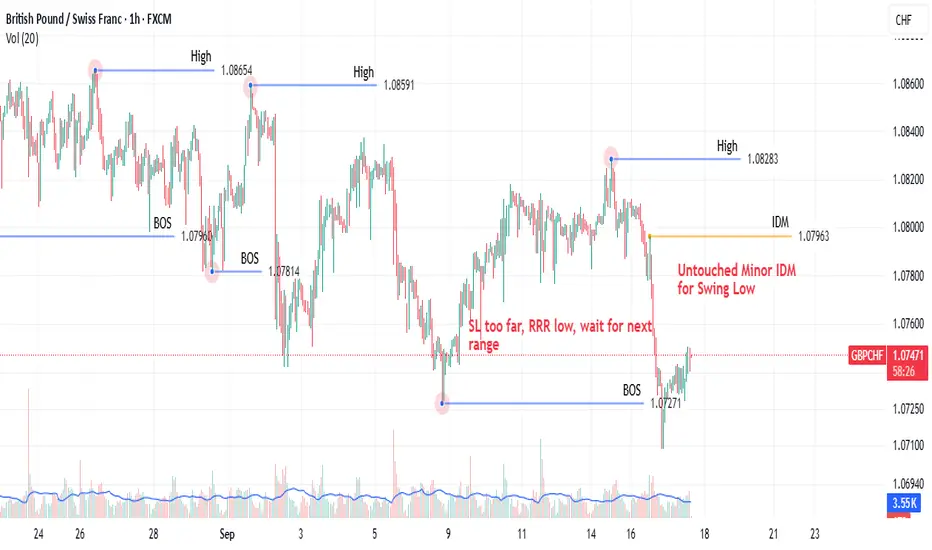
GBPCHF: A Lesson in Money Management Over Perfect SetupsCame across a textbook short setup on GBPCHF on the 1H recently. The price action was within a defined range, structure was bearish, and it was signaling a potential entry.
However, the trade was a pass. Why? The stop loss was simply too wide for my account size, creating a sub-optimal risk-to-reward ratio that fell below my personal 1:2 minimum rule.
This is a reminder that a good technical setup is only one part of the equation. The real discipline is in the money management—calculating the position size and risk before ever entering a trade. Sometimes, the best trade is the one you don't take.
Global Supply Chain Disruptions1. Understanding Global Supply Chains
What is a Supply Chain?
A supply chain is the entire network of individuals, organizations, resources, activities, and technologies involved in creating and delivering a product. It includes:
Sourcing raw materials (mining metals, growing crops, drilling oil).
Manufacturing and production (turning raw materials into components or finished products).
Logistics and transportation (shipping goods via sea, air, rail, or road).
Distribution and retail (warehouses, online platforms, supermarkets, etc.).
End consumers (people or businesses buying the final product).
When this network is stretched across borders, it becomes a global supply chain.
Why Globalization Made Supply Chains Complex
From the 1980s onward, globalization and free trade agreements encouraged companies to outsource production to low-cost countries. For example:
Clothing brands shifted manufacturing to Bangladesh, Vietnam, and China.
Electronics companies sourced chips from Taiwan and South Korea.
Automakers relied on a global network of suppliers for engines, batteries, and steel.
This “just-in-time” model reduced costs by minimizing inventory and maximizing efficiency—but it also created fragility. A delay in one part of the world could stall the entire chain.
2. Causes of Global Supply Chain Disruptions
Global supply chains face disruptions from multiple sources. These can be broadly classified into natural, political, economic, technological, and human-related factors.
A. Natural Disasters & Pandemics
COVID-19 Pandemic (2020–2022): Factories in China shut down, shipping routes froze, and workers stayed home. This caused a shortage of everything—from masks and medicines to electronics and automobiles.
2011 Japan Earthquake & Tsunami: Disrupted production of automotive and electronic components, particularly semiconductors.
Hurricane Katrina (2005): Crippled oil production and refined products supply in the U.S.
Nature remains an unpredictable factor that no supply chain can fully eliminate.
B. Geopolitical Tensions & Wars
Russia-Ukraine War (2022–present): Disrupted supplies of wheat, corn, natural gas, and oil. Many countries dependent on Ukraine’s grain faced food shortages.
US-China Trade War (2018–2020): Tariffs and sanctions disrupted technology and manufacturing supply chains, particularly electronics.
Middle East conflicts: Threaten oil shipping routes, especially through chokepoints like the Suez Canal and Strait of Hormuz.
C. Economic Factors
Inflation & Currency Fluctuations: Rising costs of raw materials, fuel, and labor make global shipping expensive.
Labor Strikes: Dock workers, truckers, or airline staff strikes can paralyze logistics.
Global Recession Risks: Lower demand impacts supply chain planning and inventory cycles.
D. Logistical Bottlenecks
Port Congestion: During COVID, ports like Los Angeles and Shanghai saw ships waiting weeks to unload containers.
Shipping Container Shortages: Containers were stuck in the wrong places due to demand imbalances.
Ever Given Incident (2021): A single container ship blocking the Suez Canal for 6 days disrupted global trade worth billions.
E. Technological & Cyber Risks
Cyberattacks: Ransomware on logistics companies or ports can freeze operations. Example: The 2017 NotPetya attack crippled Maersk’s shipping systems.
Digital Dependency: Overreliance on automated systems means even small software glitches can cause major delays.
F. Human-Related Issues
Labor Shortages: Truck drivers in Europe and the U.S. remain in short supply, delaying goods movement.
Policy Changes: Sudden government restrictions, environmental regulations, or export bans (like India’s ban on rice exports in 2023) can shake global markets.
3. Impacts of Global Supply Chain Disruptions
Supply chain disruptions ripple across industries, economies, and societies.
A. Economic Impacts
Inflation: Shortages push prices up. Example: Chip shortages raised car prices worldwide.
GDP Slowdowns: Countries dependent on exports face reduced growth.
Business Losses: Companies lose revenue when they can’t deliver products on time.
B. Industry-Specific Impacts
Automobiles: Car production lines halted due to semiconductor shortages.
Electronics: Smartphone and laptop makers struggled to meet pandemic-driven demand.
Healthcare: Shortages of PPE, medicines, and vaccines during COVID.
Food Industry: Rising costs of grains, fertilizers, and shipping raised food prices globally.
C. Social Impacts
Job Losses: Factory shutdowns affect millions of workers.
Consumer Stress: Empty shelves and higher prices cause frustration.
Inequality: Developing countries face harsher consequences, especially with food and medicine shortages.
D. Strategic Impacts
Shift in Global Trade Alliances: Countries reduce dependency on adversarial nations.
Rise of Protectionism: More countries adopt “self-sufficiency” policies.
Rethinking Efficiency vs. Resilience: Businesses now focus on balancing cost-cutting with security.
4. Real-World Case Studies
Case 1: The Semiconductor Shortage (2020–2023)
Triggered by COVID lockdowns and surging demand for electronics.
Car makers like Ford and Toyota halted production.
Waiting times for laptops, gaming consoles, and phones increased.
Case 2: Suez Canal Blockage (2021)
The Ever Given, a giant container ship, blocked the canal.
12% of global trade was stuck for nearly a week.
Cost global trade $9 billion per day in delays.
Case 3: Russia-Ukraine War (2022)
Ukraine, known as the “breadbasket of Europe,” saw grain exports collapse.
Energy markets destabilized as Europe scrambled for alternatives to Russian gas.
Shipping in the Black Sea faced risks, raising insurance and freight costs.
5. How Companies and Governments are Responding
A. Diversification of Supply Chains
Moving production from China to Vietnam, India, Mexico, and Eastern Europe.
“China + 1” strategy gaining momentum.
B. Reshoring and Nearshoring
Bringing production closer to home to reduce dependency.
Example: U.S. investing in domestic semiconductor manufacturing (CHIPS Act 2022).
C. Technology and Digitalization
AI and big data for better demand forecasting.
Blockchain for transparent tracking of shipments.
Automation in warehouses and ports to reduce labor dependency.
D. Strategic Stockpiling
Governments and companies building reserves of essential goods.
Example: Many countries stockpiling rare earth minerals and semiconductors.
E. Sustainability & Green Supply Chains
Shift toward renewable energy in logistics.
Electric trucks, biofuels, and carbon-neutral shipping.
Recycling and circular supply chains to reduce waste.
Conclusion
Global supply chain disruptions have shown the fragility of a hyperconnected world. While globalization brought efficiency and low costs, it also introduced systemic risks. Pandemics, wars, natural disasters, and political decisions can now paralyze industries thousands of miles away.
The lesson for businesses and governments is clear: resilience is as important as efficiency. The future of supply chains will depend on diversification, digitalization, and sustainability. Those who adapt quickly will thrive, while those who remain over-reliant on fragile links may face constant disruptions.
In essence, global supply chain disruptions are not just logistical problems—they are economic, political, and social challenges that shape the future of globalization itself.
