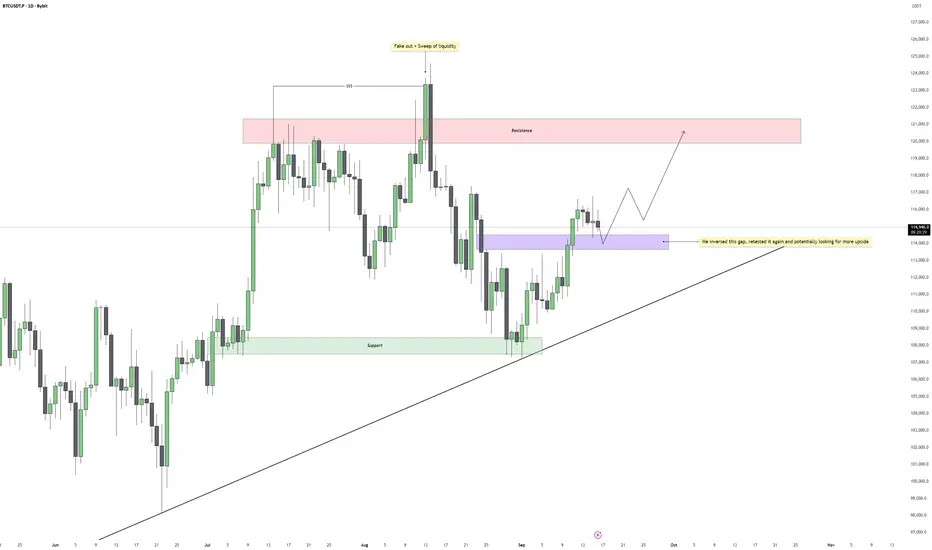
Bitcoin - Daily Gap Inversion Aligns with UptrendBitcoin recently made a push higher that cleared local highs and swept liquidity above the previous range. This move created a temporary fake out before price sharply retraced, filling inefficiencies left behind in the market. After completing this corrective move, price has begun reclaiming structure and is now respecting higher timeframe demand zones.
Daily Structure
The daily chart continues to show a clean uptrend, with higher lows forming along the rising trendline. After the liquidity sweep, price retraced to test key imbalances and has since confirmed a bullish shift by inverting a daily gap. This gap has been retested multiple times, suggesting it is holding firm as support and reinforcing the bullish continuation bias.
Liquidity Dynamics
The sweep of liquidity at the highs cleared buy-side pressure, resetting the market. This type of liquidity event often precedes sustained directional moves as the market seeks out new inefficiencies and liquidity pools. For now, downside liquidity has been satisfied and the path of least resistance appears to be higher.
Upside Scenarios
If the inverted daily gap continues to hold, price could target the major resistance block above 120,000 USDT. This zone aligns with the previous rejection area, where liquidity remains untested. Any approach into this resistance will be key to monitor for continuation or rejection.
Downside Risk
Should Bitcoin lose the daily inverted gap and trendline support, further retracement toward 111,000 to 112,000 USDT becomes possible, where a deeper liquidity pocket and structural support remain. Until then, the higher low structure remains intact.
Conclusion
Bitcoin has absorbed liquidity, filled inefficiencies, and inverted a daily gap that is now holding as support. Combined with the ongoing daily uptrend, this strengthens the bullish outlook with a clear target toward the 120,000 USDT resistance zone.
___________________________________
Thanks for your support!
If you found this idea helpful or learned something new, drop a like 👍 and leave a comment, I’d love to hear your thoughts! 🚀
Community ideas
Gold's Surge: What's Next for XAUUSD?👋Hello everyone, what do you think about OANDA:XAUUSD ? Will the price rise or fall?
Recently, the gold market has witnessed an extraordinary price surge, with the price continuing to reach new milestones around $3,700. This increase marks the third consecutive session where gold has hit a new all-time high, solidifying its impressive growth in the current economic environment.
This sustained uptrend is occurring as market participants prepare for the Federal Reserve's expected interest rate cut, with high expectations that the Fed will lower the benchmark interest rate by 0.25 percentage points in the upcoming meeting, which is favorable for gold.
From a technical perspective, in the short term, the chart shows that gold has been consolidating for a certain period before breaking out strongly, and it is currently in a slight pullback toward the new support level.
With the current uptrend, we may find buying opportunities at pullback points near the new support zone, especially if the market shows consolidation at the current price levels. Any minor pullback could be just an opportunity to increase long positions.
What do you think about the trend of XAUUSD? Leave your thoughts in the comments!

BTC: From Triangle to Flag → 118K?Let's take a look at the recent market context. Bitcoin climbed aggressively, creating a powerful impulsive leg upward.
That rally formed the pole of our bullish flag, a clear continuation pattern.
After that, price consolidated, shaping a tight, downward-sloping flag, while overall momentum stayed bullish.
The critical moment came just recently when price broke out of the flag with real strength.
A decisive breakout candle!
So the bias is clear — the bullish flag is active, the breakout is confirmed, and the projection points us toward 118,000.
The structure is clean, the momentum is strong… and the market is telling the story.

Lingrid | GOLD Record Breaking Rally ContinuesOANDA:XAUUSD is maintaining bullish structure after bouncing from higher lows and breaking through the 3,670 level, reinforcing upward momentum. Price is now consolidating just below the resistance zone, with the upward channel continuing to guide direction. If buyers hold above 3,670, gold could extend its move toward 3,715, aligning with the projected resistance area. The strong impulse leg and supportive trendline suggest that momentum remains with the bulls unless key support is lost.
⚠️ Risks:
A drop back below 3,670 could shift momentum and expose downside toward 3,625.
A stronger US dollar driven by macro data or hawkish Fed commentary may weigh on gold.
Sudden profit-taking near resistance could trigger short-term volatility and a retracement.
If this idea resonates with you or you have your own opinion, traders, hit the comments. I’m excited to read your thoughts!

GOLD → The market depends on the mood of the FED. Rate cuts FX:XAUUSD , after reaching 3700, entered a correction phase triggered by profit-taking ahead of important market news—the Fed's interest rate meeting.
Gold is falling and testing 3660-3650 after updating its ATH to 3703 ahead of the Fed's decision. All eyes are on Powell's forecasts and comments on future policy.
Fundamentally, a 25 bp rate cut is already priced in. Much more important is whether the Fed will hint at more than two cuts before the end of the year.
The market is expecting aggressive easing due to the risks of stagflation (weak labor market + persistent inflation).
If the Fed takes a dovish stance (three rate cuts), gold could hit new records.
If it is hawkish, i.e., a surprise (only one or two rate cuts), the dollar will strengthen and gold will correct
Resistance levels: 3674.7, 3686, 3700
Support levels: 3657, 3646.5, 3637
Technically, the further scenario for gold depends solely on the mood of the Fed and Powell's comments. The market still hopes to hear more positive hints and, before that, is forming a deep correction to the liquidity zones indicated on the chart in order to buy cheaper, if the situation allows...
Best regards, R. Linda!

US CRUDE OIL(WTI): Completed Consolidation📈 USOIL was consolidating within a horizontal range on a 4-hour chart, and has now broken and closed above its resistance level.
I anticipate that the price may continue to rise and approach the next key horizontal resistance at 65.62.

Gold Pullback Toward 3,650 as DXY Weakness Supports UpsideHey Traders, in today's trading session we are monitoring XAUUSD (Gold) for a buying opportunity around the 3,650 zone. Gold is trading in an uptrend, with price currently correcting toward this key support/resistance level.
Structure: The broader bias remains bullish, with price pulling back toward a key area of interest.
Key level in focus: 3,650 — a zone where buyers may look to re-enter and resume the trend.
Fundamentals: The U.S. Dollar Index (DXY) maintains a bearish bias, currently in a downtrend and approaching 97.150 resistance. This weakness could continue to support Gold due to their negative correlation.
Trade safe,
Joe.

Dealing Ranges - Powerful filter tool to your tradingHello Traders today. I ll break down for you how to enter on a pullback with high accuracy and not being stopped out by using a fibonacci in other words a Dealing range.
A Dealing Range forms when price takes out both a swing high and a swing low, followed by a clear expansion move. That expansion swing becomes the dealing range.
• By dividing the dealing range in half, we get two zones:
• Discount region (lower half) – where buying opportunities are typically more favorable.
• Premium region (upper half) – where selling opportunities are typically more favorable.
• You can think of a dealing range as similar to a PD Array Matrix, but specifically applied to expansion swings rather than consolidation phases.
On the example bellow I drew a Dealing range. If I took the long from the key level in the premium the trade would fail. But if waited for the key level in discount I could get much better RR and explosive move vice versa is happening on the bearish order flow charts. Check on your charts
So why is this situation on the above happening quite often?
It's simple - Liquidity. Market makers needs liquidity to fill their orders so they print nice trade opportunities in the premium where trader enter this setup, for trend continuation.
Setup is technically right. But by placing the trades in premium they creates a stop loss cluster = liquidity in the discount. Then this happen - price go for the liquidity of early buyers in the premium hits key level in the discount and it continue with the trend.
Im not saying that key levels in the premium cant work, in the strong trend there is no always pullback to the discount. But by applying Dealing ranges you will get:
Less but more accurate trades
Higher Risk reward setups
You can build HTF narrative
Use it for targets
Better risk management
Remember, there is not always a key level in the premium and pullback to the discount is not enough. Trade must go from a key level. So if there is not a key level in the premium price is often retracing to the discount key level in order to create a liquidity around a key level price makes a false break which sucks traders in to the market and create a liquidity on a key level.
Dont enter if price is not going from key level its a trap.
Time frame alignments
Always use 2 timeframes Higher time frame (HTF) and Lower timeframe (LTF)
• Higher Timeframe (HTF) = Dealing ranges
• Lower Timeframe (LTF) = Market Profiles / Profiling
Timeframe sequence
HTF Monthly - LTF - Daily / H4
HTF Weekly - LTF - H4 / H1
HTF Daily - LTF H1/ M15
HTF H4 - LTF M15 / M5
Im giving 2x LTF options because sometimes you need to scale lower timeframe to understand price action and best entries. However for the confirmations you can do well with the main sequence of first two.
Apply this rule to any markets. Im adding links to few examples from stocks, crypto an FX where you can see application of this concept. Click to charts to open them and see how price behave in discount and premium.
Examples from successful Tradingview Ideas
Tesla pullback to the discount - Low created in discount ATH most likely coming
Bitcoin pullback to the discount - Followed by expansion to ATH
Palantir pullback to the discount - followed by expansion to ATH
Bitcoin pullback to the Discount - followed by expansion
GBPCHF - Targeting Liquidity in the discount
Hope this help you in your trading journey. Let me know in the comments
David Perk aka Dave FX Hunter
LINK/USDT - Bearish Flag PatternBINANCE:LINKUSDT LINK/USDT - Looking for strong bearish, Bearish Flag Pattern Formation
Fundamental Updates :
SEC listing rules to boost crypto ETFs, but no guarantee of inflows: Bitwise
The US Securities and Exchange Commission streamlining the approval process for crypto exchange-traded products (ETPs) may trigger a surge of new offerings, but that doesn’t guarantee their success, a crypto executive warns.
Support by Likes and Comments.
Thank you.

TSLA path to 550/650 USD Breakout Still Pending🔥 What specifically drives TSLA into 550–650
📦 Deliveries + mix surprise
If unit volumes beat whisper numbers and mix favors higher-trim/FSD attach, you get more gross profit per vehicle without needing price hikes. Watch the cadence of regional incentives and shipping vectors; strong NA/EU mix plus improving China utilization is the sweet spot.
🛠️ Margin stabilization → operating leverage
Gross margin base effect + opex discipline = powerful flow-through. Even a 100–150 bps lift in auto GM, coupled with energy GM expanding as Megapack scales, can push operating margin into low-mid teens. That alone recodes the multiple market is willing to pay.
🔋 Energy storage stepping out of auto’s shadow
Megapack/Powerwall growth with multi-GW backlogs turns “side business” into a credible second engine. As deployments and ASP/contract mix normalize, investors begin modeling $10–$15B annualized energy revenue with attractive GM — this is multiple-expanding because it looks more like infrastructure/software-tinted industrials than cyclical autos.
🤖 Autonomy & software monetization bridges
Two things move the needle fast: (1) clear progress toward supervised autonomy at scale (drives FSD attach + ARPU), and (2) licensing (FSD stack, charging/NACS, drive units). Even modestly credible paid-miles/seat-based models (think $50–$150/month vehicles on fleet) transform valuation frameworks.
🦾 Optimus/robotics as a real option, not sci-fi
The market doesn’t need commercial ubiquity — it needs line-of-sight to pilot deployments and unit economics where labor-substitute ROI < 3 years. A few high-credibility pilots (warehousing, simple assembly, logistics cells) can tack on optionality premium that pushes the multiple toward the top of the range.
💹 Options-market reflexivity
Flows matter. Elevated call demand near ATH turns dealers short gamma, forcing delta hedging that lifts spot, which triggers more call buying → a familiar feedback loop. On breakouts, watch open interest skew to short-dated OTM calls, and put-call ratios compressing; these magnify upside in a tight float day.
🌍 Macro & liquidity
If indices hold highs and the rate path doesn’t tighten financial conditions, growth duration gets rewarded. TSLA’s beta + story premium thrives in that regime.
________________________________________
🧠 Outside-the-box accelerants
🛰️ “Software day” packaging
A coordinated showcase that bundles FSD progress, energy software (fleet, VPP), service/insurance data, and Optimus pilots into a single capital-markets narrative could reframe TSLA as a platform. The Street responds to packaging; it compresses time-to-belief.
🤝 Third-party FSD/charging licensing headlines
A single blue-chip OEM announcing software licensing + NACS deep integration reframes the competitive landscape. The equity market pays a software multiple for recurring seats.
🏗️ Capex signaling for next-gen platform without GM hit
Announcing a modular, high-throughput manufacturing scheme (cell to structure, gigacasting tweaks, logistics compression) with proof that unit economics are accretive from ramp can flip skeptics who anchor to past ramp pain.
⚡ Grid-scale contracts + financing innovation
If Tesla pairs utility-scale storage with project-level financing (think repeatable ABS-like channels for Megapack), you de-risk cash conversion cycles and unlock a new investor constituency (infrastructure/green income). That tightens the multiple.
________________________________________
🏎️ Comparative playbook: RACE (Ferrari) & NVDA (NVIDIA)
👑 RACE — the scarcity & brand ROIC lens
Ferrari’s premium multiple rests on scarcity, orderbook visibility, and brand pricing power. TSLA doesn’t have scarcity, but it can borrow the RACE lens via (a) limited-run, ultra-high-margin trims that anchor halo pricing, (b) waitlist-like energy backlogs that create visibility, and (c) bespoke software packages that mimic “personalization” margin. In bull phases, RACE trades as a luxury compounder rather than an automaker; TSLA can earn a slice of that premium when the energy + software story dominates.
🧮 NVDA — the flywheel & supply-constrained S-curve
NVIDIA’s explosive run blended (1) clear demand > supply, (2) pricing power, (3) ecosystem lock-in. TSLA’s battery and compute stacks can echo that dynamic: limited 4680/cell supply + Megapack queues + proprietary autonomy data moat. The moment the market believes TSLA is supply-gated (not demand-gated) in energy/AI, it will award NVDA-like scarcity premia. Add toolchain stickiness (training data, fleet miles, Dojo/AI infra), and you get ecosystem multiples rather than auto multiples.
📊 What the comps teach for TSLA’s 550–650 zone
• RACE lesson: visibility + pricing power boost the quality of earnings → higher P/E durability.
• NVDA lesson: credible scarcity + platform control turbocharge EV/Sales and compress the market’s time-to-future state.
• Translation for TSLA: blend of luxury-like quality (energy contracts + premium trims) and platform scarcity (cells/AI stack) → multiple rerate into our target band.
________________________________________
🧾 Valuation outlook
🧮 Earnings path
• Units up mid-teens % Y/Y; ASP stable to slightly higher on mix; energy + software up strongly.
• Auto GM +100–150 bps; Energy GM expands on scale; opex +SMC disciplined → op margin 12–15%.
• Share count glide modest. Forward EPS ≈ $9–$11.
• Multiple: 50× (conservative growth premium) → $450–$550; 60× (software/autonomy visibility) → $540–$660.
• Why the market pays up: visible recurring high-margin lines (FSD, energy software, services) + AI/robotics optionality.
📈 EV/Sales path
• Forward revenue $130–$150B (auto + energy + software/services).
• Assign blended EV/Sales 6.5–7.5× when energy/software dominate the debate.
• Less net cash → equity value per share in $550–$650.
• Check: At 7× on $140B = $980B EV; equity ≈ $1.0–$1.1T with cash, divided by diluted shares → mid-$500s to $600s. Momentum premium and flow can extend to upper bound.
________________________________________
🧭 Technical roadmap & market-microstructure
🧱 Breakout mechanics
A decisive weekly close above prior ATH with rising volume and a low-volume retest that holds converts resistance to a springboard. Expect a “open-drive → pause → trend” sequence: day 1 impulse, 2–5 sessions of rangebuilding, then trend resumption.
🧲 Volume shelves & AWVAPs
Anchored VWAPs from the last major swing high and the post-washout low often act like magnets. Post-break, the ATH AVWAP becomes first support, then the $500 handle functions as the psychological pivot. Above there, $550/$590/$630 are classical measured-move/Fib projection waypoints; pullbacks should hold prior shelf highs.
🌀 Options & dealer positioning
On a break, short-dated OTM calls populate 1–2% ladders; dealers short gamma chase price up via delta hedging. Expect intraday ramps near strikes (pin-and-pop behavior) and Friday accelerants if sentiment is euphoric. A steepening skew with heavy call open interest is your tell that supply is thin.
________________________________________
🧨 Risks & invalidation
🚫 Failed retest below the breakout shelf (think: a fast round-trip under the $4-handle) downgrades the setup from “trend” to “blow-off.”
🧯 Margin or delivery disappointments (e.g., price-war resumption, regional softness) break the EPS/EV-Sales bridges.
🌪️ Macro shock (rates spike, liquidity drains) compresses long-duration multiples first; TSLA is high beta.
🔁 Flow reversal — if call-heavy positioning unwinds, gamma flips to a headwind and accelerates downside.
________________________________________
💼 Trading & portfolio expressions for HNWI
🎯 Core + satellite
Hold a core equity position to capture trend, add a satellite of calls for convexity. If chasing, consider call spreads (e.g., 1–3 month $500/$600 or $520/$650) to tame IV.
🛡️ Risk-managed parity
Pair equity with a protective put slightly OTM or finance it with a put spread. Alternatively, collars (write covered calls above $650 to fund downside puts) if you’re guarding a large legacy stake.
⚙️ Momentum follow-through
Use stop-ins above key levels for systematic adds, and stop-outs below retest lows to avoid round-trips. Size reduces into $590–$630 where target confluence lives; recycle risk into pullbacks.
💵 Liquidity & slippage
Scale entries around liquid times (open/closing auctions). For size, work algos to avoid prints into obvious strikes where dealers can lean.
________________________________________
🧾 Monitoring checklist
🔭 Delivery run-rate signals (regional registration proxies, shipping cadence).
🏭 Margin tells (bill of materials trends, promotions cadence, energy deployment updates).
🧠 Autonomy milestones (software releases, safety metrics, attach/ARPU hints).
🔌 Licensing/partnership beats (NACS depth, FSD/AI stack interest).
📊 Options dashboard (short-dated call OI ladders; put-call ratio shifts; gamma positioning).
🌡️ Macro regime (rates, liquidity, risk appetite).
________________________________________
✅ Bottom line
🏁 The 550–650 tape is not a fairy tale — it’s a stacked-catalyst + rerate setup where energy/software/autonomy rise in the narrative mix, margins stabilize, and options-market reflexivity does the rest. Execute the breakout playbook, respect invalidation lines, and use convex expressions to lean into upside while protecting capital.
esla (TSLA) — Breakout Playbook
🎯 Core Thesis
• Insider conviction: Musk’s ~$1B buy.
• Risk-on macro: equities at highs, liquidity supportive.
• Options reflexivity: call-heavy flows can fuel upside.
• ATH breakout (~$480–$490) = gateway to price discovery.
________________________________________
🚀 Upside Drivers to $550–$650
• Deliveries & Mix: Surprise beat + higher trim/FSD attach.
• Margins: GM stabilization + energy scaling → op margin 12–15%.
• Energy: $10–15B rev potential with infra-like multiples.
• Autonomy/Software: FSD attach, ARPU, licensing.
• Optimus/Robotics: Pilot deployments → ROI < 3 yrs adds optionality.
• Licensing Headlines: OEMs adopting NACS/FSD stack.
• Capital Markets Narrative: Packaged “software + energy + robotics” story reframes Tesla as a platform.
________________________________________
🏎️ Comparative Bull Run Lens
• Ferrari (RACE): Scarcity, orderbook, luxury multiples.
• NVIDIA (NVDA): Scarcity + ecosystem flywheel → EV/Sales premium.
• Tesla Parallel: Blend of luxury quality (energy backlogs, halo trims) + AI scarcity (cells, fleet data, Dojo).
________________________________________
📊 Valuation Bridges
• EPS Path: $9–$11 EPS × 50–60× = $450–$660.
• EV/Sales Path: $130–150B revenue × 6.5–7.5× = $550–$650.
________________________________________
📈 Technical Roadmap
• Breakout > $490 → retest holds → next legs:
o $550 / $590 / $630 / stretch $650–$690.
• Watch anchored VWAPs; ATH shelf flips to support.
• Options chase accelerates above round strikes.

$SOLANA 250+ or bearish trend to 225/200With the recent solana pump, major profits have been taking place.
However, SOL stopped out at 249. Just under the Psychological level of 250.
On this chart we can see the following:
- Supply & Demand
- Anchored Volume
- Pattern: BF / BC /SR
- Two 4 hour FVG's below price, with HTF GP on the second FVG.
- One swing high & swing low
- OBV tool in place forming a bearish channel
- Psychological levels of 250, 225, 200
With these in place, we can see solana is looking pretty bearish now.
What comes up, must come down.
Solana is making a retest on the demand zone, which is also the resistance and golden pocket.
If price wicks and successfully rejects. We will definitely see 225.
A long with the Volume Anchor acting as a magnet for price to come back down as there has not yet been a retest.
But if it closes above the resistance, there is a greater chance of it breaking above the demand zone.
We will begin looking for shorting opportunities once solana fails to break above.
We will begin looking for long opportunities if solana succeeds in it's break above.
Right now, keep your eyes peeled.
We have movement incoming.

BTC to 120kBTC is progressing through a bullish Inverse Head & Shoulders pattern, projecting a primary target near $120,000. Simultaneously, a shorter-term Bullish Flag (a continuation pattern) has formed within the IHS, confirming the momentum and pointing toward a similar target zone of $120,000 - $121,000.
All eyes are on the immediate Demand Zone. A successful retest and re-accumulation in this area could provide the fuel for the next leg up toward the target. Watch for bullish reversal signals (e.g., hammer, engulfing candle) on a retest of the Demand Zone for a potential long entry.
Target: $120,000 - $121,000
This is a short-term play within a larger bullish structure. Let's see how it develops.

Gold Bulls Walking on Thin Ice1. Yesterday’s action
In yesterday’s analysis I said that although the chart looks bullish, Gold bulls should be very careful. After all, price had already climbed 4,000 pips in less than a month, and such complacency usually doesn’t end well.
During yesterday’s session, XAUUSD spiked above 3700, quickly reversed, and touched the newly formed support at 3675. From there, price attempted another push higher. Now we are once again back at support.
2. Key question
Will the 3670 zone hold, or are bulls about to lose control of the market?
3. Why caution is needed
• The chart is still bullish overall, but the structure is becoming increasingly concerning.
• If bulls lose the 3670 zone, I don’t expect a quick rebound from 3650.
• Instead, the market is more likely to continue lower, with at least a move toward 3620.
4. Trading plan
• From my perspective, buying here is very risky, even riskier than selling.
• I remain out of the market, waiting for a GOOD entry to sell.
• My target is a 700–1000 pip as usual, which I believe will come to the downside, not the upside.
5. Conclusion
Gold’s chart may still look bullish, but risk is shifting quickly. Chasing longs here could be dangerous — patience and discipline are key until the right sell opportunity appears 🚀

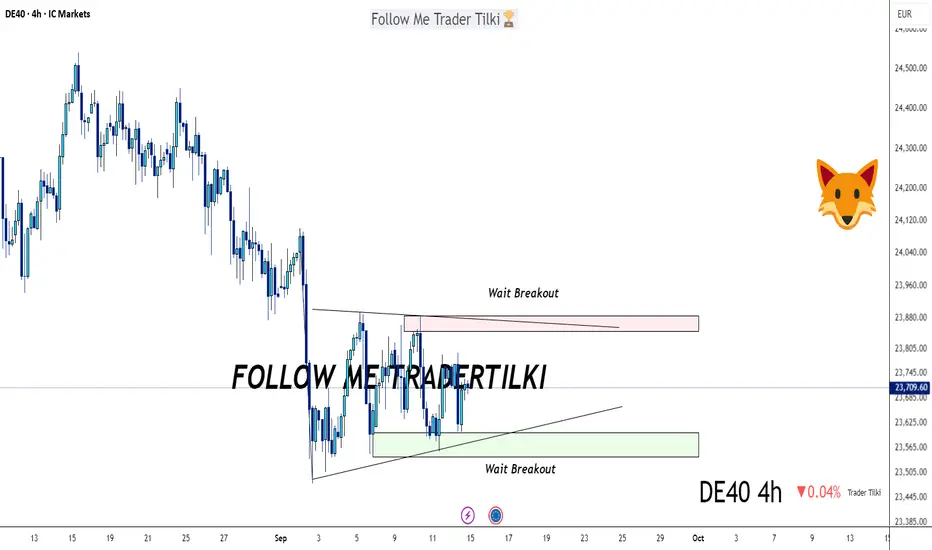
GER40 Loading the Break – Big Move Coming!Hey guys,
I’ve analyzed the GER40 index for you. Right now, it’s too early to drop a clear target—the price is stuck in a consolidation zone. It’s either gonna break down or break out. Once that move happens, I’ll share the exact target right away.
For now, just waiting on the breakout.
Also, every single like from you guys is what keeps me motivated to keep sharing these analyses. Big thanks to everyone supporting me with those likes.
FOMC Day: Prepare for Potential Bitcoin Volatility!Today is a big day for the markets – the US Federal Funds Rate decision and the FOMC Press Conference are scheduled, events that could potentially change the game for Bitcoin ( BINANCE:BTCUSDT ) and other assets .
But until the meeting begins , we still have time to analyze the charts and prepare.
Keep in mind : as we get closer to the announcement and especially during the release, the market could turn highly volatile. Manage your positions wisely and don’t forget your stop-loss levels .
-------------------------------------------
Bitcoin rose about +2% yesterday on the news that " Trump Family's American Bitcoin just went public on the Nasdaq ."
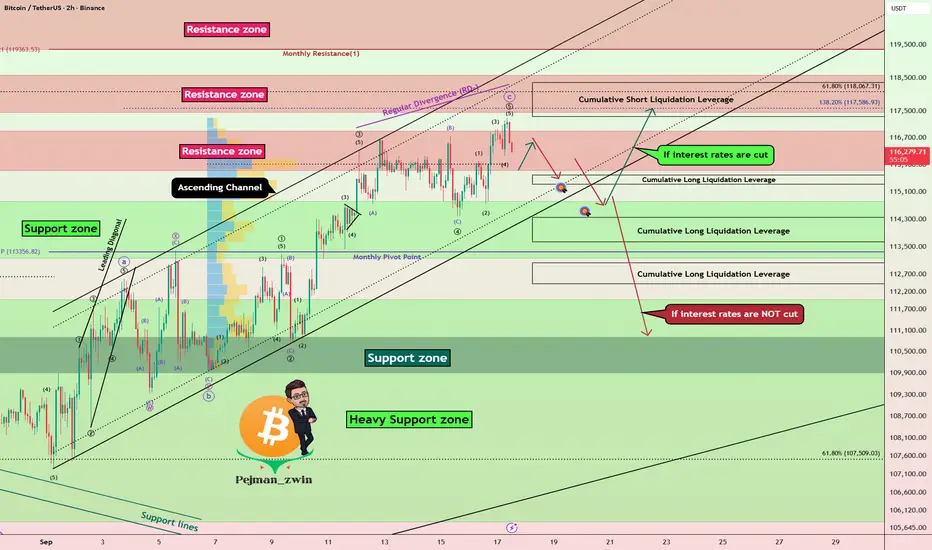
Bitcoin is currently trading in an ascending channel and Resistance zone($116,900-$115,730) near the Cumulative Short Liquidation Leverage($118,354-$117,329) .
In terms of Elliott Wave theory , if interest rates cut , Bitcoin could be completing wave 4 and then rising again and possibly forming a new All-Time High(ATH) . On the other hand, if interest rates do NOT cut , Bitcoin appears to have completed wave C of the Zigzag Correction structure(ABC/5-3-5) .
Also, we can see the Regular Divergence(RD-) between Consecutive Peaks .
I expect Bitcoin to drop to at least $114,860(First Target) before the Fed meeting starts , and if interest rates are not cut , we will see a further and more sudden drop in Bitcoin . And if interest rates CUT , there is a high probability of a Bitcoin pump, so stick to the first target($114,860) for now.
Second Target: $114,470
Cumulative Long Liquidation Leverage: $115,597-$115,330
Cumulative Long Liquidation Leverage: $114,351-$113,640
Cumulative Long Liquidation Leverage: $113,031-$112,430
Do you think the Federal Reserve will cut interest rates?
Please respect each other's ideas and express them politely if you agree or disagree.
Bitcoin Analysis (BTCUSDT), 2-hour time frame.
Be sure to follow the updated ideas.
Do not forget to put a Stop loss for your positions (For every position you want to open).
Please follow your strategy and updates; this is just my Idea, and I will gladly see your ideas in this post.
Please do not forget the ✅' like '✅ button 🙏😊 & Share it with your friends; thanks, and Trade safe.
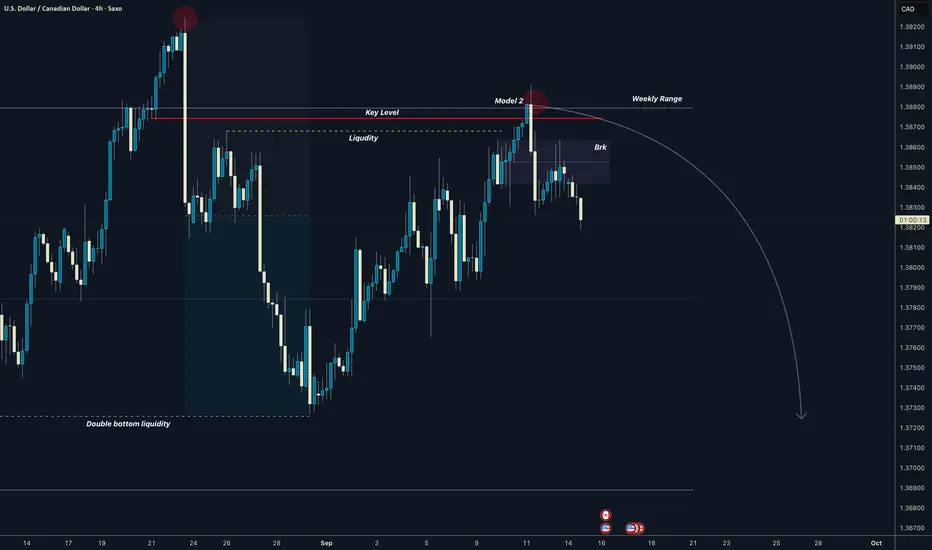
USDCAD Weekly Range Model 2Bearish setup from the weekly range retest from the key level.
Weekly Range manipulated
Price dropped down and created double bottom = Liqudity
Pullback to the Premium liquidity
Rejection + Breaker
Targeting 50% of Range and Double bottom , then Range low
Note: FOMC this week. it can be volatile.
Good luck
David Perk aka Dave FX Hunter
ETHEREUM Is it realistic to expect last Cycle's rally?Ethereum (ETHUSD) has been practically consolidating since the mid-August High, following an impressive rally on the April 07 Low. Technically it is coming off a 1W MA50/100 Bullish Cross.
It is the exact same pattern that confirmed ETH's massive parabolic rise (green Channel Up) during the previous Cycle in August 17 2020. The 1W RSI fractals between the two sequences are similar.
However, time-wise we are not in the same stage as last Cycle, in fact we are much closer to the end of the 4-year Cycle model. If there is still some time to repeat such a parabolic run, the price is 'limited' by the 1.618 Fibonacci extension at $13500, which again will be a wonderful and increasingly optimistic target for this Cycle Top.
Do you think it is realistic to expect such repeat at this stage?
-------------------------------------------------------------------------------
** Please LIKE 👍, FOLLOW ✅, SHARE 🙌 and COMMENT ✍ if you enjoy this idea! Also share your ideas and charts in the comments section below! This is best way to keep it relevant, support us, keep the content here free and allow the idea to reach as many people as possible. **
-------------------------------------------------------------------------------
💸💸💸💸💸💸
👇 👇 👇 👇 👇 👇

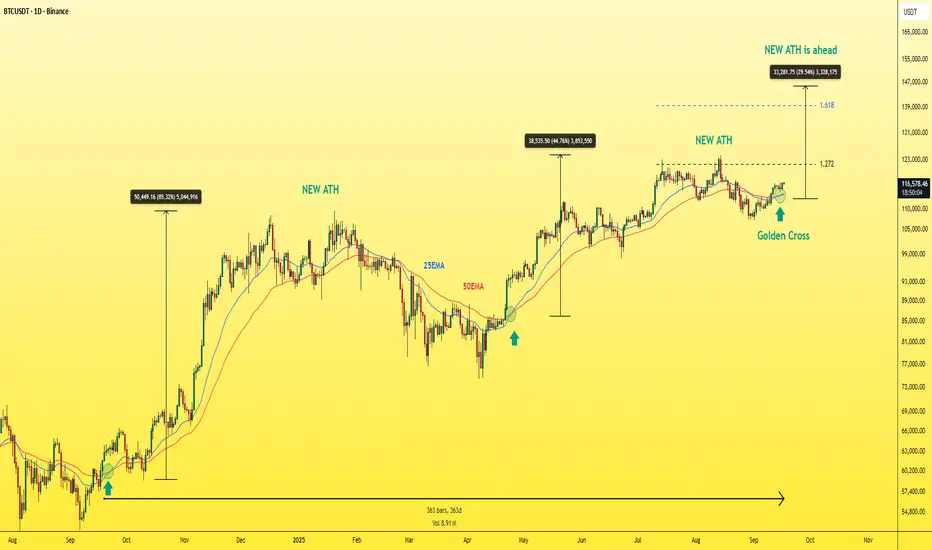
BITCOIN - New ATH is ahead!Over the past year — exactly 363 days — Bitcoin has only formed the Golden Cross pattern 3 times.
If you look at the chart, you’ll notice that each time this pattern appeared, it triggered a strong bullish rally leading to a new ATH (all-time high), as clearly shown.
And right now, Bitcoin is forming this exact pattern again on the daily timeframe.
For clarity:
- The Golden Cross happens when a smaller EMA (like the EMA 25) crosses above a larger EMA (like the EMA 50) .
This crossover is a classic bullish signal often marking the start of major upward moves.
based the fibonacci The next expected ATH for BTC is projected around 140K
Best Regards :
Ceciliones
Powell cutting rates? But why would he?📉 Powell cutting rates? 100% priced in. Even talk of 1–2% slashes. But why would he?
Let’s look at what the media ignores:
🇮🇳 Reports suggest India plans to cut its US Treasury holdings by up to 50% by 2025. That could mean roughly $450B hitting the market. Who’s going to buy that debt? The Fed? They’re already running negative equity — something that would be called insolvency for any private company.
Lowering rates would allow the US government (and its billionaire buddies) to borrow even more cheap money — not to fix the economy, but to speculate, pump Bitcoin, and trash the dollar further. Inflation? Even worse.
The US economy shows all the symptoms of a recession: layoffs rising, real wages falling, manufacturing shrinking. Official GDP numbers still look positive, but let’s not forget those “revisions” that always come later. Translation: the data is constantly massaged.
So what’s the real goal? Probably to juice the housing market. But let’s be honest: US mortgage rates today are just average by historical standards. Russia’s rates are higher, yet their currency and balance sheet look healthier because they don’t live off endless money printing.
The core problem is clear: reckless dollar printing to protect billionaire portfolios. And Powell? If he truly had conviction, he wouldn’t touch the rate at all.

Gold: Will It Hold 3,675 for a Bounce?Hello everyone,
Looking at OANDA:XAUUSD today, after reaching a peak of 3,690, gold is experiencing a slight pullback, leaving behind a clear Fair Value Gap (FVG) around 3,675–3,680. I see this as the nearest support level. The Ichimoku cloud remains upward, indicating that the bullish trend is intact. However, with significant news coming up, the chances of some sharp volatility are high.
The market is eyeing the Fed’s decision. If FOMC cuts rates by 25bps, the USD is likely to weaken, and gold tends to benefit from that. However, I’m also mindful that August Retail Sales exceeded expectations, which raises concerns that the Fed could be more hawkish, meaning they may keep rates high for longer, leading to short-term downside pressure.
Therefore, I’m considering two possible scenarios: if gold holds above 3,675–3,680, we could see a bounce back to test 3,700–3,710. However, if it breaks below 3,660, the risk of a deeper correction towards 3,630 increases.
Overall, I lean towards a scenario where gold tests 3,675–3,680 before bouncing up, but I’ll be extremely cautious around the news release.
What do you think? Could gold break through 3,700 in this move, or will it continue to chop around? Let me know your thoughts in the comments!

THE KOG REPORT - UpdateEnd of day update from us here at KOG:
Well, I don't think that could have gone any better with the KOG Report plan published on Sunday. We hit the final red box, exhausted and extended a bit but managed to get the move down from there that we had planned. In Camelot, we gave the exact level 3703 as the potential level and one that can not break if they want to retrace, which worked well.
With FOMC tomorrow, we can expect a retest of that high and if failed in the Asian session potential for a move back down into the 3660-65 region initially. That's the level we want, so lets see if we get it!
Best entry came from the red box which gave a capture twice and moved well. This should be protected and managed.
We'll be back tomorrow for the KOG Report FOMC so stay tuned and please take some time to hit the boost button on the Tradingview ideas.
As always, trade safe.
KOG

GBPUSD: Expecting ContinuationLet's observe the market structure on this pair.
Price is moving inside a clean ascending channel. This shows clear bullish momentum.
Price pushes up, then pulled back to retest the broken resistance. This created a mini break-and-retest setup inside the broader bullish channel.
Once it held as support, confidence build among buyers. And it shows!
From here, the projected target becomes the upper boundary of the ascending channel, which is around the 1.37160 level.

Double Top formation on AUDCAD - Risky, okay?Price made a strong rally on AUDCAD, climbing aggressively.
But now, we’re spotting a possible Double Top formation, two peaks at roughly the same level.
At first glance, this looks like a bearish setup.
But here’s the caution: in the context of such a powerful uptrend, a Double Top can be tricky.
Sometimes, it’s just a pause before buyers push even higher.
We can say that the neckline broke rather cleanly, with strong confirmation, but I don't see that much conviction yet from the sellers. Buyers could come back, and the uptrend continues. This is what makes it risky. Above, there’s a strong resistance zone, and that’s exactly where price could be heading next.
So, don’t jump in too early.
Because fading a strong trend is always risky business… or should I say risky biscuit?
