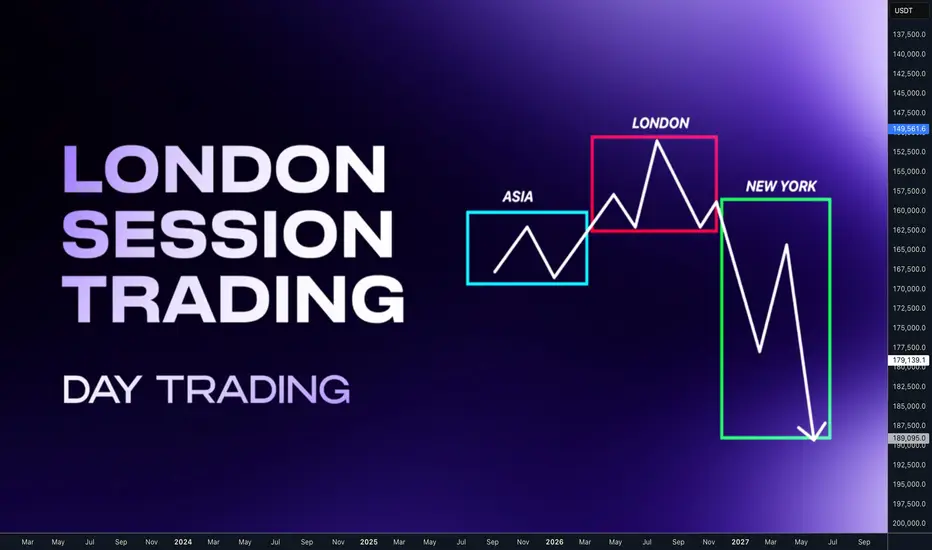
High probability strategies for the London SessionHey traders, let's break down the London session trading . In my opinion key session for the forex trading mainly for the EUR, GBP and CHF. I ll show you two high probability setups and its conditions to trade and when not to trade. Make notes and backtests so you got statistics and you can improve yourself over time. You will find out, that if you focus only on these 2 setups on 3 mentioned currencies. You will have 3-5 high probability opportunities per week.
Which is enough to make 6R gains in a week. Which is 3% on prop account with risk 0.5% per trade. And it's enough to make trading your main income.
📌 Asian Session
Low volatility & accumulation phase — the market usually consolidates inside a tight range after the previous New York close. If the Asia session is trending, London will be continuation setup.
📌 London Session
The highest-probability setups often occur during this session.
If Asia was tight range, London usually manipulates the Asian range sweeping stops above or below then reverses and starts the true daily move. London will be Reversal setup. Often sets the daily high or low of the day
📌 New York Session
Brings in the highest volume and often continuation or reversal of the London move. Based what has happen in London and on relationship with key levels and market phases. We can build market narrative for our trades.
🧪 London Continuation Bearish setup
•Narrative: Asia did the manipulation → London does the continuation.
• Asia session already made a manipulation into a key level
• Price displaced away from that level
• CIOD / OB on M15 or H1 before London open
• H1: Asia runs above the stops above H1 high into a key level
• It gets rejected and followed by order block and displacement
• At London open, price retraces into M15 premium key level and continues in the same direction
❌Invalidation: the manipulation high/low from Asia session
🧪 London Continuation Bullish setup
• Narrative: Asia did the manipulation → London does the continuation.
• Asia session already made a manipulation into a key level
• Price displaced away from that level
• CIOD / OB on M15 or H1 before London open
• H1: Asia runs bellow the stops above H1 high into a key level
• It gets rejected and followed by order block and displacement
• At London open, price retraces into M15 discount key level and continues in the same direction
❌Invalidation: the manipulation high/low from Asia session
🧪 London Reversal Bearish setup
• Narrative: London performs the manipulation → price reverses.
• Asia session consolidates near a higher timeframe key level
• London open initiates the manipulation into the key level
• Price reject at the key level and created M15 order block • H1: Asia consolidates Bellow Key Level
• London opens, price runs Asia high into that Key Level
• M15 breaks down → Change in order flow → clean short setup
• Target: higher timeframe draw on liquidity (e.g., previous day low)
❌Invalidation: the London session high (manipulation point)
🧪 London Reversal Bullish setup
• Narrative: London performs the manipulation → price reverses.
• Asia session consolidates near a higher timeframe key level
• London open initiates the manipulation into the key level
• Price reject at the key level and created M15 order block • H1: Asia consolidates above the Key Level
• London opens, price runs Asia high into that Key Level
• M15 breaks up → Change in order flow → clean short setup
• Target: higher timeframe draw on liquidity (e.g., previous day low)
❌Invalidation: the London session low (manipulation point)
🧩 to trade this method successfully you need to understand Order Blocks
🔗 Click the picture below to learn more 👇https://www.tradingview.com/chart/BTCUSD/LJ69Z8r4-Order-Block-Powerful-Key-level-and-Entry-confirmation/ 🕐 Timing is important
1️⃣Continuation setup can occur in first part of the London session. during the start of the settlement 2️⃣ Reversal setup needs a bit more time. I suggest don't enter before the 10 CET
wait for clear change in order flow after the manipulation 🧩 Day Trading doesn't mean trading every day. For highest probability setups trade only within the higher timeframes H4/D1/W1 trends.
📌 Down Trend - Trade Stop hunts above the highs
Trade London continuation or Reversal if the H4 Downtrend has run above the highs (stop hunt) It will give you chance to catch big expansion moves 📌 Up Trend - Trade Stop Hunt below the lows
Trade London continuation or Reversal if the H4 Downtrend has run below the lows (stop hunt) It will give you chance to catch big expansion moves. 🧩 In other words you want be buying loses and Selling highs.
🔗 Click the picture below to learn more 👇 I have explained how to do it in this post bellow Trend is your friend so H4 is minimum trend requirement for the London session traders. But if you want to take it to next level and enter on the sniper entries during the London session, you should also know daily and weekly trends within the monthly range. This opens a whole new world where you can catch London session model with HTF range move and it can be +10RR trades if you patient enough.
📈 Bullish LTF Ranges within HTF Range
Analyze HTF range (monthly) and define daily ranges, and wait for the London setups on the lows of the previous days within HTF trend. Always follow the same process in the London session on LTF. Asia either make manipulation - go with continuation setup or Asia consolidates and wait for the manipulation during the London session - go with London Reversal setup. 📉 Bearish LTF Ranges within HTF Range
Analyze HTF range (monthly) and define daily ranges, and wait for the London setups on the highs of the previous days within HTF trend. Always follow the same process in the London session on LTF. Asia either make manipulation - go with continuation setup or Asia consolidates and wait for the manipulation during the London session - go with London Reversal setup. ‼️ In trading, you make most money by making precisely best decisions and controlling your risk. Hence understanding the different probabilistic scenarios we can start focusing on quality over quantity by avoiding lower probability conditions. The aim is to improve our decision making process by knowing when it's better to trade and when not.
❌ Low Probability London Session Conditions
• After a series of 3 consecutive bullish daily candles - Avoid Longs.
• After a series of 3 consecutive bearish daily candles - Avoid Shorts.
• After FOMC event that produces an extreme range.
• Ahead of NFP and CPI data release
• Multiple high and medium impact news events.
• The Asian Range is has been trending and is larger than 40 pips.
• If the Asian Range is not visually consolidating.
• Absence of a candle range
✅ High Probability London Session Conditions
• The market has recently reacted off of Daily /H4 key level
• The Asian Range is visually a consolidating and smaller than 40 pips.
• Presence of a clean visual candle range
• Presence of a higher timeframe key level.
• Clean higher timeframe draw on liquidity.
✅ High Probability Intraday Setups
The highest importance is placed on the H TF Daily or 4h direction:
• Clean orderflow.
• Clean higher timeframe draw on liquidity and directional bias.
• Strong price based narrative.
• Strong time based narrative.
• 4h candle range
• 4h Key level.
• Key time
Adopt this simple concept and master it. You will not need to pay any signals group and other nonsense anymore. Just sacrifice 6 months to one strategy in one time window and find repetitiveness. Build confidence based on statistical data. Become independent.
✨ Trading Mastery is reflection of your life
Have a longterm plan, No Alcohol & Drugs, Ignore others, Focus on your journey , Backtest regularly, Review your weeks, Journal mistakes, Exercise, Sleep well, Read books, Walks in nature (no phone) , Meditate, Reduce social media time, Spend time with family, Live Life.
Trading is hard, but not impossible. I believe in you 💪
David Perk aka Dave Fx Hunter
Community ideas
BITCOIN – THE REAL REASON BEHIND THE FALLWhen I started trading someone told me something I’ll never forget: “If you can predict tomorrow’s newspaper headline, you understand the market.”
He didn’t mean I should chase news. He meant I should read structure so well that I know what kind of headline the market is already writing, before the mass even see it.
And now, looking around online, I see the complete opposite. Everywhere you look, there’s another “confluencer” talking about crypto with big words and zero understanding.
People selling dreams, memberships, and indicators, while they don’t even know what open interest or CVD means.
I’m not here to sell anything. I’m here to help people actually learn how to read data and see through the noise. Because what most of these so-called experts call “analysis” is just emotional guessing wrapped in confidence.
What I called and what happened
Last week I posted my “Big Dump” thesis.
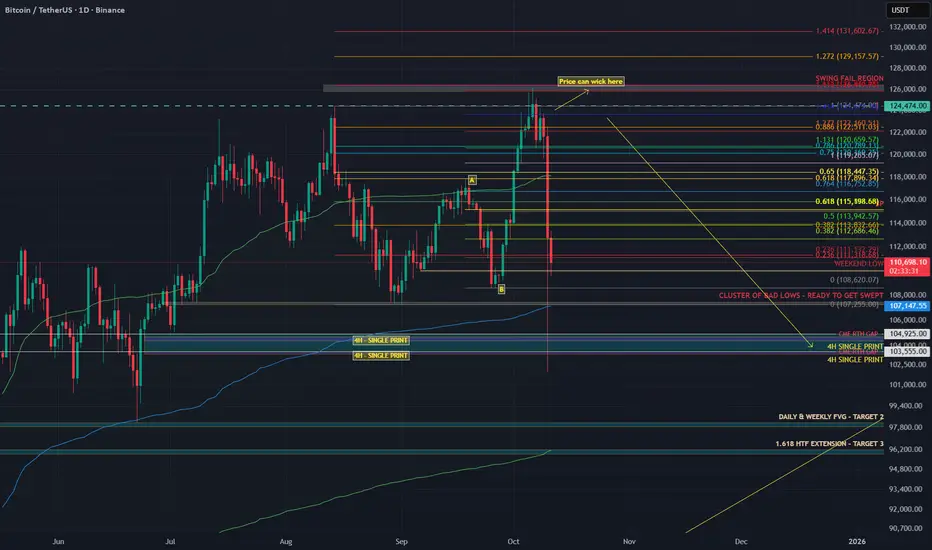
I said Bitcoin would swing fail above the highs, then drop into the 104K region. That is exactly what happened.
Price ran the sweep into 126K, trapped the late buyers, and dumped straight into 104K.
People blamed tariffs. The tariff headline was the spark. The fuel was crypto’s own positioning.
Why the structure was ready to snap
Before the crash, the data told the story clearly.
Stablecoin OI went from 257K to 285K contracts (+10.9%). That is new leveraged exposure.
Coin-margined OI dropped during the breakout, then rose again near the highs. Shorts were fading strength.
Spot CVD stayed flat to slightly negative. Real buyers were missing.
The long/short ratio fell from 2.05 to 1.02 even while price kept climbing.
That’s what distribution looks like. Buyers on leverage pushing price up while stronger hands sell into them. No real spot demand, just futures exposure.
You don’t need a macro event to fall. You only need a reason for those leveraged buyers to stop bidding. Think of it like a crowded elevator. Everyone keeps piling in as it moves up, feeling safe because it hasn’t stopped yet. But the moment one person hesitates, the weight shifts. When the next person panics, the whole thing drops.
That’s what happens when a market is driven by leverage instead of conviction. You don’t need bad news, you just need hesitation.
Look back at similar events.
In May 2021, funding rates were insane, perps overloaded, and spot volume thin. Elon Musk tweeted about Bitcoin’s energy use. That tweet didn’t cause the dump. It just made leveraged longs pause. The bids disappeared and the cascade started.
In August 2023, Evergrande headlines hit. Bitcoin was sitting at resistance with flat spot CVD and rising OI. Equities wobbled, crypto longs hesitated, and the structure collapsed within hours.
In March 2020, when COVID panic hit, Bitcoin had already been stretched thin. Funding was high, leverage was heavy, and liquidity was weak. The virus didn’t break the market, leverage did.
Leverage creates confidence until it doesn’t. Price doesn’t fall because people start selling. It falls because nobody steps in to buy. Headlines decide when the drop starts. Structure decides how far it goes.
Why 104K was my first target
I didn’t pick 104K out of thin air. That level was built on confluence.
1) AVWAP from the April 7 auction
That swing low kicked off with massive volume. When a move starts with that kind of participation, the anchored VWAP becomes a key reference for institutional flow. It represents the average cost of that whole auction, and when extended forward, it acts as a dynamic area where liquidity and algorithms interact.
That blue AVWAP line from April has been running right through the 104K region.
It’s not that price revisited that auction, it’s that the anchored VWAP from that event still marks the fair value area for that entire move.When price traded back down into that region, it met that same volume-weighted anchor, creating a major confluence zone that algos and larger players watch closely.
2) The June 22 breakout left an LVN
A new auction started on June 22 and pushed higher, leaving a Low Volume Node behind.
An LVN is a thin zone on the volume profile where the market moved quickly with little trade.
Markets often revisit these thin areas later to find balance or test unfinished business.
3) HTF Fibonacci cluster
Multiple higher timeframe Fibonacci retracements and extensions overlapped near the same 104K area. When several fib levels align with structure, that’s a strong confluence zone watched by both human traders and algorithms.
The 104K region was where the AVWAP line, LVN, and fib cluster all met. That’s not a random target. It’s a structurally defined area where liquidity concentrates and where markets tend to react sharply. And that’s exactly what happened.
The spark versus the structure
The tariff headline didn’t cause the drop. It triggered it.
The structure was already unstable. Leverage was maxed. Spot demand was flat. Funding was positive and rising. When the tariff news hit, traditional markets pulled back and crypto followed instantly. It wasn’t correlation, it was liquidity contagion.
Traders managing multiple books de-risk across assets when volatility spikes. That creates a gap in liquidity. When the bids vanish, the market falls into the first real pool of resting orders — in this case, the 104K zone.
You saw the same mechanics during the March 2020 crash and the 2021 deleverage. External shocks trigger internal liquidation cascades. That’s why saying “this had nothing to do with crypto is completely wrong.
This had everything to do with crypto. It’s like blaming the thunder for breaking a window when the glass was already cracked. Or saying the iceberg sank the Titanic when the captain was already steering through a sea of warnings.
Crypto was structurally weak. Leverage was stretched, spot demand was gone, and funding was positive. When the headline hit, it didn’t cause the collapse. It just gave the market permission to do what it was already set up to do — unwind.
Crypto is built on leverage.
Perpetual futures dominate volume.
Stablecoin collateral drives exposure.
When external risk events change funding conditions or risk appetite, the crypto market reacts instantly because its structure is fragile by design.
Example:
When yields spike, the dollar strengthens and funding costs rise. Leveraged longs become more expensive to hold, so traders unwind positions.
When equities dump, cross-asset desks reduce risk globally, which pulls liquidity out of crypto perps too.
Intermarket correlation always matters. Macro sets the mood. But the speed and violence of crypto moves always come from leverage inside the system.
How you can spot it next time
Compare Spot CVD vs Stablecoin CVD. If stablecoin CVD rises while spot stays flat or negative, the rally is leverage-driven.
Track Open Interest vs Price. Both rising together usually means exposure is building. Confirm with spot flow.
Watch the Long/Short ratio. If it drops while price rises, shorts are entering and the move may be getting absorbed.
Anchor VWAPs to real pivots like swing lows, breakouts, or liquidation spikes. Those levels attract institutional flow.
Study Volume Profiles. LVNs are thin and often retested. HVNs are balance zones that attract price.
Map HTF fib clusters for confluence. Reactions are stronger when multiple timeframes agree.
Note single prints and thin brackets on TPO or volume profiles. These often act as magnets.
When these factors line up, you don’t need to predict headlines.
You’ll already most likely know which headline will break the market.
TLDR
The rally was leverage-driven: Stablecoin OI up 10.9%, Spot CVD flat, Long/Short ratio down from 2.05 to 1.02
The swing fail at 126K was the final liquidity grab
104K was the target due to AVWAP + LVN + HTF fib cluster
The tariff headline was the spark, not the cause
The crash was caused by leverage and missing spot demand
Crypto didn’t fall because of politics. It fell because the market was already begging for an excuse to reset.
The data showed it clearly weeks before the drop.
If this helped you see the market a little clearer or made you think differently about how price really moves, please leave a like and drop a reaction. It keeps me motivated to keep posting real analysis, not the copy-paste bullshit hype that floods your feed every day.
Check the Order Flow Data from 6 October here: ibb.co
Being Devil’s Advocate on the “Big Reset” NarrativeI’ll start by saying this clearly: I hold a portfolio of altcoins right now, and honestly, I hope every influencer is right this time.
I want the market to recover. I want the reset story to be real.
But as I scroll through social media, I can’t help noticing how my feed is once again flooded with the same old enthusiasm —“The Big Reset happened!”, “This was the flush we needed!”, “Now it’s time to the moon!”
It’s hard not to feel a sense of déjà vu.
Because every time, the same narrative returns: "now it's time to buy", and the same faces repeat it.
And when everyone suddenly agrees on one explanation — that’s exactly when I prefer to be the devil’s advocate.
________________________________________
Friday’s Crypto Crash: What Actually Happened?
Last Friday, the crypto market went through what many now call “The Big Reset.”
Around $20 billion in leveraged positions were liquidated in hours. Bitcoin dropped more than 10%, and most altcoins went way lower.
The event exposed how fragile the market structure is when leverage, liquidity, and optimism align in the wrong way.
It wasn’t surprising that it happened — it was surprising how easily it happened.
The structure that seemed solid only days before crumbled in a few hours.
Now, the new collective story is that this was the great cleansing — the painful but necessary flush before the next bull run.
But let’s pause: is it really that simple?
________________________________________
The “Big Reset” Narrative
Those who promote the reset idea usually say:
1. Leverage purge: The overleveraged traders are gone, giving the market a clean slate.
2. Healthy structure: Open interest dropped, risk is reduced, and the base is stable again.
3. Cycle logic: Every bull market needs a correction — this was simply the reset before new highs.
It’s an appealing story — it makes the pain feel meaningful.
But just because a story feels good doesn’t mean it’s true; in fact, most of the time it is not
________________________________________
Why am I starting to be skeptical?
1. The same voices, the same narrative
The people calling this “the Big Reset” are often the same ones who have been announcing “altcoin season” for two years straight.
Their optimism is permanent, not analytical; they only have ONE IDEA
2. Reset ≠ recovery
Purging leverage doesn’t automatically bring in new capital.
It doesn’t attract institutions, fix liquidity, or change macro conditions. It just resets the scoreboard.
3. No such thing as free money
The idea that “now it must go up” assumes a law of easy profits. But if markets rewarded wishful thinking, no one would lose.
I don’t believe in free meals — and definitely not in free money.
4. Survivor bias
After every big drop, a few traders claim, “That was the bottom.” The rest remain stuck or silent. History is written by survivors.
5. Liquidity remains fragile
After big volatility, liquidity providers retreat. The market becomes thinner and more unstable.
It takes time — and real inflows — before confidence rebuilds.
________________________________________
The Devil’s Advocate View
What if this wasn’t a reset at all — but a warning?
• Maybe it’s a sign of deeper structural weakness.
• Maybe this is the start of a longer, grinding correction rather than a quick purge.
• Maybe the “reset” narrative is just a way to make pain sound constructive — a psychological shield against pain.
In short, what if the “Big Reset” is just another feel-good illusion for traders who need to stay hopeful?
________________________________________
Between Hope and Reality
The truth is that no one knows.
Markets don’t move on declarations — they move on flows, liquidity, and psychology.
So the best we can do is stay realistic:
• Observe, don’t assume.
• Manage risk and emotions.
• Watch key levels and volume, not influencers.
• Accept uncertainty as part of the job.
If the reset truly happened, we’ll see it in structure, trend, and sustained strength — not in hashtags or memes.
________________________________________
Final Thoughts: No Free Lunch, No Free Money
I’d love to be wrong on this one.
I’d love for the market to stabilize and climb again.
But history tells me to be cautious.
Every time the crowd agrees that “this was it”, the market finds a way to humble everyone.
So until proven otherwise, I’ll stay the devil’s advocate —because in trading, skepticism isn’t negativity; it’s survival.

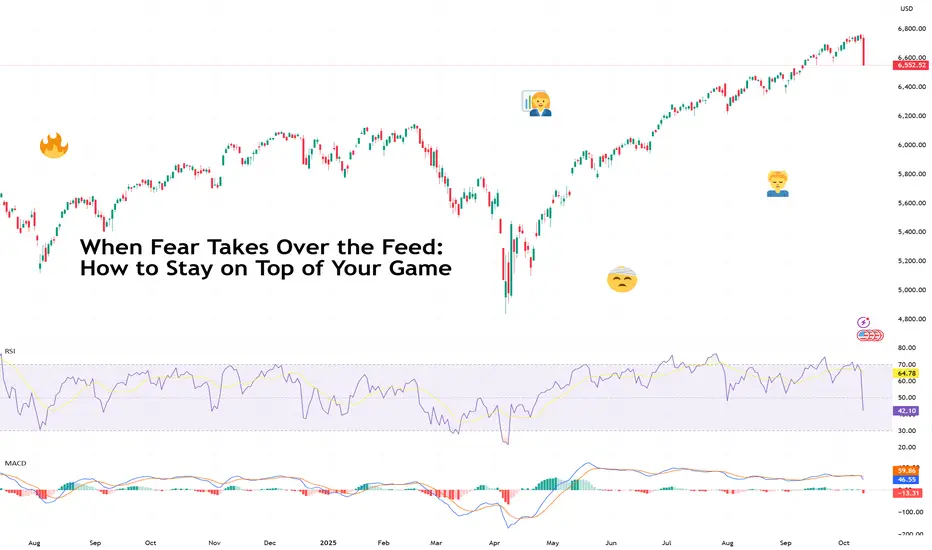
When Fear Takes Over the Feed: How to Stay on Top of Your GameFriday wasn’t just a red day — it was the kind of red that makes traders question their life choices.
The Nasdaq Composite NASDAQ:IXIC plunged 3.6% , its worst day since the April tariff-fueled meltdown.
The S&P 500 SP:SPX dropped 2.7%, the Dow Jones TVC:DJI tumbled nearly 900 points, and $1.6 trillion in market value simply evaporated.
Hello tariffs, my old friend.
President Trump announced he’s canceling a planned meeting with China’s Xi Jinping and slapping 100% tariffs on Chinese goods. Just when investors thought the trade wars were over.
It was China this time that triggered the mayhem. President Xi unveiled plans to tighten controls on rare-earth exports, materials critical for EVs and high-tech hardware.
The widespread selling was especially brutal over at the crypto corner with a record $19 billion in liquidations. Bitcoin BITSTAMP:BTCUSD face-planted 7.2% for the day, sliding below $111,000.
So, what’s a trader supposed to do when markets melt faster than your enthusiasm to study the Elliott wave?
Here’s a step-by-step guide that breaks down the psychology of panic and how smart traders stay cool when the feed turns into a fear factory.
🧠 Step One: Understand the “Fear Reflex”
When bad news breaks, the first instinct for most traders is to actually do something. Anything. Sell, short, hedge, pray — anything to make the pain stop. That’s your amygdala (the brain’s alarm system) talking.
When headlines hit, ask yourself:
• Is this new information, a re-spin of old fears, or a projection?
• Does it change the fundamentals of my positions?
• What’s the time frame of this impact — minutes, months, or meme-cycle?
If you can’t answer those calmly, and instead rush to offload your positions, you’re in panic mode and you risk making impulse decisions.
📊 Step Two: Zoom Out (Literally and Mentally)
When fear takes over the feed, the chart shrinks. Traders start staring at 1-minute candles and wonder if they should dump their stocks right now .
That’s the moment to zoom out. Pull up the 4-hour, daily, or weekly chart. You’ll likely notice that Friday’s epic collapse looks less like the apocalypse and more like a blip in an ongoing uptrend.
Case in point: The Nasdaq may have tanked 3.6%, but it’s still sitting near record territory after months of AI-fueled gains. The broader trend — higher highs, higher lows — is intact.
Volatility doesn’t mean reversal. It means emotion acting out. And markets love testing conviction.
💬 Step Three: Tune Out the Noise
When every post in your feed screams “MARKET MELTDOWN!” it’s tempting to join the panic chorus. But that doesn’t mean it’s going to be like that tomorrow.
Take for example the April crash. Stocks were rising and rising , and not too long after, they started hitting record after record .
You don’t need to read 20 opinions — you need one solid plan (and, of course, to be a daily reader of our Top Stories ).
A simple checklist helps:
• Position size: Are you overexposed?
• Stop-loss: Is it placed logically, not emotionally?
• Cash buffer: Do you have dry powder for the dip?
Don’t scramble mid-freefall. Prepare for volatility before it happens.
🧩 Step Four: Identify the Difference Between Noise and Narrative
Every market drop has two layers — the market-shaking news story and how investors perceive it.
• The headline on Friday: “Trump reignites trade war with China.”
• The perception: Markets pricing growth halt, rake hikes, gloom and doom, and apocalypse.
In the short term, that’s fear-inducing. In the medium term? It could actually mean looser monetary policy — which is generally bullish for risk assets like stocks, gold, and even crypto.
In other words, what feels like the end of the world on Friday might look like a buying opportunity by Tuesday.
🧭 Step Five: Play Offense When Others Play Defense
There’s a reason Buffett’s “be fearful when others are greedy” quote is overused — because it’s true.
When the market wipes out $1.6 trillion in a day, it’s a reminder that liquidity and emotion drive short-term moves. If your thesis is intact and you’re not that up high on leverage, you may consider this drop as a time to look for opportunities.
Instead of selling in fear, study which sectors overreacted.
• Tech led the plunge — but if (or when) there’s a rebound, these stocks will most likely be the leaders. Especially now when the third-quarter earnings season is here (check when it’s big tech’s turn to report by browsing the Earnings calendar ).
• Gold and bonds saw inflows — typical defensive plays.
• Energy and industrials may catch bids if tariffs stick.
🪙 A Note to Crypto Bros
Bitcoin’s 7% slide shows that once-independent assets have spent too much time with traditional risk assets.
And now they’re almost impossible to tell apart. As institutional capital grows in crypto, it behaves more like a growth play where risk is embraced during good times, but dumped during bad.
The lesson? Don’t buy the “decoupling” narrative so easily. Bitcoin may hedge against long-term fiat decay, but in a short-term panic, it’s still part of the same risk ecosystem. The smart move is to trade correlations , not beliefs.
If Bitcoin drops with stocks during a tariff tantrum, that’s confirmation that institutional traders are playing both arenas.
🧡 Final Takeaway
Let’s acknowledge that Friday’s bloodbath was catastrophic to many . It wiped out traders that were holding both stocks and crypto. If that happened to you, as painful as it is, keep your head up, take a breath (or a break), and come back another day.
And when you do, widen your chart, trim that leverage and keep your bets nimble so you’d survive the next inevitable meltdown.
Finally, we can't not address the elephant in the room. It was likely another Trump-led market rinse-and-repeat cycle: tweet, panic, rebound. Futures are recovering after Trump waved away tariff fears , saying “Don’t worry about China, it will all be fine!”
Off to you : How did you fare Friday? And what's your way of weathering the market storms? Share your experience in the comments!
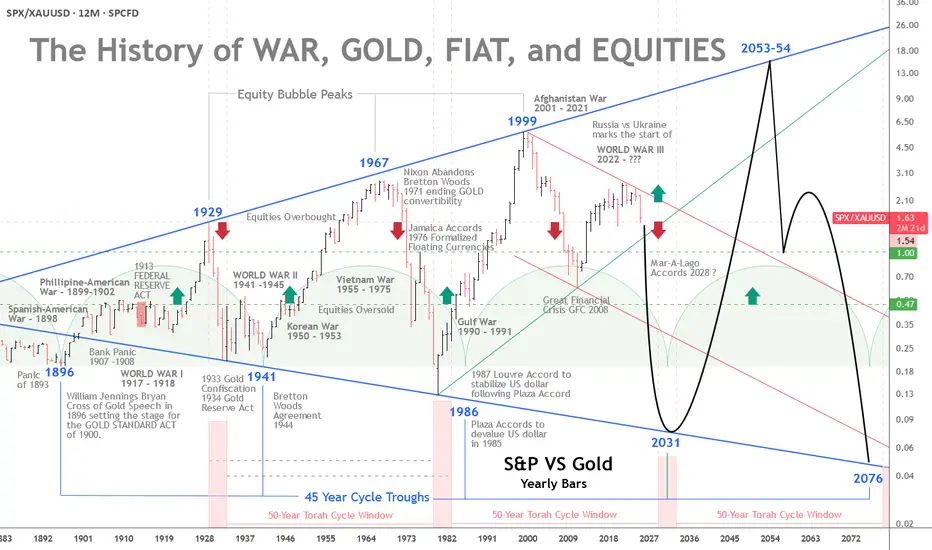
The History of War, Gold, Fiat, and EquitiesGold vs. Equities — The 45-Year Cycle and a Pending Monetary Reset
The interplay of war, gold, fiat money, and equities has long been a barometer of real wealth and economic stability. A recurring pattern emerges across modern history: approximately 45-year intervals when gold strengthens relative to equities.
From the Panic of 1893 to the present, these cycles have coincided with major monetary shifts and geopolitical shocks.
With a broadening 100-year pattern, rising geopolitical tension, and roughly $300 trillion in global debt, a monetary reset by the early 2030s is plausibly on the horizon.
The 45-Year Cycle — Gold’s Strength at Equity Troughs
The pattern’s first trough is traced to 1896, when William Jennings Bryan’s “Cross of Gold” speech preceded the Gold Standard Act of 1900. Equities were weak after the Panic of 1893, and gold gained prominence. Thirteen years later, the Federal Reserve would be created. More on the 45-year cycle later.
The 50-Year Jubilee Cycle
The Torah’s 50-year Jubilee cycle, as outlined in Leviticus 25:8–12, is a profound economic and social reset that follows seven 7-year Shemitah cycles, totaling 49 years, with the 50th year designated as the Jubilee.
Each Shemitah cycle concludes with a sabbatical year (year 7, 14, 21, 28, 35, 42, 49), during which the land rests, debts are released, and economic imbalances are addressed (Leviticus 25:1–7).
The Jubilee, occurring in the 50th year, amplifies this reset by mandating the return of ancestral lands, freeing of slaves, and further debt forgiveness, symbolizing a divine restoration of societal equity.
While built on the 49-year framework of seven Shemitahs, the 50th year stands distinct, marking a transformative culmination rather than a simple extension of the Shemitah cycle.
The five-year Jubilee windows highlighted at the base of the chart compliment the 45-year cycles previously noted. The 4 year Jubilee windows are projected from the roaring 20s peak in 1929 and the 1932 bear market low four years later.
The next Jubilee window is scheduled to occur some time between 2029 and 2031.
Returning to History and the 45-Year Cycles:
The Panic of 1907 and the Fed
The Panic of 1907 was a severe crisis, with bank runs, failing trust companies, and a liquidity crunch centered in New York. The collapse of copper speculators (F. Augustus Heinze and Charles W. Morse) triggered runs on institutions like the Knickerbocker Trust.
Private bankers led by J.P. Morgan injected liquidity (over $25 million) to stabilize the system. The shock exposed the absence of a lender of last resort and precipitated reforms.
Congress responded with the Aldrich–Vreeland Act (1908) and the National Monetary Commission, whose 1911 report recommended a central bank to supply “elastic currency.”
After debate and hearings, President Woodrow Wilson signed the Federal Reserve Act on December 23, 1913, creating a decentralized central bank with 12 regional banks.
Some alternative accounts (e.g., The Creature from Jekyll Island) argue that the panic was exploited to centralize financial control. Mainstream history, however, treats the panic as the genuine catalyst for reform.
Whatever the intent, the Fed’s creation shifted the tools available to manage crises—and, over time, central banks have played an instrumental role in financing wars and expanding Fiat currency.
The Fed and World War I
World War I began in Europe in 1914 (U.S. entry in 1917). The Fed began operations in November 1914 and later supported wartime financing by:
Marketing Liberty Bonds (~$21.5 billion raised, 1917–1919).
Providing low-interest loans to banks buying Treasury securities (via 1916-era amendments).
Expanding the money supply, which contributed to wartime inflation.
Although the Fed was created primarily to prevent panics and stabilize banking, its early role in war finance shifted expectations about central banking’s functions.
From Confiscation to Bretton Woods to the Nixon Shock
In 1933, during the Great Depression, the U.S. effectively nationalized gold—private ownership was outlawed, and the official price was later reset at $35/oz by the Gold Reserve Act of 1934. Private ownership remained restricted until President Ford legalized it again in 1974.
World War II and the Bretton Woods Agreement (1944) cemented gold’s role: the dollar became the anchor of the system, and other currencies pegged to it.
That status persisted until August 15, 1971, when President Nixon suspended dollar-gold convertibility—the “Nixon Shock”—moving the world toward fiat currencies.
The Petrodollar and Post-1971 Arrangements
After 1971, the U.S. worked to preserve dollar demand. The petrodollar system emerged in the early 1970s: following the 1973 oil shock, a U.S.–Saudi understanding (1974) helped ensure oil continued to be priced in dollars and that oil revenues were recycled into U.S. Treasuries—supporting the dollar’s global role despite its fiat status.
Devaluations, Floating Rates, and the End of Bretton Woods
Two formal “devaluations” followed the Nixon Shock:
Smithsonian Agreement (Dec 18, 1971): Raised the official gold price from $35 to $38/oz (an 8.57% change) as a stopgap attempt to stabilize fixed rates without restoring convertibility. It widened exchange banding but proved unsustainable.
On February 12, 1973, the official gold price was revalued to $42.22/oz (roughly a 10% change), a symbolic acknowledgment that Bretton Woods was collapsing. By March 1973, major economies had effectively moved to floating exchange rates, and market gold prices surged.
These moves were reactive attempts to adjust the dollar’s value amid trade deficits, inflation, and speculative pressures. They ultimately ushered in a fiat era, where market forces, not official pegs, set the price of gold.
Triffin’s Dilemma — Then and Now
Triffin’s Dilemma describes the structural tension faced by a reserve currency issuer: it must supply enough currency to ensure global liquidity (running deficits) while risking domestic instability and a loss of confidence.
Britain faced this under the gold standard; the U.S. faced it under Bretton Woods and again after 1971, albeit in a different form.
Modern manifestations include inflation, persistent fiscal and external deficits, and mounting debt. International policy coordination (e.g., the Plaza and Louvre Accords) repeatedly tried—and only partially succeeded—to manage these tensions.
The Plaza (1985) and Louvre (1987) Accords
Plaza Accord (Sept 22, 1985): G5 nations coordinated to depreciate the dollar (it had appreciated ~50% since 1980). The goal was to ease U.S. trade imbalances. The dollar fell substantially vs. the yen and mark by 1987.
Louvre Accord (Feb 22, 1987): G6 sought to stabilize the dollar after its rapid decline following the Plaza Accord, setting informal target zones and coordinating intervention. It temporarily checked volatility but did not solve underlying imbalances.
Both accords illustrate the extreme difficulty in balancing global liquidity needs with domestic economic health in a fiat system.
De-industrialization, Bubbles, and the Broadening Pattern
Orthodox history would argue that U.S. de-industrialization in the 1990s was rational at the time. Globalization and cost arbitrage provided short-term benefits, but they increased trade deficits, foreign dependency, and robbed the middle class of high-paying jobs. That loss of capacity heightens vulnerability to dollar shocks and complicates any re-industrialization efforts today.
Measured in gold, equities have experienced expanding ranges:
Equity peaks (1929, 1967, 1999) were followed by troughs where gold outperformed (1896, 1941, 1980/86).
Gold peaked in 1980, even though the cyclical trough in the broader pattern was nearer 1986—showing that cycles can shift.
The dot-com peak (1999) marked a secular low for gold relative to equities. The ensuing crashes, 9/11, and the War in Afghanistan, followed by the 2008–2009 Financial Crisis (GFC), moved markets profoundly—both nominally and in terms of gold.
From 1999, relative equity values fell until a trough around 2011 (coinciding with the European debt crisis). Quantitative easing and policy responses (2010 onward) restored growth, but frailties remained (e.g., repo market stress in 2018).
COVID produced another shock; aggressive fiscal and monetary responses engineered a V-shaped asset recovery but also higher inflation.
Relative to gold, equities peaked in 1999 and have trended lower since. As nominal stock prices register all-time-highs in dollars—fueled by AI and other themes—equities are historically overvalued. When priced against gold, the apparent bubble in nominal terms looks more like an extended bear market ready for its next down-leg.
The Broadening Pattern and the Next Trough
A broadening pattern illustrates the gold equity ratio range expanding with each major peak and trough. If we accept a roughly 45-year rhythm from the 1980/86 period, the next cyclical trough may fall between 2025 and 2031, with 2031 a focal point. Whether this manifests as a runaway gold price, a sharp equity collapse, or both remains uncertain.
If a sovereign-debt crisis or major war escalates, changes could accelerate—some scenarios even speculate about a negotiated new monetary framework (e.g., “Mar-A-Lago Accords”) in the next 5–15 years.
Geopolitics and the $300 Trillion Debt
Geopolitical tension compounds financial stress. The Russia-Ukraine war, plausibly the start of World War III, NATO involvement, and nuclear saber-rattling evoke systemic risk. Global debt—estimated at around $300 trillion (over 300% of GDP per the Institute of International Finance)—is unsustainable.
U.S. public debt (~$38 trillion) now carries interest costs comparable to defense spending.
Central bank money creation to service debt erodes confidence in fiat currencies and boosts demand for gold. Historical monetary resets (Bretton Woods, Nixon Shock) followed similar pressures of debt and conflict.
A modern reset could push gold well beyond current records—potentially into the high thousands or five-figure territory if confidence collapses.
Implications of a Pending Monetary Reset
A reset might take various forms:
A partial return to a gold-linked standard, perhaps supplemented by tokenized/digital assets.
Forced debt restructuring or coordinated global defaults.
Rapid adoption of digital currencies (including state-issued tokens—CBDCs) as part of a new settlement architecture.
Given Triffin’s Dilemma, inflated financial assets, and interconnected global linkages, a modern reset could be far larger in scale and speed than past adjustments. Assets, trade, and supply chains are far larger and more intertwined than in 1971, increasing contagion risk.
Practical takeaway: investors should consider gold’s role in portfolios; policymakers must confront debt sustainability or risk a market-driven reckoning that could disrupt global finance.
Conclusion
The Torah's 50-year Jubilee, the 45-year cycle and the century-long broadening pattern suggest we are approaching a structural turning point.
Triffin’s Dilemma, decades of accumulated imbalances, de-industrialization, and escalating geopolitical risk suggest a monetary reset is plausible between 2030 and 2035—possibly sooner under severe stress.
A modern reset would be more disruptive than past episodes because today’s global economy is larger, more integrated, and technologically complex. The question is not only whether such a reset will occur, but how policymakers and markets will manage it.
The stakes—global financial stability and the relative value of fiat versus real assets—could not be higher.
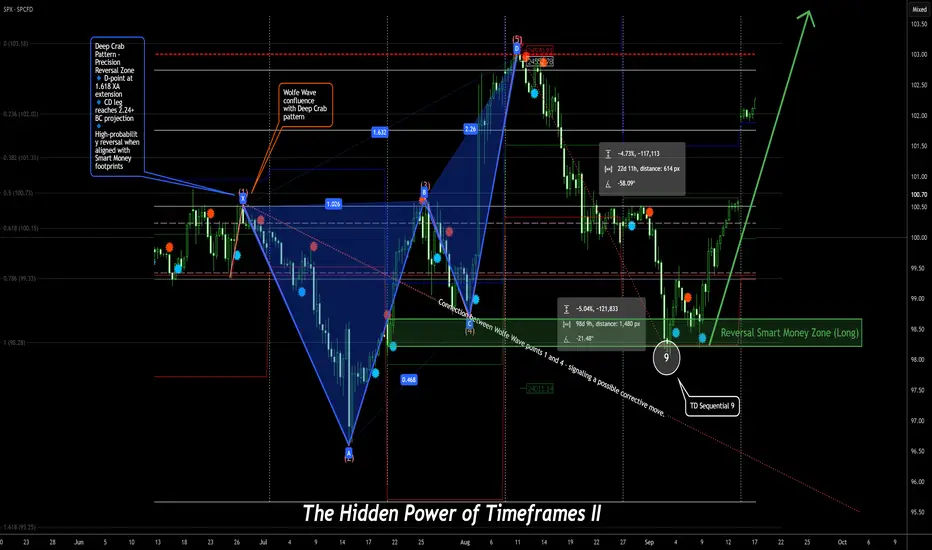
The Hidden Power of Timeframes – Part 2 🔮 The Hidden Power of Timeframes – Part 2 Connection Confluence” – The Invisible Architecture of Precise Trades
Seeing the Invisible
Welcome to Part 2.
If Part 1 gave you clarity on how timeframes interact, we now go one level deeper — into the unseen forces that move beneath the surface of every chart.
🧠 The question is:
“How can I recognize where structure is headed — before it even forms?”
🧠 It’s Not Just About Alignment – It’s About Multi-Timeframe Confluence
The magic doesn’t lie in one indicator or one pattern.
It’s born in the interplay of powerful concepts:
🌀 Wolfe Waves forming at the edges of Order Blocks
🧬 Harmonic Patterns merging with RSI or MACD divergences
🔢 TD Sequential counts signaling exhaustion at precise turning points
🕯️ Japanese Candlesticks confirming what orderflow already whispers
🔐 Smart Money footprints revealing where the crowd dreams — and where those dreams get crushed
This is more than technical analysis.
This is about reading intention — before it becomes visible.
⏳ Multi-Timeframe Fractals – The Echo of the Market
The market is fractal.
What unfolds on a 15-minute chart can mirror the Daily — and often previews the next big move on the Weekly.
📌 Example Scenario:
✅ Bullish divergence on the 4H chart
✅ Aligns with a Gartley pattern on the Daily
✅ Completes just as a TD9 count signals exhaustion on the Weekly
✅ While retesting a monthly liquidity pool
That’s not coincidence — that’s Signal Confluence.
And those who read it are always one step ahead of the market.
🛰️ Smart Money & Orderflow – Trade the Why, Not Just the What
Smart Money doesn’t chase candles.
It trades intent, imbalance, and psychology.
🛠️ Tools of the Trade:
Fair Value Gaps (FVG)
Order Blocks
Liquidity Sweeps
Breaker Blocks
Displacement & Inducement
Retail traders chase patterns.
Smart Money chases the dreams of retail.
🔗 The Real Edge: Seeing Connections Others Miss
A Wolfe Wave is just a shape
An Elliott Wave is just a count
A TD9 is just a number
But when…
🌀 A Wolfe Wave forms during the 5th Elliott Wave
🔢 Ends with a TD9 at a liquidity high
🔐 Inside an Order Block...
💥 That’s not just technicals — that’s chess on the chart.
That’s how real precision is born.
That’s how you anticipate moves weeks — or even months — in advance.
🧭 The Meta Skill: Navigating Confluence Across Timeframes
You don’t need to know everything.
You just need to:
✔️ Recognize when timeframes align
✔️ Feel where systems converge on one idea
✔️ Avoid forcing trades when there’s no synergy
✔️ Only act when the market’s story is consistent across all levels
A true edge doesn’t come from more tools —
It comes from clarity in complexity.
🧩 Bonus Insight: Alignment Within a Single Timeframe
Timeframe confluence is powerful.
But don’t underestimate the strength of multiple high-probability signals inside just one timeframe.
Example:
In a 4H chart:
Wolfe Wave
Harmonic Pattern
Orderflow Zone
Divergence
…all pointing to the same reversal area.
That’s not clutter — that’s weighted confluence.
These moments often deliver the most decisive trades.
💬 Comment below – or share this with someone who’s always fighting their own timeframes.
🚀 Let’s trade with precision — not prediction.
Gold’s Relentless Ascent: Consolidation or the Next Breakout?Gold futures rose 2.3% for the week ending 10/Oct, marking the eighth consecutive weekly gain and lifting prices to a new all-time high above USD 4,000 per ounce. Despite the record-setting week, performance was mixed. Late in the week, gold came under pressure as risk sentiment improved following a ceasefire agreement between Israel and Hamas. Additional pressure came from a more hawkish tone in the Federal Reserve’s FOMC meeting minutes.
The main catalyst on 10/Oct (Fri) was President Trump’s threat to impose 100% tariffs on Chinese goods over rare earth restrictions. The move sharply escalated trade tensions, driving a surge in uncertainty—as reflected by higher implied volatility (IV)—and briefly weighing on gold near the USD 4,000 level. By 13/Oct (Mon), Trump’s subsequent comments signalled that the escalation might be short-lived, improving sentiment and propelling gold to a new all-time high.
This paper analyses signals from gold options and technical indicators to evaluate gold’s historical behaviour around all-time-high levels and assess the probability of a correction following record-setting peaks.
Gold Options Show Bullish Bias but Cautious Trading
Source: CME QuikStrike
CME Gold options activity for the October and December expiries reflects a modestly bullish market sentiment, with call interest exceeding put interest.
Most positions are concentrated in December 2025, showing a focus on year-end contracts. Overall, sentiment is positive but cautious, with traders managing short-term risks.
Source: CME QuikStrike
New open interest over the past week has turned sharply cautious, with a notable buildup in put options. While long-term optimism remains, the recent increased put positioning signals emerging downside risks.
Source: CME CVOL
CME Gold volatility has climbed alongside its price surge, although notably the IV spike on 10/Oct (Fri) when Trump announced higher tariffs on China was much smaller than the one observed in April. The skew spike and convexity spike were also smaller than before suggesting less bullish positioning.
Technical signals for Gold futures remain firmly bullish, with short-term moving averages and the MACD reinforcing upward momentum.
RSI indicates overbought conditions, although this typically signals a potential reversal, prices may continue to rise, supported by strong fundamental and macroeconomic factors.
Gold futures traded above the monthly pivot throughout October, breaking past the R1 level on 13/Oct (Mon), signalling a strong ongoing uptrend.
The Accumulation/Distribution indicator shows rising buying pressure since mid-August, peaking on 08/Oct (Wed) before briefly easing and recovering thereafter.
Historical Trends Around All-Time-High Price Level
The rally in gold prices over the past two years has been exceptionally sharp, with few historical parallels. However, similar periods of sustained bullish momentum can be identified. When filtering for occasions in which the RSI exceeded 80 (indicating extreme overbought conditions) and the MACD line rose above 70 (signaling strong, sustained bullish momentum), two notable instances emerge: 2011 and 2020. In both cases, gold reached new all-time highs.
These same technical thresholds were recently triggered again as gold set a new all-time high on 13/Oct (Mon). Historically, such signals followed multi-year rallies characterized by a steady bullish regression trend. At the final stage of each rally, prices broke above the regression trend in a blow-off top pattern.
The recent activation of both extreme bullish signals, along with the breakout above the trend, suggests a similar blow-off top may be forming. In the previous instances, this pattern was followed by immediate corrections: gold prices fell 9% in 2011 and 5.6% in 2020 within a month of setting new highs. It should be noted that past performance is not indicative of future trends.
This content is sponsored.
MARKET DATA
CME Real-time Market Data helps identify trading set-ups and express market views better. If you have futures in your trading portfolio, you can check out on CME Group data plans available that suit your trading needs tradingview.com/cme .
DISCLAIMER
This case study is for educational purposes only and does not constitute investment recommendations or advice. Nor are they used to promote any specific products, or services.
Trading or investment ideas cited here are for illustration only, as an integral part of a case study to demonstrate the fundamental concepts in risk management or trading under the market scenarios being discussed. Please read the FULL DISCLAIMER the link to which is provided in our profile description.

Teacup Chart Pattern — Brewing Bullish MomentumSup, legends! Shall we tea it up? ☕
Today, we’re not just talking about your morning cuppa. We’re diving into something traders get excited about — the Teacup Chart Pattern. Just like a perfect brew, this pattern takes time to form, and knowing how to spot it can make your trading experience much smoother.
What Is the Teacup Chart Pattern?
The teacup chart pattern is a bullish continuation setup that resembles the shape of a tea cup when plotted on a price chart. It typically forms after an extended uptrend, signaling a consolidation phase before the asset resumes its upward trajectory.
Key characteristics of the tea cup pattern include:
A rounded bottom that reflects a gradual shift from selling pressure to buying support.
A slight pullback, known as the "handle," which represents a brief pause or shakeout before the next move.
A breakout above the resistance line at the cup’s rim, often accompanied by strong trading volume.
Anatomy of the Teacup and Handle Pattern
To apply teacup pattern trading effectively, traders must understand the structure:
The Cup – This is the rounded consolidation. It can take several weeks or months to form, depending on the timeframe. A smoother curve is generally considered stronger than a sharp V-shaped recovery.
The Handle – Following the cup’s formation, price action typically retraces slightly, creating a downward or sideways movement. This handle reflects short-term profit-taking and helps “reset” market sentiment.
The Breakout – Once the handle is complete, a breakout above the cup’s rim confirms the tea cup trading pattern and signals renewed bullish momentum.
Trading the Teacup Pattern
When approaching tea cup pattern trading, consider the following strategies:
Entry Point : A common entry is at the breakout above the rim of the cup, once volume confirms the move.
Stop Loss Placement : Traders usually place stops slightly below the handle’s low to minimize downside risk.
Target Projection : The potential price target can be estimated by measuring the depth of the cup and projecting it upward from the breakout point.
Why the Teacup Trading Pattern Works?
The teacup trading pattern embodies market psychology. The rounded cup reflects gradual accumulation, while the handle signals a controlled pullback that shakes out weak hands. When the breakout occurs, it often triggers a surge of buying pressure from both breakout traders and those re-entering the market.
For crypto traders, the tea cup chart pattern is particularly valuable because digital assets are prone to sharp moves. Recognizing this structure early can provide an edge in catching strong upside momentum.
Common Mistakes in Teacup Pattern Trading
Even experienced traders can misinterpret the teacup chart pattern. Some common pitfalls include:
Mistaking a sharp V-shaped rebound for a valid cup formation.
Entering too early, before the handle completes.
Ignoring volume confirmation, which often validates the breakout’s strength.
Patience and discipline are critical in successfully applying the tea cup pattern trading strategy.
Final Thoughts
The teacup and handle pattern is one of those OG bullish setups in crypto that just works when you read it right. Think of it as the market taking a chill before the next leg up. You spot the rounded cup, wait out that handle fake-out, and when volume kicks in — that’s your green light.
With crypto’s crazy volatility, the teacup trading pattern can be a solid way to catch continuation moves and ride some serious momentum. Just don’t ape in blind — always stack confirmations. Watch the volume, line it up with MAs or momentum tools, and filter out the noise. The pattern’s strong, but context is king if you don’t wanna get trapped in a fake breakout.

how i Predicted Bitcoin’s Historic crash“Sometimes, structure speaks louder than sentiment.”
When markets erupted after the Trump tariff tweetstorm and global risk sentiment turned on its head, Bitcoin experienced one of the sharpest liquidations in months. Traders across social media called it “impossible to predict” but the chart structure had already told the story.
This was my before chart, posted days prior to the collapse.
Price was trading around $121,000, testing a clear supply and demand confluence point (CP) at $123,796.00.
On the multi-timeframe framework (MTFA), several elements aligned:
Supply Zone overlapping with prior intraday imbalance
Fib retracement confluence of 61.8% and 50.0%, measured from the intraday swing high at $126,296.00 and swing low at $120,636.00
Price rejection wicks indicating institutional distribution activity
Liquidity pool between $121,115.33 and $121,523.68 acting as the near-term trap for late longs
This setup hinted at exhaustion of bullish momentum and possible short-term reversal.
⚙️ MTFA in Action: Reading Structure Across Timeframes
Multi-Timeframe Analysis (MTFA) isn’t about random levels, it’s about how structure nests across time horizons.
Weekly: Showed exhaustion candles near prior all-time highs (ATH) and extended momentum.
Daily: Confirmed lower-high formation inside distribution range.
4H: Provided precise entry trigger wick rejection at supply and liquidity sweep confirmation.
Even though a full OCHL close below liquidity hadn’t yet formed, the reaction wicks at the confluence zone were the early footprint of bears reclaiming control.
💥 Then It Happened
When the U.S. announced 100% tariffs on Chinese imports, markets sold off aggressively. Bitcoin followed suit cascading below liquidity, slicing through $118K, and finally tagging the $115,000 demand zone target drawn days before.
What most called a “black swan”, the chart had already mapped out.
📈 Lessons from the Setup
Structure leads news. Fundamentals create fuel; technical structure shows where it burns.
MTFA reveals timing. Without alignment across timeframes, entries lose context.
Respect confluence. When supply, fib, and liquidity all align probability spikes.
🔮 Looking Ahead
While Bitcoin later stabilized after the crash, the precision of this setup reinforced why chart structure remains the language of the market.
This was more than a trade, it was a live case study in how multi-timeframe logic captures market behavior before headlines do.
the analysis can be found on the 3rd section of the publication :
✍️ Final Nerdy Thoughts
This analysis wasn’t luck; it was structure.
Whether Bitcoin continues consolidating or seeks new highs, the “Trade of the Year” stands as proof that when fundamentals collide with perfect technical alignment, history doesn’t repeat, it rhymes in price action.
put together by : Pako Phutietsile as @currencynerd
Risk Management Rules That Save AccountsSummary
You lower impulsive errors at the open by running a one minute pre market checklist that begins with a threat label. You then walk five gates for news, volatility, risk, size, and stop. The routine is simple, fast, and repeatable. It creates a small pause that shifts you from emotional reaction to planned execution. This is education and analytics only.
Decision architecture under stress . Name it to tame it. A short written label reduces limbic reactivity and gives the planning system a window of control.
Why this matters
Most bad sessions begin before the first click. Fatigue, caffeine spikes, fear of missing out, and a cluttered screen push the brain toward shortcuts. The checklist gives you a tiny container of time where you look at the day with clear eyes. One minute is enough. The goal is not perfection. The goal is a stable entry state and a hard off switch when risk boundaries are reached.
The one minute routine
Threat label . Write one sentence that names your current state in plain language. Example: Slept five hours, feel rushed, second coffee, mild anxiety. This is affect labeling.
News gate . Scan the calendar for high impact items. Decide if size is reduced or if a filter is active around event times.
Volatility gate . Classify the regime as normal or high by reading average true range or a recent range. High regime shrinks size and widens stop distance inside your plan.
Risk gate . Confirm risk per trade, the max daily loss, and the rule that stops new entries for the day.
Session gate . Choose your focus window. Define a time box. Write one line that states your setup and the review point.
Principle one — the threat label
The label is short, neutral, and written. You are not trying to be poetic. You are moving the experience from the body into words so that attention can be allocated with intent. Include four elements.
Sleep . Hours and quality. Broken sleep counts as low quality.
Fatigue . Subjective rating from 1 to 5 where 3 is workable.
Stimulants . Caffeine count and timing. Early heavy intake tends to raise urgency.
Emotion . One word such as calm, rushed, irritated, fearful, confident.
Add a mood score from 1 to 5. If the score is 1 or 2 you move to simulation or wait fifteen minutes after the open. If the score is 3 or higher you can proceed with the five gates at reduced size when the day feels heavy. The act of naming is not a cure. It is a lever that opens a window where better choices are available.
Principle two — breathing as a switch
Use a physiological sigh or box breathing for sixty seconds when arousal is high.
Physiological sigh: inhale through the nose, take a short second inhale to top off, then exhale slowly through the mouth. Repeat five times.
Box breathing: inhale for four, hold for four, exhale for four, hold for four. Repeat for one minute.
This is not about relaxation. It is about coming back to a steady baseline so that the gates can be applied without haste.
Principle three — time boxing and two strike control
Time without boundaries invites drift. Choose a primary window. Add a two strike rule. Two avoidable mistakes or two full stops and you switch to review mode. This is a hard rule. You can always restart in simulation. The account does not need you to win today. It needs you to preserve optionality for tomorrow.
The five gates in depth
Gate 1. Threat label details
Format . One sentence. Neutral tone. No judgment.
Signal . If the label uses words like frantic, desperate, angry, or invincible you reduce size or you step back. Extreme emotion is a red flag.
Action . If the label is heavy, attach a micro plan. Example: Watch the first range print, take one A quality setup only, then review.
Why it works. The label hijacks the loop that pairs sensation with urgency. By assigning words you create distance. Distance allows choice. Choice reduces error.
Gate 2. News gate details
Scan . Look for clustered items such as inflation prints, policy statements, or employment data.
Filter . If an item is imminent you set a no trade buffer around it. Five minutes is a good default for the day session. Longer buffers can be used when events are central to the day.
Size . On days with dense events you run smaller. Your goal is survival and clarity, not heroics.
Reasoning. Event periods change the distribution of short term outcomes. The checklist assumes there are times to engage and times to wait. Waiting is a skill.
Gate 3. Volatility gate details
Classification . Use a simple rule such as normal regime when the rolling range is near its median and high regime when it is in the upper quartile. You do not need complex math here.
Translation . High regime implies half size and wider stops within your plan. Normal regime allows baseline size and standard stops.
Exit awareness . Volatility is not a gift and not a threat. It is a condition. When it is extreme your first task is to avoid clips that come from noise.
The psychology note. When volatility rises your heart rate rises and the mind searches for action. The gate reminds you that you do not need to swing at every pitch. You need to scale your effort to the environment.
Gate 4. Risk gate details
Risk per trade . Choose a range that respects your current skill. Many traders use values between 0.25 percent and 0.50 percent while they build consistency. Use your data.
Max daily loss . Choose a hard cap between 1.5 percent and 2.5 percent. The exact figure is less important than the enforcement.
Stop trading rule . When the max is reached you stop. You move to review mode. You do not attempt a last minute rescue. You treat tomorrow as a fresh session.
Psychology note. Most blowups do not come from one bad idea. They come from the refusal to stop when the day is off. The risk gate eliminates that refusal by binding action to a predefined boundary.
Gate 5. Session gate details
Focus . Choose one session. Focus beats breadth. Split focus is a silent drain.
Window . Define the first hour as your primary window and stick to it. The goal is quality not quantity.
Written micro plan . One line that states what you are allowed to take. One line that states when you stand down.
Time discipline creates high quality boredom. High quality boredom is where patience grows.
The one minute card
Copy this card and keep it next to your screen.
Threat label: Today I feel … because …
Mood 1 to 5: __
Sleep hours: __
Caffeine cups: __
Five gates
News: list items and times.
Volatility: normal or high.
Risk: risk per trade and max daily loss.
Size: full or half.
Stop: exit rule and stop trading rule.
Session plan
Primary session: __
Window: first sixty minutes
Setup: described in one line
Review: five notes after the first trade
Bias management
Your checklist doubles as a bias tracker. Below are common traps and their counters.
Fomo . The urge to enter early because price is moving. Counter : read your session plan line out loud and wait for the condition that defines your setup.
Revenge . The urge to win back a loss. Counter : two strike rule. After two avoidable errors you switch to review.
Confirmation . The habit of seeking only data that supports the current idea. Counter : write one invalidation condition in your micro plan before each entry.
Sunk cost . Staying with a poor position because time and effort were invested. Counter : use structure based exits and honor them without debate.
Outcome bias . Judging process by result. Counter : score the decision quality in your journal independent of profit and loss.
Recency . Overweighting the last outcome. Counter : review three prior similar sessions before the open.
Anchoring . Fixating on a number seen early. Counter : update levels using the most recent structure and ranges.
Gambler fallacy . Expecting balance in small samples. Counter : treat each setup as independent and sized by plan.
Environment design
Your surroundings push behavior. Design them on purpose.
Screen hygiene . Close unrelated tabs. Remove flashing items. Keep only the chart, the calendar, and your checklist.
Desk card . Print the one minute card. Physical presence increases compliance.
Timer . Use a simple timer for your first window. When it ends you review by default before you extend.
Journal access . Keep the journal one click away. Reduce friction to writing.
Standing rule sheet . Place the two strike rule and the max daily loss in large font at eye level.
Journal method
A short consistent journal beats a long sporadic one. Use five lines per session.
Threat label . Copy the exact sentence you wrote.
Gate notes . News, volatility classification, risk settings, session window.
Two key decisions . What you took and why.
Discipline score . Rate from 1 to 5 based on process quality.
Next session intent . One line that you can act on tomorrow.
Once a week add a short review.
Count how many times the max daily loss was hit.
Count how many sessions began with a score of 1 or 2 and what you did in response.
Note one pattern you want more of and one behavior you want less of.
Comparator — checklist day versus reactive day
A checklist day has five visible differences.
Entries occur inside the written setup line rather than outside of it.
Size reflects volatility classification rather than emotion.
News windows are respected rather than ignored.
The two strike rule switches you to review rather than escalation.
Post session notes exist and inform the next session.
A reactive day shows the opposite pattern. You can measure this. Track three numbers for a month.
Number of impulsive entries per session.
Number of max daily loss hits per week.
Average emotional intensity rating captured in the first five minutes of the session.
Expect the checklist month to show fewer impulsive entries, fewer max loss days, and lower opening intensity. The goal is stable execution and preserved capital for learning.
Scenarios and how to apply the gates
Low sleep morning
Threat label notes low sleep and mild irritability. Mood 2.
Action is simulation or a fifteen minute wait after the open. Coffee is delayed. You observe the first range and journal one line without taking risk.
Outcome is a cleaner state for the second half of the hour or a full stand down without regret.
Clustered event day
Threat label notes excitement and urgency.
News gate shows several items within the first hour. Filter is applied. Size is reduced.
Two strike rule is activated with extra caution due to the environment.
High volatility regime
Volatility gate classifies the day as high using a simple rolling range rule.
Size is cut in half. Stops are placed at a distance that matches the regime inside your plan.
You aim for one A quality setup and then you review.
Emotional drift after early win
Threat label catches the rise of euphoria and the phrase I can push it.
Risk gate reminds you that risk per trade remains constant. Size does not increase without a monthly review and data.
You write a single intent line to protect the day from giving back an early gain.
Emotional drift after early loss
Threat label captures frustration and the urge to get it back.
You pause for a breathing cycle. You re read the setup line. You allow the next clean condition or you stop.
If you reach two avoidable errors you switch to review mode by rule.
Building the habit
Habits form when three conditions exist. A cue, a simple action, and a visible reward.
Cue . The first launch of your platform is the cue. The card sits in front of the keyboard.
Action . You write the threat label and walk the five gates. It takes one minute.
Reward . You check off a visible box on a small tracker. Ten sessions completed equals a micro reward of your choice that does not increase arousal.
Use streak tracking. Breaking a streak is a useful signal. Ask why with curiosity, not shame.
Risk of ruin as a psychological anchor
Ruin is the end of the game. You reduce ruin probability by keeping the max daily loss small, by sizing positions inside your plan, and by cutting activity when the state is poor. The checklist operationalizes this. You do not need to compute formulas every morning. You need to enforce boundaries in real time.
Plain language rules you can post above your monitor
Write a threat label before the open.
Respect event windows without exception.
Match size to volatility.
Stop at the max daily loss.
Run a small time box and review by default when it ends.
Metrics that keep you honest
Track the following numbers each week.
Sessions with the card completed.
Sessions that reached the max daily loss.
Impulsive entries per session.
Average mood score at the open.
Average discipline score at the close.
Make a tiny table with ten rows that covers two weeks. This takes five minutes and will reveal whether the checklist is real or theater.
Frequently asked questions
Can I apply this to longer timeframes
Yes. The gates do not change. Only the windows change. The principle remains the same. Protect the mind, protect the account, and execute the plan.
Should I scale size after a win
No, not inside the day. Size changes are a monthly decision informed by data and by a stable discipline score. Day level changes usually reflect emotion rather than edge.
What if fear is very high
Use one cycle of the physiological sigh and one cycle of box breathing. Write the label. If the score remains 1 or 2 your best decision is to observe and learn without risk.
What if I fail the routine for a week
Do a small reset. Print a fresh card. Shorten the window. Reduce goals. Your only task is to complete the card for three sessions in a row.
What about accountability
Share your five line journal with one trusted peer. No opinions. No trade calls. Only the five lines. This light social pressure improves compliance.
Risks and failure modes
Liquidity pockets . Thin periods can distort short term structure. The solution is to reduce activity rather than to force entries.
Event clusters . When several items land in the same session, conditions can whipsaw. The solution is to go smaller or to wait for the post event phase.
Emotional drift . After two losses the urge to fight rises. The solution is the two strike rule and a physical walk away trigger.
Overfitting the checklist . A card with twenty questions will not be used. Keep it at one minute.
Rationalization . The mind can twist rules in real time. The solution is to write numbers before the session and follow them when it is hardest.
From routine to identity
Behavior sticks when it becomes who you are. You can call yourself a routine first trader. That means you respect the card before you respect your opinions. You can call yourself a review first trader. That means you treat the journal as part of the session rather than an afterthought. Identity makes rules easier to keep because breaking them feels like breaking character.
Closing summary
The pre market checklist is a small lever with large impact. You begin with a written threat label that pulls emotion into words. You pass five gates that cover news, volatility, risk, size, and stop. You work inside a time box and you accept the two strike rule. You record five lines and you adjust week by week. There is no promise of profit. There is only the reliable reduction of avoidable errors and the protection of your decision making capacity. The rest follows from consistent behavior over time.
Education and analytics only. Not investment advice. No performance promises.
Understanding the Money Flow in the Coin Market
Hello, fellow traders!
Follow me to get the latest information quickly.
Have a great day!
-------------------------------------
(USDT 1D Chart)
(USDC 1D Chart)
I believe that USDT and USDC show a gap up trend when funds flow into the coin market, and a gap down trend when funds flow out.
Therefore, unless the gap turns into a downtrend, the coin market is expected to maintain its upward trend.
-
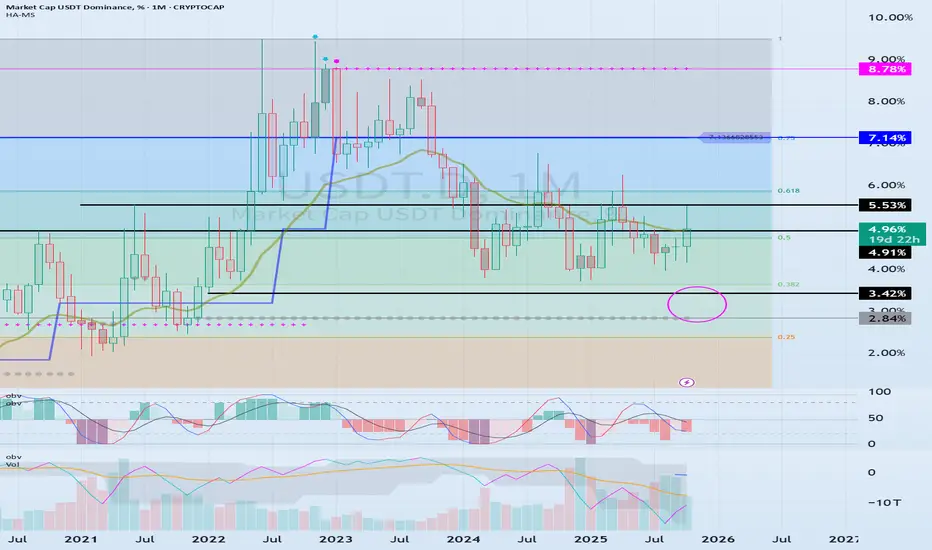
(USDT.D 1D Chart)
(1M Chart)
As funds flow into and out of the coin market through USDT and USDC, USDT dominance is likely to ultimately rise.
However, I believe that the funds (USDT, USDC) flowing into the coin market will change dominance through trading.
In other words, if USDT dominance declines, the coin market is likely to trend upward.
This is because coins (tokens) are being purchased with USDT.
If USDT dominance remains below 4.91 or declines, the coin market is likely to trend upward.
Therefore, if USDT dominance rises without any evidence of fund outflows through USDT or USDC, it can be interpreted as a temporary increase in selling pressure.
If USDT or USDC gaps downward in this situation, the price will fail to defend, leading to a downward trend in the coin market.
Therefore, it's best to look at the USDT and USDT.D charts to understand the general flow of funds.
-
(BTC.D 1D chart)
(1M chart)
I believe BTC dominance reflects the relationship with altcoins, rather than the rise or fall of the coin market or the rise and fall of BTC itself.
In other words, rising BTC dominance indicates a concentration of funds toward BTC, increasing the likelihood that altcoins will gradually move sideways or experience a downward trend.
Therefore, for an altcoin bull market to begin, it must remain below 55.01-62.47 or show a downward trend.
Therefore, it is recommended to check BTC dominance before trading altcoins and develop a trading strategy.
--------------------------------------------------
Summary of the above:
For the coin market to continue its bull market,
1. USDT and USDC must maintain a gaping upward trend.
2. USDT dominance should decline below 4.91.
3. BTC dominance should decline below 55.01.
-
Thank you for reading.
I wish you successful trading.
--------------------------------------------------
Carbon Credits and ESG Futures in Trading1. Understanding Carbon Credits
1.1 What Are Carbon Credits?
A carbon credit represents a certificate that allows the holder to emit one metric ton of carbon dioxide (CO₂) or its equivalent in other greenhouse gases (GHGs). The system emerged under the Kyoto Protocol (1997) and later expanded through the Paris Agreement (2015), as nations agreed to cap emissions and trade carbon units as a market-based solution to climate change.
There are two main types of carbon markets:
Compliance Markets: Regulated by national or regional governments, where entities must adhere to emission caps. Examples include the EU Emissions Trading System (EU ETS) and California Cap-and-Trade Program.
Voluntary Markets: Corporations and individuals purchase carbon credits to offset their emissions voluntarily. These markets are less regulated but rapidly growing, driven by corporate net-zero commitments.
Each carbon credit signifies a verified reduction or removal of greenhouse gases—achieved through reforestation, renewable energy projects, carbon capture, or energy efficiency programs.
1.2 The Mechanics of Carbon Trading
Carbon trading operates on a “cap-and-trade” principle. Governments or international bodies set a limit (cap) on total emissions allowed. Companies receive or buy emission allowances and can trade them based on their performance:
Emit less than their allowance: The company can sell excess credits for profit.
Emit more than their allowance: The company must buy additional credits or face penalties.
This mechanism incentivizes industries to innovate, cut emissions, and invest in green technologies. Market prices fluctuate based on supply, demand, and policy shifts—similar to commodities or financial assets.
1.3 Growth of Carbon Credit Markets
Global carbon markets have grown exponentially. According to the World Bank’s State and Trends of Carbon Pricing 2024, over 73 carbon pricing initiatives are now in operation worldwide, covering 23% of global emissions. The EU ETS remains the largest, with carbon prices crossing €80 per ton in 2024.
Meanwhile, voluntary carbon markets (VCMs) are expanding, with corporate demand driven by sustainability commitments from firms like Microsoft, Amazon, and Shell. VCMs surpassed $2 billion in annual value by 2024, with projections suggesting potential growth to $50 billion by 2030.
2. ESG Futures: A New Dimension in Sustainable Trading
2.1 Defining ESG Futures
ESG futures are derivative contracts that allow investors to gain or hedge exposure to companies or indices with high ESG ratings. These futures mirror traditional equity index futures but are based on ESG-screened indices, such as the S&P 500 ESG Index or MSCI ESG Leaders Index.
By trading ESG futures, investors can align portfolios with sustainability values while maintaining liquidity and risk management capabilities. These instruments also encourage companies to improve ESG performance to attract capital.
2.2 Evolution of ESG Derivatives
The concept of ESG-linked derivatives emerged in the late 2010s. The Eurex Exchange launched the first ESG futures in 2019, tracking the STOXX Europe 600 ESG-X Index. Since then, exchanges like CME Group, NASDAQ, and ICE have introduced ESG-linked futures and options.
These products have gained momentum as global investors, including pension funds and sovereign wealth funds, prioritize sustainability. By 2024, ESG derivative volumes exceeded $200 billion, reflecting strong institutional demand for green financial instruments.
2.3 Mechanics of ESG Futures
ESG futures function similarly to equity index futures:
Underlying Asset: ESG-screened index or basket of sustainable companies.
Contract Size: Typically based on a fixed multiple of the index level.
Settlement: Usually cash-settled at contract expiration.
Trading Purpose: Speculation, hedging, or portfolio alignment with ESG principles.
Traders can go long on ESG futures to express bullish sentiment on sustainable companies or short to hedge existing ESG exposures. They offer transparency, liquidity, and alignment with responsible investment mandates.
3. Intersection of Carbon Credits and ESG Futures
The convergence of carbon credits and ESG futures represents a powerful evolution in sustainable finance. While carbon credits directly incentivize emission reduction, ESG futures provide a broader investment framework that integrates environmental responsibility into financial markets.
Investors are increasingly using carbon intensity metrics within ESG models, linking corporate emission performance to financial instruments. Companies that effectively manage carbon risks often score higher on ESG indices, thereby influencing their inclusion in ESG futures benchmarks.
Moreover, hybrid instruments such as “carbon-neutral futures” are emerging—contracts that offset trading emissions through carbon credit purchases, symbolizing the fusion of environmental and financial innovation.
4. Role of Financial Institutions and Exchanges
4.1 Exchange Innovations
Major exchanges are leading the charge in green trading:
CME Group launched Nature-Based Global Emissions Offsets (N-GEO) and Global Emissions Offset (GEO) futures.
Eurex expanded its ESG product suite to include ESG-X and Low Carbon Index futures.
ICE (Intercontinental Exchange) operates one of the largest carbon trading platforms, integrating compliance and voluntary markets.
These platforms enhance price discovery, transparency, and global participation in carbon and ESG markets.
4.2 Institutional Involvement
Institutional investors are pivotal in driving demand for sustainable instruments. Asset managers, insurers, and pension funds are integrating ESG futures and carbon pricing mechanisms into their asset allocation models.
For instance, BlackRock, Vanguard, and UBS have expanded ESG investment portfolios that utilize derivatives for risk management and exposure optimization. Banks, including Goldman Sachs and HSBC, now facilitate carbon trading desks to meet corporate demand for offset solutions.
5. Benefits of Carbon and ESG Trading
Environmental Impact: Encourages carbon reduction and sustainable practices across industries.
Market Efficiency: Introduces price signals for emissions and sustainability, guiding capital allocation.
Portfolio Diversification: Provides new asset classes and hedging opportunities.
Corporate Accountability: Promotes transparency in reporting and responsible governance.
Economic Opportunity: Creates green jobs, investment opportunities, and technology innovation.
6. Challenges and Criticisms
Despite their promise, carbon and ESG markets face significant challenges:
Greenwashing: Some firms exaggerate sustainability credentials to attract investment.
Standardization Issues: Lack of uniform ESG metrics complicates index construction and comparability.
Verification and Integrity: In carbon markets, concerns persist about double-counting and unreliable offsets.
Market Volatility: Regulatory shifts and geopolitical tensions can cause price instability.
Accessibility: Developing nations often struggle to access or benefit equally from carbon finance.
Regulatory bodies such as the International Organization of Securities Commissions (IOSCO) and the Task Force on Climate-related Financial Disclosures (TCFD) are working to address these gaps by promoting transparency and accountability.
7. Global Policy and Regulatory Landscape
The regulatory framework supporting carbon and ESG trading is expanding globally:
European Union: The EU ETS remains the backbone of global carbon pricing, complemented by the Corporate Sustainability Reporting Directive (CSRD).
United States: The CFTC and SEC are enhancing ESG disclosure requirements, while regional carbon markets continue to grow.
Asia-Pacific: China’s national carbon market, launched in 2021, now covers over 4 billion tons of emissions annually.
India: Introduced a Carbon Credit Trading Scheme (CCTS) in 2023, marking a major step in sustainable finance integration.
These initiatives ensure that markets remain transparent, fair, and aligned with climate commitments.
8. The Role of Technology in ESG and Carbon Trading
Digital innovation is revolutionizing sustainable finance. Blockchain ensures traceability of carbon credits, preventing fraud and double-counting. Platforms such as KlimaDAO and Toucan Protocol are tokenizing carbon credits, enabling decentralized trading.
Artificial Intelligence (AI) and Big Data enhance ESG scoring accuracy and climate risk modeling. Meanwhile, satellite monitoring verifies emission reductions from forestry and land-use projects, improving credit integrity.
Such technologies are vital for scaling carbon and ESG markets while maintaining credibility.
9. Future Outlook: The Path Toward Sustainable Markets
The future of trading will be deeply intertwined with sustainability principles. As the global push toward net-zero intensifies, carbon credits and ESG futures are expected to become mainstream financial instruments.
Experts forecast that by 2030, carbon prices may exceed $100 per ton, making emissions a significant financial consideration. Similarly, ESG-linked derivatives are projected to grow tenfold, as investors demand transparency and alignment with global sustainability goals.
Financial systems are transitioning from short-term profit maximization to long-term value creation, balancing climate impact with economic growth. This shift signifies a new era where environmental performance becomes a financial advantage.
10. Conclusion
The fusion of carbon credits and ESG futures represents a defining transformation in global trading. No longer are sustainability and finance separate domains; they are now deeply interconnected. Carbon markets internalize the cost of pollution, while ESG futures reward ethical, responsible behavior.
As nations, corporations, and investors rally behind net-zero ambitions, these markets will play a pivotal role in reallocating capital toward green growth. Challenges remain—standardization, transparency, and global equity—but innovation and regulation are steadily bridging these gaps.
Ultimately, the rise of carbon credits and ESG futures marks the dawn of sustainable capitalism—where financial prosperity and planetary well-being move hand in hand. The traders and investors who embrace this paradigm will not only capture economic returns but also contribute to the preservation of the planet for future generations.
THE ULTIMATE CHESS MATCH...THE FINANCIAL MARKETSHey hey everybody JosePips here!!! Just wanted to drop a fire video about how we as retail traders should be approaching these markets, what they truly represent, & how we are witnessing the ultimate chess match take place...so let's dive in to what I go through in this video
1. The mindset behind the markets: People & Money
2. What the markets represent: the ultimate chess match
3. The chess match between buyers & sellers
4. The RETAIL ADVANTAGE: 3rd party witnesses
5. The business of the markets
6. How WE as RETAIL participants can UTILIZE this chess match to create our trading/business decisions with PROBABILITY
OK guys! I dropped some heat in this video! Hope you all enjoy & REMEMBER...EMOTIONAL trading is not trading..it's just hope :)
Cheers!!

Something worth learning Black lines on the chart are zones
Purple lines on the chart are trendlines
If you connect the blue circle on the chart you can see how they align with zones and trendlines you can use them for xtra confluence
If you look at the chart you'll some blue circle that consists of trendline touch + zones + candle patterns
Having 2 or 3 xtra confirmation can also help you win more trades
Take a screenshot
Connect the blue circle + trendlines + zones together and it all make sense
Drop your thoughts on the comments

Is the Bitcoin market bearish?📊 Bitcoin Market Psychology Analysis
Market psychology analysis is one of the most fascinating and practical approaches to understanding Bitcoin's current position! 🎯
🎭 Market Psychology Cycle Phases:
1. Hope Phase 🟦
Likely the current point for many assets
· 📈 Description: After a panic-driven crash, the market stabilizes and consolidates within a relatively stable range
· 💰 Price hasn't returned to previous lows and shows occasional small positive breakouts
· 😌 Sentiment: Fatigue from the downturn, but quiet hope for gradual improvement
· 👴 Experienced investors accumulate while newcomers remain cautious
· 📊 Indicator: Moderate trading volume typically
2. Optimism & Belief Phase 🟩
· 🚀 Description: Price begins breaking key resistance levels
· 📰 Media gradually starts paying attention again
· 😨 Sentiment: FOMO (Fear Of Missing Out) among experienced investors
· 😞 Regret over selling at the bottom
· 📈 Indicator: Beginning of increasing trading volume
3. Greed & Euphoria Phase 🟨
· 📈 Description: Full-blown bullish phase - price rises consistently and rapidly
· 🗞️ Positive news dominates everywhere
· 👥 Friends and acquaintances talk about massive profits
· 💭 Sentiment: Belief that "this time it's different" and "price only goes up"
· 💸 Greed for more profits and borrowing to buy
· 📊 Indicator: Very high trading volume and positive media coverage
4. Denial Phase 🟧 - Danger Point!
· 📉 Description: Price falls from the peak
· 🤦 Many investors consider this just a "temporary correction"
· 🔮 Expect a return to the peak
· ❌ Sentiment: Strong denial
· 🛒 Buying during the decline hoping for recovery
· 📊 Indicator: Trading volume remains high
5. Fear, Panic & Capitulation Phase 🟥
· 🚨 Description: Sharp and rapid decline
· 📉 Price experiences consecutive breakdowns
· 😱 Sentiment: Intense fear, panic selling
· 💔 Acceptance of heavy losses - absolute despair
· 📊 Indicator: Very high selling volume
6. Apathy & Depression Phase ⬜
· 😴 Description: Market remains stagnant with low volatility for extended periods
· 💤 Prices are low and boring
· 🚫 Sentiment: Complete disinterest in the market
· 👋 Most people have accepted defeat and exited the market
· ☠️ Talk of "Bitcoin's death" resurfaces
· 📊 Indicator: Very low trading volume and minimal media attention
---
💡 Golden Insight:
Understanding these phases can help you make the best trading decisions! ✨
---
📌 Market Psychology + Technical Analysis = Trading Success 🚀
---
💬 Let's Interact!
I'd love to hear your thoughts! 👇
· 🤔 Which phase do you think we're currently in?
· 📊 What's your market outlook for the coming months?
· 💭 Share your technical analysis perspective
· 🎯 Have you used market psychology in your trading strategy?
· 📉 What indicators do you find most reliable?
· 💡 Any successful trades based on market sentiment?
· 🔮 Where do you see Bitcoin in the next 6 months?
Let's learn from each other! Share your comments and analysis below 👇
Your experience and insights are valuable - let's build our trading knowledge together! 🌟
Feel free to ask any questions or share your trading experiences! 💪

How to Trade with Stochastics in TradingViewMaster Stochastics using TradingView’s charting tools in this comprehensive tutorial from Optimus Futures.
The Stochastic Oscillator is a momentum indicator that helps traders identify potential turning points in the market by comparing the current closing price to the recent high–low range. It’s designed to show when momentum may be shifting from buyers to sellers — or vice versa.
What You’ll Learn:
- Understanding the Stochastic Oscillator as a momentum tool plotted from 0 to 100
- How the %K line represents the current close relative to the recent high–low range
- How the %D line acts as a moving average of %K and serves as a signal line
- Key thresholds: readings above 80 suggest overbought conditions, while below 20 suggest oversold conditions
- Why overbought and oversold levels are not automatic buy or sell signals — and how strong trends can keep Stochastics extended
- Identifying bullish and bearish crossovers between %K and %D
- Spotting bullish and bearish divergence between price and momentum
- Using Stochastics to confirm trend direction across different timeframes
- How to add Stochastics on TradingView via the Indicators menu
- Understanding the default settings (14, 3, 3) and how adjusting them affects responsiveness
- Practical examples on the E-mini S&P 500 futures chart
- Applying Stochastics across multiple timeframes — daily, weekly, or intraday — for confirmation signals
This tutorial will benefit futures traders, swing traders, and technical analysts who want to incorporate Stochastics into their trading process.
The concepts covered may help you identify momentum shifts, potential reversal zones, and trend confirmations across different markets and timeframes.
Learn more about futures trading with TradingView:
optimusfutures.com
Disclaimer
There is a substantial risk of loss in futures trading. Past performance is not indicative of future results. Please trade only with risk capital. We are not responsible for any third-party links, comments, or content shared on TradingView. Any opinions, links, or messages posted by users on TradingView do not represent our views or recommendations. Please exercise your own judgment and due diligence when engaging with any external content or user commentary.
This video represents the opinion of Optimus Futures and is intended for educational purposes only.
Chart interpretations are presented solely to illustrate objective technical concepts and should not be viewed as predictive of future market behavior. In our opinion, charts are analytical tools — not forecasting instruments.

The Market Crash Friday was NOT what you have been told.The stock market crash was blamed on many things but NONE are true.
The reason why the stock market had a huge run down on Friday was due to
a VOID of BUYERS.
Who were the buyers???
You will never guess.
It was the 436 of the SP 500 companies that have buybacks underway, newly created, or open ended. Corporations have been supporting their own individual stock price.
WHY? To maintain their Market Cap during stressed market times.
To improve their dividend yield for the Buy Side Institutions who many 145 trillion dollars of assets and who own the bulk of those companies stock.
To keep their stock from dropping further on retail news.
Why did the corporations stop buying their stock on Friday?
Because the Earnings Season is getting underway this week and they stop buybacks to avoid a conflict of interest or other regulatory situations from buyin back shares during or before their CEO reports.
The corporations are likely to resume their accumulation a week or so after their CEO guidance and reports.

Usdcad Usdcad form a change of character in 4 hrs chart without collecting liquidity creating a selling narrative


HOW-TO: Forecast Next-Bar Odds with Markov ProbCast🎯 Goal
In 5 minutes, you’ll add Markov ProbCast to a chart, calibrate the “big-move” threshold θ for your instrument/timeframe, and learn how to read the next-bar probabilities and regime signals
(🟩 Calm | 🟧 Neutral | 🟥 Volatile).
🧩 Add & basic setup
Open any chart and timeframe you trade.
Add Markov ProbCast — P(next-bar) Forecast Panel from the Public Library (search “Markov ProbCast”).
Inputs (recommended starting point):
• Returns: Log
• Include Volume (z-score): On (Lookback = 60)
• Include Range (HL/PrevClose): On
• Rolling window N (transitions): 90
• θ as percent: start at 0.5% (we’ll calibrate next)
• Freeze forecast at last close: On (stable readings)
• Display: leave plots/partition/samples On
📏 Calibrate θ (2-minute method)
Pick θ so the “>+θ” bucket truly flags meaningful bars for your market & timeframe. Try:
• If intraday majors / large caps: θ ≈ 0.2%–0.6% on 1–5m; 0.3%–0.8% on 15–60m.
• If high-vol crypto / small caps: θ ≈ 0.5%–1.5% on 1–5m; 0.8%–2.0% on 15–60m.
Then watch the Partition row for a day: if the “>+θ” bucket is almost never triggered, lower θ a bit; if it’s firing constantly, raise θ. Aim so “>+θ” captures move sizes you actually care about.
📖 Read the panel (what the numbers mean)
• P(next r > 0) : Directional tilt for the very next candle.
• P(next r > +θ) : Odds of a “big” upside move beyond your θ.
• P(next r < −θ) : Odds of a “big” downside move.
• Partition (>+θ | 0..+θ | −θ..0 | <−θ): Four buckets that ≈ sum to 100%.
• Next Regime Probs : Chance the market flips to 🟩 Calm / 🟧 Neutral / 🟥 Volatile next bar.
• Samples : How many historical next-bar examples fed each next-state estimate (confidence cue).
Note: Heavy calculations update on confirmed bars; with “Freeze” on, values won’t flicker intrabar.
📚 Two practical playbooks
Breakout prep
• Watch P(next r > +θ) trending up and staying elevated (e.g., > 25–35%).
• A rising Next Regime: Volatile probability supports expansion context.
• Combine with your trigger (structure break, session open, liquidity sweep).
Mean-reversion defense
• If already long and P(next r < −θ) lifts while Volatile odds rise, consider trimming size, widening stops, or waiting for a better setup.
• Mirror the logic for shorts when P(next r > +θ) lifts.
⚙️ Tuning & tips
• N=90 balances adaptivity and stability. For very fast regimes, try 60; for slower instruments, 120.
• Keep Freeze at close on for cleaner alerts/decisions.
• If Samples are small and values look jumpy, give it time (more bars) or increase N slightly.
🧠 Why this works (the math, briefly)
We learn a 3-state regime and its transition matrix A (A = P(Sₜ₊₁=j | Sₜ=i)), estimate next-bar event odds conditioned on the next state (e.g., q_gt(j)=P(rₜ₊₁>+θ | Sₜ₊₁=j)), then forecast by mixing:
P(event) = Σⱼ A · q(event | next=j).
Laplace/Beta smoothing, per-state sample gating, and unconditional fallbacks keep estimates robust.
❓FAQ
• Why do probabilities change across instruments/timeframes? Different volatility structure → different transitions and conditional odds.
• Why do I sometimes see “…” or NA? Not enough recent samples for a next-state; the tool falls back until data accumulate.
• Can I use it standalone? It’s a context/forecast panel—pair it with your entry/exit rules and risk management.
📣 Want more?
If you’d like an edition with alerts , σ-based θ, quantile regime cutoffs, and a compact ribbon—or a full strategy that uses these probabilities for entries, filters, and sizing—please Like this post and comment “Pro” or “Strategy”. Your feedback decides what we release next.
#AN025: Gaza, Truce, End of Hostilities, and Forex Impact
After two years of war, the truce between Israel and Hamas has held for several consecutive days, and international leaders are establishing a political path that, in the words of US President Donald Trump, "marks the end of the war." Hello, I'm Forex Trader Andrea Russo, an independent trader and prop trader with currently $200,000 in capital under management. Thank you in advance for your time.
The package includes hostage and prisoner exchanges, gradual Israeli withdrawals, a reconstruction summit, and a transitional governance architecture for Gaza. The pillars of humanitarian aid are being reshaped: the United Kingdom has announced new funds, the UN is preparing to increase convoys, and some "parallel" distribution infrastructure is being dismantled under the umbrella of the truce.
The Naval Interlude: What Was the "Sumud Flotilla" and How Did It End?
In 2025, a coalition of civilian networks (Freedom Flotilla Coalition, Global Movement to Gaza, and others) coordinated the Global Sumud Flotilla, a large-scale attempt to open a maritime corridor to Gaza and circumvent the Israeli blockade. The vessels were repeatedly intercepted on the high seas by the Israeli navy; dozens of activists were detained and then transferred out of the country, while the last vessels were blocked in early October. The campaign, dubbed "Sumud" (resilience), effectively ended with the interception of the last group, while the truce was taking shape on the ground.
Why does it matter to the markets? Because the sum of the truce and the halt to the "breakthrough" naval dimension compressed, in just a few days, the "Middle East risk premium" priced in currencies, stocks, and oil—one of the drivers that had fueled periods of risk aversion over the past two years. Reuters
Short-Term Effects on Forex
-Shekel (USD/ILS)
The first (and most intuitive) reaction came from the shekel: news of the ceasefire agreement and the political path triggered a sharp strengthening of the ILS, with a simultaneous rebound in the Tel Aviv Stock Exchange. The "grievous dividend" narrative—truce benefit—quickly gained traction on trading desks.
-Safe Haven Currencies (JPY, CHF) and USD
When geopolitical risk cools, safe haven parking tends to ease. In this period, the JPY picture is complicated by domestic factors (economic policy and the Bank of Japan), which outweighed the "ceasefire" signal, keeping the currency weak/volatile despite a marginal decline in risk aversion. The CHF was less affected by the Middle Eastern theme and remained driven primarily by European flows and yields. The US dollar had a mixed reaction: lower "safe haven" bids, but cyclical support linked to yields and US data.
- Oil and oil-linked currencies (CAD, NOK)
The truce has removed some of the risk premium from Brent/WTI, shifting the focus to macro issues (global demand, OPEC+, US-China trade). The recent slide in crude oil—only partially rebounded—has loosened cyclical support for the CAD and NOK, with diverging reactions depending on local yields and data.

How to find algorithmic levels of support and resistanceUsing repeating pinpoint levels to form meaning of opens and closes around these levels give you an advantage in your analysis.
As price gives us clues to what levels are affecting price, we should mark the new candles that are responding to these levels by breaking and retesting these very levels.
Please let me know your thoughts! 🙏🏾

The Role and Impact of Agencies in Global Finance and Trading1. Understanding the Concept of Agencies in Global Finance
Agencies in global finance refer to both public and private institutions that are entrusted with regulatory, supervisory, analytical, and facilitative roles within the global financial ecosystem. They act as intermediaries between governments, corporations, and investors to ensure that financial activities are conducted fairly and efficiently. The primary types of agencies include:
Regulatory Agencies – Such as the U.S. Securities and Exchange Commission (SEC), the Commodity Futures Trading Commission (CFTC), and the European Securities and Markets Authority (ESMA), which enforce laws and ensure transparency.
Rating Agencies – Institutions like Moody’s, Standard & Poor’s (S&P), and Fitch Ratings that assess the creditworthiness of governments, corporations, and financial instruments.
Monetary Agencies – Central banks and supranational institutions such as the International Monetary Fund (IMF) and the World Bank, which manage monetary policy, financial stability, and economic development.
Trade and Financial Agencies – The World Trade Organization (WTO) and the Bank for International Settlements (BIS) regulate trade practices and provide frameworks for financial cooperation among nations.
Collectively, these agencies influence market confidence, liquidity, capital allocation, and cross-border investment flows — all of which are essential to global trading operations.
2. The Importance of Regulatory Agencies in Global Finance
Regulatory agencies serve as the guardians of financial integrity. Their primary mission is to ensure fair trading practices, prevent manipulation, and maintain investor trust.
2.1 Market Oversight and Investor Protection
Global financial markets operate with vast sums of capital and involve millions of participants. Regulatory agencies impose rules that protect investors from fraud, insider trading, and market abuse. For instance:
The U.S. SEC enforces laws against securities fraud, ensuring corporate transparency through mandatory filings.
The European Securities and Markets Authority (ESMA) harmonizes regulation across EU member states, preventing regulatory arbitrage.
Such oversight helps maintain confidence in the global financial system — a crucial element for the smooth functioning of international trade and investment.
2.2 Maintaining Systemic Stability
Regulatory agencies monitor systemic risks that can destabilize markets. During crises such as the 2008 global financial meltdown, agencies tightened regulations, introduced Basel III norms, and imposed capital adequacy requirements to strengthen banking resilience.
By enforcing these standards, agencies ensure that financial institutions maintain sufficient buffers to withstand shocks, thereby preventing contagion effects across global markets.
2.3 Promoting Fair Competition
Agencies such as the Federal Trade Commission (FTC) in the United States and the European Commission’s Directorate-General for Competition monitor mergers and acquisitions to prevent monopolistic practices. This ensures fair market competition, innovation, and equal opportunity for firms engaged in global trade.
3. Credit Rating Agencies: Shaping Investment Decisions
Credit rating agencies are among the most influential actors in the financial world. Their ratings affect how investors perceive the creditworthiness of sovereign nations, corporations, and financial instruments.
3.1 Role of Credit Ratings in Global Trading
Credit ratings act as signals of financial health. When agencies assign a high rating (e.g., AAA), it implies low risk, encouraging foreign investment and reducing borrowing costs. Conversely, downgrades can trigger capital flight, higher yields, and economic contraction.
For example:
A downgrade of a country’s sovereign debt can increase its cost of borrowing in global markets.
Corporate bond ratings influence investment fund allocations, liquidity, and interest rates.
3.2 Controversies and Global Impact
While ratings are essential, they have also faced criticism. During the 2008 crisis, agencies were accused of inflating ratings on mortgage-backed securities, contributing to the market collapse. Since then, reforms have sought to improve transparency, accountability, and conflict-of-interest management.
Nonetheless, rating agencies continue to be critical in shaping cross-border capital movements and influencing investor sentiment in global trade.
4. Monetary and Financial Agencies: IMF, World Bank, and BIS
4.1 International Monetary Fund (IMF)
The IMF plays a central role in stabilizing the global economy. It provides financial assistance to countries facing balance-of-payments crises, monitors global economic trends, and offers policy advice to foster sustainable growth.
In global trading, the IMF helps maintain exchange rate stability and encourages free trade by ensuring liquidity through its Special Drawing Rights (SDR) mechanism.
4.2 World Bank
The World Bank focuses on long-term economic development and poverty reduction. Through its financial and technical assistance, it facilitates infrastructure development, which in turn boosts trade and investment. Roads, ports, and digital connectivity projects funded by the World Bank enhance global supply chains, promoting smoother trade flows.
4.3 Bank for International Settlements (BIS)
Known as the “central bank of central banks”, BIS fosters international monetary and financial cooperation. It sets global banking standards (like Basel I, II, and III) that ensure financial stability. Through its regulatory guidelines, BIS influences how banks manage liquidity and credit risks, which directly affects global trading capital and interest rate dynamics.
5. Trade and Economic Agencies: Facilitating Global Commerce
5.1 World Trade Organization (WTO)
The WTO governs international trade by establishing fair-trade rules, reducing tariffs, and resolving disputes. Its policies ensure predictability and transparency in trade relations, thereby influencing the financial transactions underpinning global commerce.
For example, when the WTO mediates trade conflicts (like the U.S.–China tariff disputes), the outcomes significantly impact global markets, commodity prices, and investor confidence.
5.2 Organisation for Economic Co-operation and Development (OECD)
The OECD fosters economic cooperation and policy alignment among member nations. By promoting responsible taxation, anti-bribery measures, and sustainable investment practices, it enhances investor trust and corporate accountability in global trade.
6. Impact of Financial Agencies on Currency and Capital Markets
6.1 Influence on Exchange Rates
Monetary agencies and central banks have a profound impact on foreign exchange (forex) markets. Through interventions, interest rate adjustments, and monetary policy decisions, they affect currency values — which in turn influence trade competitiveness and capital flows.
For instance, when the U.S. Federal Reserve raises interest rates, the U.S. dollar strengthens, making imports cheaper and exports less competitive, thereby reshaping global trade balances.
6.2 Regulation of Capital Flows
Agencies set rules that regulate the flow of capital between nations. The IMF monitors these flows to prevent speculative attacks on currencies and financial contagion — where instability in one market spreads to others. Proper regulation ensures smoother functioning of global capital markets, essential for international trade financing.
7. Technological and ESG Agencies: The New Frontier of Global Finance
7.1 Financial Technology (FinTech) Oversight
As digital trading platforms, cryptocurrencies, and algorithmic trading gain prominence, new regulatory agencies have emerged to oversee digital finance. Institutions like the Financial Conduct Authority (FCA) in the UK and the U.S. CFTC have introduced frameworks for crypto assets, digital securities, and online trading to prevent cyber fraud and enhance transparency.
7.2 Environmental, Social, and Governance (ESG) Standards
Agencies now emphasize sustainable finance. Organizations such as the United Nations Principles for Responsible Investment (UNPRI) and the Task Force on Climate-Related Financial Disclosures (TCFD) promote ESG reporting standards.
By linking environmental and social impact with financial performance, these agencies are reshaping global trading norms — driving capital toward green and ethical investments.
8. Challenges and Criticisms of Global Financial Agencies
Despite their significance, financial agencies face multiple challenges:
Overregulation vs. Market Freedom: Excessive rules may stifle innovation and market efficiency.
Conflict of Interest: Especially among rating agencies that are paid by the entities they rate.
Unequal Representation: Developing nations often argue that institutions like the IMF and World Bank favor Western economies.
Delayed Responses: Bureaucratic processes sometimes hinder timely interventions during crises.
Technological Lag: The rapid rise of decentralized finance (DeFi) and cryptocurrencies outpaces traditional regulatory frameworks.
These limitations underscore the need for continual evolution in agency governance and accountability.
9. The Future of Agencies in Global Finance
As global markets become more interconnected and digitized, agencies must adapt to new realities. The future landscape will likely see:
Integrated Global Regulation: Greater cooperation among international agencies to standardize cross-border financial regulations.
Digital Financial Oversight: Stronger frameworks for blockchain, AI-driven trading, and cyber resilience.
Sustainability-Linked Policies: ESG standards becoming mandatory for international financial reporting.
Decentralized Agency Roles: New institutions emerging to govern decentralized finance and tokenized assets.
Agencies that evolve with innovation, transparency, and inclusiveness will define the next era of global financial stability and growth.
10. Conclusion
Agencies serve as the nervous system of global finance, transmitting information, enforcing discipline, and maintaining equilibrium across an increasingly complex trading ecosystem. From regulatory oversight to monetary stabilization and sustainability advocacy, their influence pervades every aspect of global trade and investment.
In a world where financial transactions transcend borders within milliseconds, the role of agencies in ensuring trust, fairness, and resilience has never been more vital. While challenges persist — ranging from bias and bureaucracy to technological disruption — their continued evolution will determine how effectively global finance can navigate uncertainty, foster inclusive growth, and sustain economic stability in the decades ahead.