Community ideas

MSFT WARNING!Here is a closer view of the chart I posted back on Oct 5, 2024, for a nice profitable -25% drawdown.
This time will be far more profitable.
Here is a breakdown of the chart.
- Up against a 38-year trendline.
- A rare 5-wave rising wedge.
- A H & S with a head test
- Big Ass Gap Below
- Double top M pattern that CRACKED!
- Rising Bearish Wedge.
This is just getting started!
Bulls, if you didn't make your money in MSFT yet and are trying to squeeze a little bit more profits bc you are too damn greedy. Then you deserve what you get next.
THANK YOU for getting me to 5,000 followers! 🙏🔥
Let’s keep climbing.
If you enjoy the work:
👉 Boost
👉 Follow
👉 Drop a solid comment
Let’s push it to 6,000 and keep building a community grounded in truth, not hype.

CADJPY LONGSExpecting buyers to take over and push the pair back to its previous highs.
We can see there has been an attempt to push lower which failed with support holding around 112.905.
TP1: 114.525
TP2: 115.000

SUI short to back to the lows!Sui short matches my grade A DTT setup. Took this one on personal account. Aligns with higher tf trend, soon to move fall it seems.
Sl: $1.4533
TP1: $1.37
Tp2: $1.34
3 to 4.37RR

Prop Firms vs Real Accounts: The Structural Trade-Off Most TradeMost comparisons between prop firms and real accounts focus on capital size, profit splits, or challenge difficulty. What is discussed far less is how each environment reshapes the way traders think, decide, and execute. The difference is structural, and it has a direct impact on performance.
Prop firm accounts are rule-bound by design. Daily drawdown limits, maximum loss thresholds, and evaluation deadlines create a narrow operating window. These constraints reward control and consistency, but they also introduce pressure. Every trade is filtered through the question of survival. Traders become highly sensitive to short-term equity fluctuations because a single mistake can end the account.
This changes behavior in subtle ways. Traders hesitate to hold through normal drawdowns, cut winners early to protect equity, or avoid valid setups late in the day to reduce risk exposure. None of these actions are irrational. They are logical responses to the environment. The issue arises when traders confuse rule compliance with optimal execution.
Real accounts remove these external constraints. There is no forced stop at a daily loss and no expiration date. Drawdowns are uncomfortable but recoverable. This freedom allows for longer holding periods, broader trade selection, and more flexibility in execution. At the same time, it demands a higher level of internal discipline. Without rules enforced externally, risk management becomes entirely self-regulated.
Many traders perform well in one environment and struggle in the other because the skill sets are different. Prop firms reward precision, restraint, and consistency under pressure. Real accounts reward patience, emotional regulation, and long-term thinking. Success in one does not automatically translate to success in the other.
The mistake is treating prop accounts as practice for real trading without acknowledging the incentives involved. The rules shape behavior, expectations, and even strategy selection. Traders who understand this stop blaming themselves for feeling constrained or overly cautious.
Neither model is superior. Each serves a different purpose. Clarity comes from aligning your approach with the structure you are trading under, rather than forcing one mindset into the wrong environment.

GOLD ( Road Map )TVC:GOLD ⬇️ ( Road Map )
Golden Advices.
********************
1) This is only a road map for TVC:GOLD depends on weekly time frame
2) This is not a financial a advice
3) Please calculate your losses before any trade
4) Do not enter any trade you find it not suitable for you.
5) No FOMO - No Rush , it is a long journey.
_____________________________________________________
since the Gold is already achieved the whole targets so ........
1) Shorting from that range is very nice entry for starting a new downtrend⬇️
2) Price has to break the last low by huge candle then retest to continue the downtrend⬇️
3) Shorting here depends on weekly time frames
4) Targets may take very long time to be achieved ( weeks & Months)
5) smart money will move the money from ⬇️GOLD to CRYPTO⬆️ & STOCKS⬆️.
_____________________________________________________
GOLD / Short ⬇️
recommended entry range (4850 - 5500)
recommended stop loss 5600
T1 4500
T2 4000
T3 3550
T4 3150
T5 2800
3 optional extra targets
EXT T. 2600
EXT T. 2200
EXT T. 1950
_______________________________________________________

Lockheed Martin | LMT | Long at $472.00Lockheed Martin $NYSE:LMT. The war machine keeps turning... while there may some temporary "peace" with the new Trump administration, it is just never (unfortunately) permanent.
The price has entered my historical simple moving average area. If there is a bounce, I expect it to be between the current price of $466.00 and $450.00. I've started a small position at $472.00 and will grab more shares if it hits $450. Now, if the aerospace and defensive industry goes through a downtrend with the new presidential administration, I expect the price to fill the daily price gap near the low $400s - which is only an even better bargain, in my opinion.
Target #1 = $500.00
Target #2 = $535.00
Target #3 = $610.00

Honeywell: Brief SetbackHoneywell's stock initially maintained its upward momentum but has recently slipped into a distinct setback, with selling pressure briefly stalling the rally. Imminently, we anticipate continued upward movement, as we see potential for gains above the resistance levels at $233.59 and $250.20 as part of the green wave . However, if price continues to fall and breaches the support at $168.65, our alternative scenario could come into play. In this case, we would consider the green wave alt. as already concluded and place Honeywell in the green wave alt. (probability: 34%).


GBPUSD LONG POSSIBILITYLets see what execution plan shows.
1.H4 OB
2. I-FVG
3. CISD
4. FVG
5. Retrace to M15 FVG

DOGE/USDT: Defending the High-Time-Frame Support ClusterThe Macro Context DOGE/USDT is currently interacting with a High-Confluence HTF (High Time Frame) Support Cluster on the Daily timeframe. After a period of corrective price action, the asset has entered a stabilization phase within a historical demand zone. This area has previously acted as a springboard for liquidity absorption and trend reversals.
Why this setup is on our radar:
Support Cluster Defense: The chart highlights a well-defined demand block where buyers have consistently stepped in. The price is currently testing the lower boundary of this zone, providing a logical area for risk-defined entries.
Volatility Compression: We are observing a decrease in selling momentum as price approaches the 0.117 - 0.120 region. This compression often precedes an expansion phase as the market seeks new liquidity.
Market Structure: While the immediate trend has been corrective, the ability to hold this HTF floor suggests that the broader accumulation structure remains intact. We are looking for a "Spring" or higher-low formation to confirm the reversal.
Technical Levels & Plan:
Accumulation Zone: We are watching the 0.120 - 0.125 region for structural stabilization.
Invalidation Level: The bullish thesis is strictly contingent on holding this support cluster. A Daily close below the swing low (~0.1139) would signal a breakdown of the HTF structure and invalidate the setup.
Structural Resistance (Targets): Short Term: 0.130 - 0.135 (Immediate Reclaim) Mid Term: 0.145 - 0.150 (Range Highs)
Macro / Moonbag: If momentum reclaims the 0.150 level, we look toward 0.160+ and a challenge of yearly highs.
Risological Note: We are trading the "reaction" at support, not the prediction. A bounce here validates the level; a slice through it invalidates the trade immediately.
Disclaimer: This analysis is for educational purposes only. Crypto assets are highly volatile. This is not financial advice.
Check my trading setup: Links below.

WLD TECHNICALS LOOKING BULLISH🔥 Fortune AI Radar — EURONEXT:WLD
Fresh activity detected on EURONEXT:WLD today.
Data suggests increasing market interest & buyers stepping in.
Technicals currently lean bullish, with momentum trending upward.
Whales showing hints of accumulation and hype rising among trader

TeraWulf Inc. (WULF)TeraWulf Inc. I am looking for an entry today. triangle has being breached, which looks like W4. upside potential 20.00+
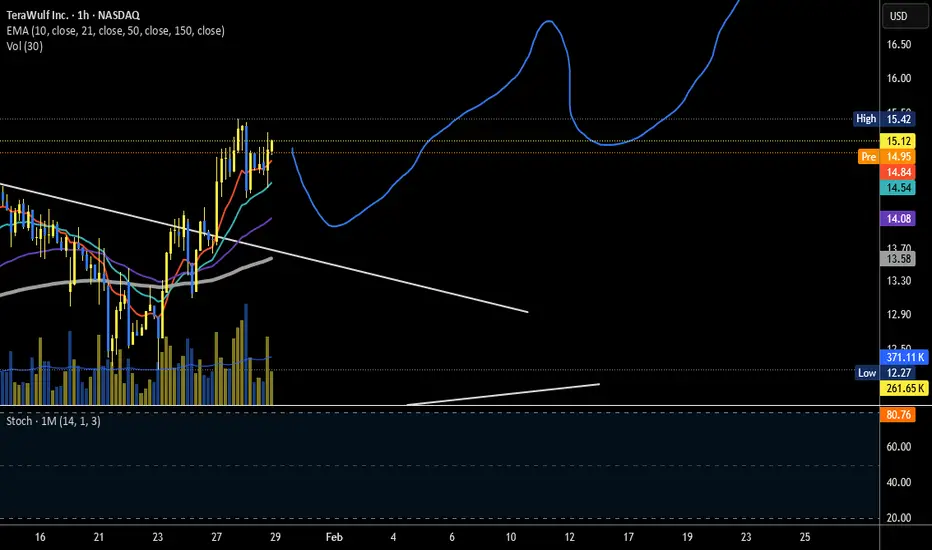
Bullish and continuationDepending on were this lands after earnings call, I believe this is still bullish. It will need to consolidate a few times before going higher.

1/21/26 - $now - Okay, catching my eye1/21/26 :: VROCKSTAR :: NYSE:NOW
Okay, catching my eye
- didn't like it at 2x this price (rare 'call the top' wtf post in 1/29/25 nearly a year ago), but at today's levels... i think you'll be fine
- rule of 40 king
- major lock in checks box of "installed base" in a world where some 14 year old wiz bang from pesovakia can vibe code your ITSM business in 2 hours and 3 minutes with a free claude code subscription, five monster energy drinks and a hawt sales chicka that's really a shirtless lackey using an AI filter to sell 70% of fortune 100 co's over Teams call and order in group dinner.
- yeah.
- so here's the conclusion i'm coming to on AI
- if you're a feature business, figure out how to turn up the heat.
- if you have lock in, you have time. big customer installed base > SMEs
- private data moats matter
- next gen of LLMs will be trained on narrow and hyper specialized data sets. it costs a lot more to serve a lower quality product when you are employing any genearl purpose frontier LLM. this matters.
- growing networks are hard to disrupt
- alas i keep coming back to eth, so everything in my world will now be compared to eth
- and while NYSE:NOW is vastly different, at 30x PE... low SD fcf % but still compounding 20%... i think you'll be just fine
- this is high up on a "would buy if we go into the abyss of risk off all beta get low like lil Jon".
- so play those bee gees. stay alive
- don't get too greedy too soon, have a plan
- make the lists now, not tomorrow. know what you like and why. try to stay focused. no spray and pray okay?
- and remember, by the point where you ape in the lows and think to your self 'tf am i doing'... you'll be doing it right, ironically.
- we're not there yet
- like to keep some gas on the ol pedal so while i'm mostly cash and picking spots here... i have decided on NASDAQ:SBET 35% (all shares acknowledging i think drawdown could take this another 20-30% so i'm ready), NASDAQ:DUOL (drawdown to low 100s) and NASDAQ:ADBE (perhaps mid $200s). and for something like NYSE:NOW anything near $100 is probs a smooth brainer own.
- $110 support
- $100 ape.
- $90 call the wife and sell the house territory.
V

NZDUSD (H1) Bullish Structure with Pullback and Reaction ZonesSymbol: NZDUSD
Timeframe: 1H
The chart presents a bullish market structure with a sequence of higher highs and higher lows. After an impulsive upward move, price retraced into a previous demand area, where buying interest appeared again in line with the prevailing trend.
The analysis focuses on the following aspects:
* The overall market structure remains bullish
* The pullback respects prior demand and dynamic support
* Price is reacting within historically significant zones
* Highlighted areas are used to illustrate potential reactions rather than predictions
This idea is shared to demonstrate how price behaves during pullbacks within an existing trend and how reaction zones can be identified for market structure analysis.
Disclaimer
This content is provided for educational and informational purposes only and does not constitute investment advice. Market conditions may change at any time and outcomes are not guaranteed.

US30Daily Bias: Buy
Setup: ICT
Confirmation:
1) Solid Break PDH
2) AMD Concept
3) Break Daily Open
"Rule-Based Trading Sytem"

GBPJPY LONGTechnical
Price broke the Weekly low making a Daily bullish reversal pattern retesting the an old IMB on the daily timeframe
Price broke the previous days high
Price retested the IMB and D/50 fib level making a 4H/bullish engulfing candlesticks and 2H + 3H bullish reversal candlestick patterns

XAU/USD: Post-News Spike Near 5,600 Signals Potential PullbackXAUUSD fulfilled the previous bullish setup with a sharp, news-driven spike into the 5,600 resistance — stretching far above short-term value and the rising trendline. This type of vertical move often signals temporary exhaustion. If the market fails to hold above 5,600, gold may retrace toward 5,375, where the broken range top and trendline support align.
➡️ Primary scenario: rejection near 5,600 → pullback toward 5,375.
❗️ Risk: acceptance above 5,600 may lead to new highs.

SILVER (XAGUSD) – 3H | Structure UpdateSilver remains in a bullish structure, trading within a rising channel. Momentum is extended near resistance, suggesting pause or shallow pullback, not reversal.
Key Levels
Resistance: 120.55
Support: 117.7
Pullback zone: 115 – 114.8
Major support: 112 / 102.5
Continuation
Hold above 117.7 + break 120.55 → trend continuation
Structure weakens only below 112
Educational view only. Not financial advice.
#XAGUSD #Silver #TechnicalAnalysis #PriceAction #MarketStructure #TrendAnalysis #Commodities #TradingView

BULLISH MOVEAfter a long bearish move, buyers are gaining momentum again. HL to LH being formed and break of a bearish trendline. Lets hope for bullish movement....

Seems like confirming HL.29-01-2026
Seems like confirming HL.
It should not break 19 now.
Upside, it may touch 23 - 24 again.

EUR/JPY Market Analysis: Macro + Structure [MaB]1. The Macro Context (The "Why") 🌍
Hi traders! Before looking at the candles, let's look at the money.
My fundamental scoring table speaks clearly: there is a huge differential that we cannot ignore.
Key Factor Analysis:
🏦 Rate Expectations: Explanation: The BCE remains neutral with a trend holding stance and no clear bias in recent decisions, while the BOJ is the only hawkish central bank in the G7 with a recent +25bp hike and an aggressive stance. Score EUR: 0 Score JPY: +2
🎈 Inflation: Explanation: Eurozone inflation is at 2.14%, close to the 2% target, representing a controlled situation. JPY inflation at 2.91% is above target, justifying the BOJ's hawkish stance. Score EUR: 0 Score JPY: +1
📈 Growth/GDP: Explanation: Europe is facing worrying economic stagnation with a GDP of 0.7%. Japan's growth is also weak at 0.5%, which limits the space for overly aggressive rate hikes. Score EUR: -1 Score JPY: -1
🏭 PMI Data: Explanation: EUR PMI is neutral (weighted 50.65). JPY shows manufacturing expansion with a weighted PMI of 52.66. Score EUR: 0 Score JPY: +1
⚖️ Risk Sentiment: Explanation: Market is currently in a neutral regime; EUR is semi-cyclical and JPY is a safe-haven, but no significant risk-off flows are present. Score EUR: 0 Score JPY: 0
🗞️ News Catalyst: Explanation: Recent EUR CPI came in at 1.9% vs 2.0% expected, a moderate negative surprise. JPY benefits from exceptional hawkish policy momentum. Score EUR: 0 Score JPY: 0
Currency Score Summary:
Total Score EUR: -1 ( ) Total Score JPY: +2 ( )
Synthesis:
EUR (Weak, Score -1): The Euro is under pressure due to economic stagnation and a neutral central bank. JPY (Strong, Score +2): The Yen is strong, supported by a hawkish BOJ that stands out as an outlier in the G7. Conclusion: With this scenario, we are only looking for .
Going against this bias would be statistical suicide.
2. The Technical Setup (The "Where") 📉
Timeframe: 4h | Pair: EUR/JPY
The SMC Market Structure + Price Zones indicator gave us the confirmation we needed for our statistical edge.
Here is where the indicator makes the difference. Look at the dashboard on the right, numbers don't lie:
🚀 Continuation Rate (60%): We are exactly at the 60% threshold.
This tells us the market is in a healthy, directional trend.
Statistically, betting on continuation pays off more than looking for a reversal.
🔥 Streak (0) & Streak Pct: 2 We are at the start of a potential new leg after a period of correction.
It's a mature trend (we are in the 2nd percentile of trend extension), so watch those stop losses, but as long as the music plays, we dance.
🔄 Retest (85.4%): The indicator tells us that statistically, when price creates a new Break of Structure (BOS), it retraces into the previous zone 85.4% of the time.
Therefore, it pays to wait for a deep retracement into the supply zone to maximize our Risk/Reward ratio.
💥 BOS/Ret Rate (41.5%): This parameter tells us that once price retraces inside the previous zone, it has a 41.5% probability of reacting and creating a new BOS.
🎯 Extension Rate (1.82x): The algorithm projects an ambitious target.
We expect this move to extend 1.82 times the current pullback leg. That's where we'll take profit.
3. Execution Plan on Chart
Moving to the chart, the SMC Market Structure + Price Zones indicator supports us in pinpointing liquidity to define entry and stop loss:
Entry and Stop Loss: We place a limit entry in the Supply Zone 4h (Red Band) and the stop loss a few pips above the zone.
Take Profit: We leverage the asset's statistical analysis offered by the Extension Rate and place the target by measuring with Fibonacci at 1.8x relative to the pullback leg.
Trade Parameters:
Entry Price: 185.416 Stop Loss: 186.181 Take Profit: 178.850
⚠️ Disclaimer: This analysis is based on a proprietary algorithm and is shared exclusively for educational and didactic purposes.
It does not constitute financial advice or investment solicitation in any way. Trading involves significant risk.
