BTCUSD – Bearish Continuation After Range Breakdown (1H)Bitcoin was previously moving inside a clear consolidation range (highlighted in green). Price broke below the range support, triggering strong bearish momentum and confirming a bearish market structure shift.
Key Technical Levels
Range High / Supply Zone:
The upper red zone represents previous support that has now flipped into resistance.
Range Low / Demand Zone:
The lower red zone marks a key liquidity area where price may react.
Break & Retest:
Price retraced back into the broken support zone and faced strong rejection, validating the bearish bias.
Trade Idea
Bias: Bearish
Entry Area: Sell on pullback into resistance (around 81,500 – 82,500)
Target 1: Lower consolidation support (Target 1)
Target 2: Deeper downside continuation (Target 2)
Stop Loss: Below invalidation level (around 75,700)
Technical Confluence
Clear range breakdown
Strong impulsive bearish move
Lower highs forming on retracement
Support turned resistance confirmation
Outlook
As long as price stays below the broken range and supply zone, the bearish continuation scenario remains valid. Any retracement into resistance may offer high-probability short setups with favorable risk-to-reward.
Community ideas
EURUSD – Monitoring for USD StrengthThis week, my focus is on the U.S. dollar, and EURUSD is one of the primary pairs I’m watching.
After an extended bullish sequence, EURUSD is showing signs of corrective behavior, rather than impulsive continuation. Momentum has slowed, structure has become more complex, and price is interacting with key retracement zones.
At this stage, I am not trading a directional bias.
I am watching to see whether USD strength begins to materialize through structure, invalidation, and follow-through.
If USD strengthens, EURUSD could offer long USD / short EUR opportunities with clear risk definition.
If not, I remain flat.
📌 Structure first
📌 Invalidation before entries
— MrLiquidOnFX
FRO Weekly scale CCI system construction, insights and analysisLooking at FRO from a weekly scale perspective. I believe FRO has a Doug R MIMBO formation in place, am confirming with him on his silicon investor thread (56ers). The video outlines the construction of CCI trendlines and cross horizontals, provides more indepth insights into trendlines created during wiggles and looks in the near term at area's I like for accumulation
MNQ Daily Analysis - Friday February 21 2025 part 1Lets dive into the bear market of early 2025.
------------
As a learning, beginner day trader I go through the market replay predefining what I am looking for to enter a trade and walk through my thoughts as I experience the market action bar by bar throughout the entire day to see how I handle various events and assess my execution.
This is for me and others to learn if you desire.
4 Hour Liquidity ZonesHere are the current Highs and Lows marked out on the 4 hour chart. As of now, Nas seems to be directionless. Until we see a break above or a break below price is in a sideways area. If price makes new highs and lows within the sideways area, that may give us a clue as to what side we may may win the tug of war battle. Always be careful trading in directionless action as there may be a lot of chop and running of stops.
ETH – Simple Range & Liquidity Breakdown Here’s how I’m looking at ETH based on the higher-timeframe chart
ETH is trading inside a very large dealing range.
Range High: $4,473
Range Low: $75
The yellow 50% level (midpoint of the range) is very important.
If price breaks and holds below this 50% level, the move that previously helped push price up toward the dealing range high can flip.
That area can turn into a Breaker Block, meaning old support becomes new resistance (also called a Mitigation Block).
If that support does turn into resistance, I expect price to push lower.
Below current price, there are two clear Equal Lows (EQLs).
These are areas where price has made the same lows before, meaning liquidity is likely sitting there.
Markets often revisit these levels to grab liquidity, so they are logical downside targets.
My main Point of Interest (POI) for buys is much lower, where price previously showed strong reactions:
Buy zone: $711 – $399
This is where I would expect stronger demand to step in, not chasing price higher.
Summary:
If ETH fails to hold above the 50% midpoint, the current support could flip into resistance, opening the door for a move down into the EQLs and potentially into my POI buy zone.
Not financial advice.
Signed: Lord MEDZ
EURCAD SHORTMarket structure bearish on HTFs 3
Entry at both Weekly and Daily AOi
Weekly Rejection at AOi
Previous Weekly Structure Point
Daily Rejection at AOi
Previous Daily Structure Point
Daily EMA retest
Around Psychological Level 1.62000
Touching EMA H4
H4 Candlestick rejection
TP: WHO KNOWS!
Entry 115%
REMEMBER : Trading is a Game Of Probability
: Manage Your Risk
: Be Patient
: Every Moment Is Unique
: Rinse, Wash, Repeat!
: Christ is King.
XAUUSD (Gold) – Bearish Continuation After Channel BreakdownGold previously respected a well-defined ascending channel, showing a strong bullish trend. However, price broke decisively below the channel, signaling a trend shift from bullish to bearish. The breakdown was followed by strong bearish momentum, confirming seller dominance.
Key Technical Zones
Broken Support → Resistance:
The marked red zones are former support areas that have now turned into supply / resistance.
Rejection Confirmation:
Price retested these zones and faced strong bearish rejection, validating them as sell areas.
Trade Idea
Bias: Bearish
Entry Zone: Sell on pullback into resistance (around 4,980 – 5,100)
Target 1: Previous demand zone (Target 1)
Target 2: Lower support / continuation target (Target 2)
Stop Loss: Below the invalidation level (around 4,726)
Confluence Factors
Ascending channel breakdown
Lower highs and lower lows forming
Strong bearish impulse after retest
Clear risk-to-reward structure
Conclusion
As long as price remains below the broken channel and resistance zones, the bearish scenario remains valid. Any retracement into resistance may offer high-probability sell opportunities targeting lower liquidity zones.
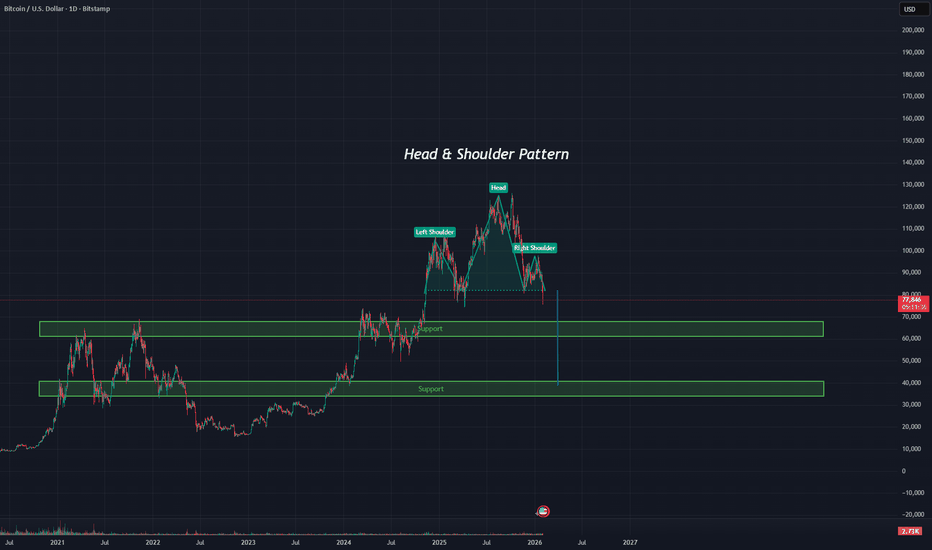
Head and Shoulder Pattern on Bitcoin Bitcoin has confirmed a bearish head and shoulders breakdown, with the measured move projecting toward the second support zone around the $40k region. Rather than chasing downside momentum, I’m looking to position bids into this area, as it aligns with prior structure, high-timeframe demand, and historical range support. In my view, this zone represents a high-probability area for the bear-market bottom, or at minimum a significant relief bounce. As always, I’ll be managing risk and scaling entries, letting price confirm before committing fully.
Not financial advise
XAUUSD Weekly Outlook | Key Levels to WatchGold sold off aggressively last Friday, closing the week at 2,895. Price is now trading below both the MA50 and MA200 on the 1-hour chart, and we may see a retest of these levels at some point. However, for a substantial move higher, we need to reclaim the key resistance zone, which will open the door for higher targets.
Despite the short-term weakness, the higher-timeframe structure remains bullish, suggesting that pullbacks may still be corrective.
Price is currently sitting just above the first reaction zone. If that zone fails, we may see further selling pressure into the lower support zones for potential reaction.
📌Key levels to watch:
Resistance:
4957
5041
5118
5202
Support:
4867-4792(First Reaction Zone)
4676-4586( Support Zone)
4491-4408 (HTF Support Zone)
👉 Let key levels guide your decisions — wait for confirmation and manage risk accordingly.
🔍Fundamental focus:
This week’s focus is on the US labour market, with ADP, ISM Services, and Non-Farm Payrolls as the main volatility drivers.
Alongside macro data, ongoing geopolitical tensions remain in the background and may continue to support gold as a safe-haven, adding an extra layer of volatility throughout the week.
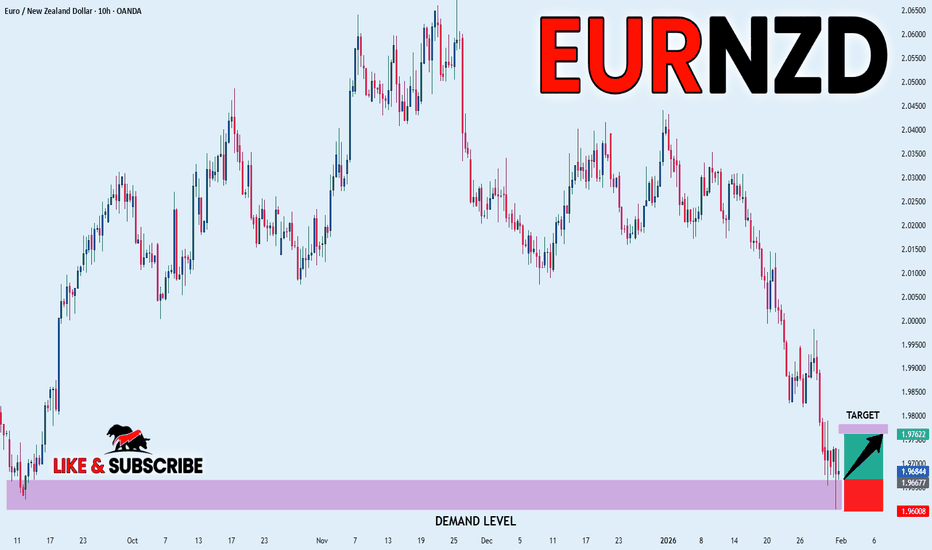
EURNZD FREE SIGNAL|LONG|
✅EURNZD strong displacement into HTF demand with sell-side liquidity swept. Bullish reaction suggests mitigation complete, expecting continuation toward nearby imbalance highs.
—————————
Entry: 1.9667
Stop Loss: 1.9600
Take Profit: 1.9762
Time Frame: 10H
—————————
LONG🚀
✅Like and subscribe to never miss a new idea!✅
UAI Analysis (8H)Before anything else, it’s crucial to understand that this is a highly volatile and high-risk asset. Proper risk management is essential always manage your leverage carefully and protect your capital. Do not enter a position impulsively; wait for proper confirmation signals and a clear trigger before executing any trade. Patience and discipline are key in trading assets like this.
Looking at the chart, from the point where we placed the red arrow, it appears that a UAI correction has begun. This correction seems to take the form of an ABC structure, though it could also develop into a more complex corrective pattern. At the moment, Wave B of this correction looks like it is forming a diagonal, and we are currently in its g wave. This wave may require additional time to complete fully, especially within the red highlighted zone.
It’s important to monitor Wave B carefully. If Wave B ends up being symmetrical, rather than a diagonal, this has major implications. Symmetrical waves have two additional sub-waves compared to diagonals, meaning that Wave B could potentially extend further than initially expected. Traders should remain alert for this possibility and adjust their strategy accordingly.
From the red zone, we can anticipate a potential price rejection toward the specified target levels. This zone represents a critical area where supply/demand dynamics could shift, offering high-probability setups for traders who exercise patience and discipline.
However, it’s important to note that this analysis will be invalidated if a daily candle closes above the designated invalidation level. Such a close would signal that the market is likely breaking out of the current corrective structure, requiring a reassessment of the trade idea.
In summary, maintain strict risk management, watch for confirmations before entering, pay attention to the development of Wave B (diagonal vs. symmetrical), and use the red zone as a key area for potential price action and trade setups. Trading with patience and discipline in these volatile conditions is the only way to protect capital and maximize potential gains.
If you have a coin or altcoin you want analyzed, first hit the like button and then comment its name so I can review it for you.
This is not a trade setup, as it has no precise stop-loss, stop, or target. I do not publish my trade setups here.
GBPCHF SHORTSMarket Structure bearish on HTFs 3
Entry at Daily AOi
Weekly Rejection at AOi
Previous Weekly Structure Point
Daily Rejection At AOi
Previous Daily Structure Point
Around Psychological Level 1.06000
Touching EMA H4
H4 Candlestick rejection
Rejection from Previous structure
TP: WHO KNOWS!
Entry 110%
REMEMBER : Trading is a Game Of Probability
: Manage Your Risk
: Be Patient
: Every Moment Is Unique
: Rinse, Wash, Repeat!
: Christ is King.
50% Fib resistance ahead?USD/JPY is rising towards the resistance level, which is a pullback resistance that aligns with the 50% Fibonacci retracement and could reverse from this level to our take profit.
Entry: 155.62
Why we like it:
There is a pullback resistance level that aligns with the 50% Fibonacc retracement.
Stop loss: 157.21
Why we like it:
There is a pullback resistance level.
Take profit: 153.64
Why we like it:
There is an overlap support level.
Enjoying your TradingView experience? Review us!
Please be advised that the information presented on TradingView is provided to Vantage (‘Vantage Global Limited’, ‘we’) by a third-party provider (‘Everest Fortune Group’). Please be reminded that you are solely responsible for the trading decisions on your account. There is a very high degree of risk involved in trading. Any information and/or content is intended entirely for research, educational and informational purposes only and does not constitute investment or consultation advice or investment strategy. The information is not tailored to the investment needs of any specific person and therefore does not involve a consideration of any of the investment objectives, financial situation or needs of any viewer that may receive it. Kindly also note that past performance is not a reliable indicator of future results. Actual results may differ materially from those anticipated in forward-looking or past performance statements. We assume no liability as to the accuracy or completeness of any of the information and/or content provided herein and the Company cannot be held responsible for any omission, mistake nor for any loss or damage including without limitation to any loss of profit which may arise from reliance on any information supplied by Everest Fortune Group.
Gold long-term outlook- 1M timeframe-bearish
It seems Gold is entering a year-long correction.
I am incorporating my main and alternative scenarios for gold into this analysis, both seeing Gold correcting either a wave 2 or wave 4.
I am looking at the following potential dips:
Dip 1: 4,225
Dip 2: 3,700
Dip 3: 3,000
Invalidation: 5,600


